Some Economic Aspects of Land Use Policy
in Irfeland
By E. A ATTWOOD
{Read before the Society on April 30th, 1965)
It might seem unnecessary to preface a paper on land use in Ireland with an account of the importance of land in the economic and historical life of Ireland, yet the fact remains that there have been very few studies published of the factors determining1 land use in Ireland, or assessments of the extent to which actual land, use is correlated to the economic optimum There is, of course, a very considerable literature on the land question, but the general assumption underlying the long debate on this issue was that, once the political difficulties of ownership were overcorne, the pattern of utilisation would automatically follow the optimum one This paper sets out to examine the current trends in the pattern of land use, to discuss the factors which must be considered m any delineation of the optimum utilisation of the land m the country, and finally to examine the problems and opportunities for improving the existing uses of land. There is at present a growing interest m the theoretical problems in-volved in the regional planning of land use, and of the computational problems in particular case studies. For example, in the mter-regional programming model in India a projected gam of around 12 5 per cent in total food production would have arisen from a re-allocation of pro-duction from given resources among regions, even when limits were placed on the magnitude of shift which can take place1 In a study of the broad impact of the removal of all institutional barriers to the production and movement of milk in the northern states of the U S A , it was con-cluded that "great transitional difficulties would be involved for producers and some processors and distributors in the region in adjusting to an equilibrum situation" 2
This work has not been confined to hypothetical situations, it is now of growing importance m decisions affecting land use In a paper on "Some Operations Research Applications m the Conservation of Wild-Land 1 Narindar S Randhawa and Earl O Heady, "An Interregional Programming Model for Agricultural Planning in India", Journal of Farm Economics, Vol 46, No 1, Feb
1964
2 D A West and G E Brandow, "Space Product Equilibrum in the Dairy Industry
Resources" (broadly the use of "other land" areas, including afforestation, rough grazing and watersheds) it is argued that this technique offers considerable promise as a means of dealing with the problems of "the long-term periods involved, the multiple uses of land, and by definition, man's limited control over the total environment" 3 There is a growing need for a comprehensive analysis of these problems under Irish conditions This paper is concerned with the present knowledge of land use m Ireland, and with the development of suitable criteria which will be needed under the new planning legislation that has recently come into operation
CURRENT TRENDS IN LAND USE
It is not my intention to dwell at any length on the history of land use in Ireland, but in Table A of the Appendix the figures are given of the major crops and livestock since 1847. The only conclusion that is relevant for this present paper is the very obvious consequences of the contemporary economic forces on the use of land at any time. It is necessary to remind ourselves of this in view of the widely-held belief that there is some uniquely correct use for land without any reference to the interaction of the econom-ic issues involved The fall of the potato acreage from 860,000 acres in 1861 to less than one quarter of this a century later, the extraordinary similarity m the wheat acreage at these two dates, the decline m the acreage of oats at a rate even faster than that of potatoes, and the ups and downs m the acreage of hay can only be explained with reference to the economic en-vironment over these years In some instances, the broad trend in social and economic change is a sufficient guide (as in the case of potatoes) but with other crops a detailed analysis of the economic factors at particular times is necessary to explain these trends (for example, the case of wheat)
Of the 17 million acres of land (including woods and plantations, grazed and barren mountain, turf bog, marsh, roads, etc ) grassland and meadow-land currently account for around 55 per cent, of this about one-fifth is cut for hay The 3 million acres of rough grazing is essentially an extension of this grassland acreage (and indeed part of it has, m the past, been recorded as pasture), but its present output is at such a low level that alternative uses, of which forestry is the most important, are economically feasible
The tillage acreage in 1959-61 was divided between crops grown for sale or used in the farm-house (720,000 acres) and those grown and fed to livestock on the farm (900,000 acres) The acreage of sale crops consists of almost 16,000 acres of fruit and vegetables (or only one per cent of the tillage acreage, and 0 1 per cent ^of the total area of the State), approxi-mately 500,000 acres grown for home consumption and 200,000 acres grown for sale but used for livestock feeding
The data of the volume of agricultural output given in the Second Programme, together with the current trends in yields of the mam crops, 3 A Broido, R J McConnen and W G O'Regan, based on a paper presented to
make it possible to project with reasonable confidence the pattern of land use that is likely in 1970 This is given in Table A (Appendix) and shows only small changes in the main totals compared with the present pattern The really important question is the degree of intensity of land use, rather than the particular category to which the land has been allocated The continuance of around 10 m acres of grassland must be associated with a far more intensive production policy if this grassland is to be justified in terms of the national economic goals
The area under urban settlement4 was just under 150,000 acres m 1961, and seems likely to rise to around 175,000 by 1970 The problem of the encroachment of urban settlement on agricultural land has not been as serious in Ireland as in other European countries, but is giving rise to concern in particular areas
Another sector in which the problems of competing uses is beginning to give rise to some local difficulties is that of forestry, which by 1970 is likely to account for 550,000 acres As the forestry programme proceeds, it is bound to give rise to increasing difficulties in the acquisition of land The decisions on the choice of forestry or agriculture for particular sections of land are of great importance because of the very long-term commitment involved in afforestation The social and economic factors in extending or restraining developments in urban settlement or forestry m particular areas must be examined sympathetically but impartially, and I would like to come back to the issues involved in this choice later
The changing patterns of land use during the current decade can be summarised in terms of the national cropping and stocking rates per 1,000 acres of crops and pasture Wheat and oats are likely to drop to less than 20 acres each per 1,000 acres crop and pasture, compared with over 30 acres in 1961 The 1970 agricultural targets will involve over 150 cows, nearly 350 other cattle, together with almost 600 sheep per 1,000 acres This level of stocking will only be reached if a very large improvement m grassland husbandry is achieved At the same time, unless the total number of persons m rural areas begins to rise in relation to the agricultural labour force, then the density of the rural population is likely to fall to less than 100 per 1,000 acres crop and pasture, or only about one-third of the level a century ago The rate at which these changes are currently taking place must give rise to very large problems of adjustment in the agricultural sector, which should not be underestimated in terms of their social and demographic consequences This is one of the most important of the consequences of a high rate of economic development, and the need for assistance towards solving these problems is becoming more generally accepted as a factor m social and economic development over the coming years
TABLE 1
CROPS, STOCK AND PERSONS PER 1,000 ACRES CROPS AND PASTURE
Wheat Oates Total Corn Potatoes Total Roots Hay Pasture Horses Cows
Total Cattle (including cows) Total Sheep
Persons in rural areas
1851 35 7 132 0 198 0 55 5 89 3 88 3 619 3 33 3 . 193 8 164 2 321 3
1901 2 5 57 7 73 8 36 6 65 1 140 4 719 8 34 8 94 1 308 9 318 0 186 5
1961 30 6 32 6 95 9 189 44 9 167 7 690 5 184 114 5 418 3 401 8 134 8
1970 19 3 18 9 86 2 14 4 38 8 178 6 696 4
156 3 494 3 599 9 93 2
SOURCE Agricultural Enumerations and, for 1970, author's estimate
The pattern of land use today still represents a relatively unmtensive one. The output per acre from the total acreage of crops and grass has increased over the past decade from £15.3 in 1953 to £18 9 in 1963 (in current prices, which have been almost constant over this decade). This includes the output from pigs and poultry which, only to the extent that they are produced from feeding stuffs grown and fed on the national farm, really represent a part of this output from the total acreage of crops and pasture m this country
OUTPUT PER ACRE FROM THE MAIN FARM ENTERPRISES From the primary data that were used in the 1960 County Income Study, it has been possible to prepare two additional sets of estimates which are of particular importance in a discussion of land use in Ireland The first is the average output per acre from each of the mam farm enterprises, and the second the average output per acre and per holding from each of the mam farm size groups. Of course, in neither analysis is it suggested that output by itself is a sufficient criterion of the optimum use of the land in question, but it does give us a much more useful guide than has been available hitherto
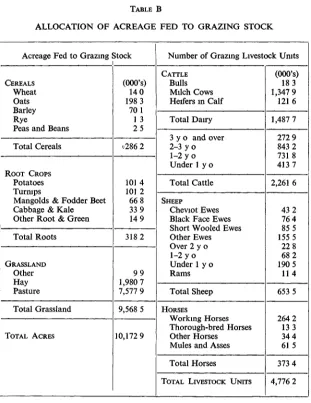
The estimate of the output per acre from the mam agricultural enter-prises involves the allocation of the total home-grown feeding stuffs against each of the livestock enterprises The mam problem—that of allocating grassland—has been met by the use of livestock unit equivalents based on the physiological body weights of the different livestock categories 5 5 E A Attwood and J F Heavey, "Determination of Grazing Livestock Units",
Details of the allocation of food to the main categories of livestock are given m the Tables in the Appendix
The mam results are set out m Table 2 and give a range of average outputs from £5,000 per acre from intensive glasshouse production to under £10 an acre from cattle and sheep.
TABLE 2
OUTPUT PER ACRE OF MAIN ENTERPRISES, IRELAND I9601
LIVESTOCK Cows Cattle Sheep Horses
Pigs and Poultry CROPS Wheat Oats Barley (Malting) Barley (Feeding) Sugar Beet Potatoes Vegetables Tree Fruit Soft Fruit] Glasshouses Other TOTAL Acreage sold off farms (000's) 3,168 7 4,817 0 1,391 9 795 2 294 3 340 8 64 5 69 2 131 8 68 3 73 1 12 6 2 8 2 7 0 3 — 11,233 2
% o f total acreage 28 2 42 9 124 7 1 2 6 3 0 0 6 0 6 1 2 0 6 0 7 0 1 — — — 100 0% Value of total output (£000's) 53,299 43,731 12,926 3,511 34,757 11,077 1,370 2,434 3,381 6,046 6,063 1,020 465 655 1,250 3,394 185,379 Value of output per acre £
16 82
9 I2 9 3 2
3 (118.1)4 33 21 35 26 89 83 81 160 240 5,000 —
16 55
1 Excludes turf and timber output
2 Including the value of production from imported feed
3 As the value of output from horses does not include the value of farmhorse work
no figure of output per acre has been included
4 Including allowance for imported feed The figure for pigs and poultry does not,
of course, represent the real value of output per acre of crops devoted to their feed as production includes that from imported feeding-stuffs which is of particular importance in these enterprises
5 Including pigs and poultry
of the total area involved—or even of the area which is potentially usable for horticulture—means that land as a factor of production is relatively less important than m the case of the other farm enterprises This, of course, is why vegetable production has been advocated as a route to economic viability for small farmers—but at the same time horticultural production is still mainly concerned with the market for fresh produce, and rapid access to this market is still of particular importance in the location and scale of horticultural production
The influence of proximity to markets is gradually becoming of smaller significance with improvements in transport and—of more importance— the growth of processing. This so far has affected only relatively small areas of the country, such as the production of early potatoes in the southern districts, onions in the Castlegregory peninsula and vegetable in west Donegal These land-use developments are giving rise to additional needs for technical and economic research in order that the full potential can be exploited
The 800,000 acres of cash crops (other than horticultural crops and timber) produced, on average, slightly over £40 per acre The location of the cash crop enterprises is not, in general, so dependent on the local opportunities or the position of the market, and the comparative advan-tages m costs of production of one region compared with another become of greater importance The amount of land involved is primarily dependent upon the size of the home market for the crops involved. Only a small proportion of cash crops is exported m either raw or processed form The more important determinant is that of the policy towards imported temperate crops. The official policy of encouraging home production of the major crops has led to a very considerable expansion of cash cropping in recent decades but when we gam access to full membership of the EEC, further expansion is likely to depend upon the relative efficiency of pro-duction compared with other European countries 6
The principal use of land m Ireland—for livestock production pre-dominantly off grass—involved 10 2 million acres of grass and cropland plus the estimated 3 million acres of rough grazing. Leaving aside the contribution from the rough grazing acreage, the average output per acre was just over £11.2 (excluding the output from pigs and poultry). This very extensive utilisation of the larger part of the total land resources necessarily is due to a whole range of problems—agricultural prices, marketing, education, capital—but of course the pattern of land use is one facet of the economic situation as a whole. The average output of under £10 per acre from cattle and sheep, and of £17 an acre from cows, in relation to the very large proportion of the total agricultural area occupied by these three enterprises, has been one of the major economic problems of the agricultural industry. Whatever the causes it remains true that the output of £10 an acre (this was at 1960 prices, but it would be little over £12 at 1964 prices) is most inadequate
6 This is discussed in a paper read to the Society on 14th December, 1962—E A
The fourth major use of land is forestry Unfortunately the output from land under tress is less well documented than that in crop and livestock production Timber sales m recent years have been around £500,000, 1 e between £1 and £2 per acre, but sales are only a fraction of the "output" of timber (I e increments in net value) Estimates of the true level of productivity of land under timber have not been published and it is, therefore, not possible to compare the output from land in this use with that in alternative enterprises
In examining the appropriateness of particular uses of land, this factor of output per acre is only one-half of the data needed for a comprehensive evaluation The compilation of data on the inputs associated with different uses of land m agricultural production is only partly completed Part of the research programme of An Foras Taluntais is directed towards this end, and it is hoped to have this reasonably complete withm the near future There are very considerable problems involved in estimating inputs to particular uses of land, and the procedure is one which is laborious and time consuming
This will then give us the average products and inputs per acre under different farm enterprises, but there will remain the complications arising from the wide variation of efficiency of production m each of these activities In a paper read to the Society ten years ago, it was shown that "we are entitled to conclude that even if the attributes of ability, energy and capital were fixed, we would also find considerable variability which can only be due to individual idiosyncrasy . . . There seems to be very little recognition in such discussions (on Irish agricultural problems) of the vast range in farming skills throughout the country" 7 As we know that in fact the attributes of ability, energy and capital themselves vary very widely within the farming population8 (as they do in every major sector of the community) it is clear that the use of average productivities and inputs per acre of each enterprise must be modified by the inherent variability within each of them This problem of variation within any type of land use has been the source of widespread disputes about the optimum use of land, but it must remain as an essential part of any examination of the use of particular areas of land The rise in farm output over the current decade and the changes m the farm labour force might lead to some reduction in this variability but it is unlikely to be on a sufficient scale to bring about a much more uniform level of farm efficiency
OUTPUT PER ACRE BY SIZE OF HOLDING
One widely-discussed influence on the level of output per acre is the distribution of holdings by size Data on the output and costs per adjusted acre of different sized farms were published m the Final Report of the
7 R C Geary, "Variability in Agricultural Statistics on Small and Medium Farms",
Journal of the Statistical and Social Inquiry Society of Ireland, Vol XIX, Part 1, 1956.
8 Rasmussen and Sandilands, Production Function Analysis of British and Irish Farm
National Farm Survey 1955/56-1957/58, but these figures were not precisely representative of the average farm in each size group 9
In order to get the results for the "average" holding in each size group, the data for 1960 were analysed on a farm size basis The results are set out in Table 3
TABLE 3A
AGRICULTURAL OUTPUT PER SIZE OF FARM, 1960
Farm Size (acres) i-5 5-15 15-30 30-50 50-100 100-150 150-200 200-300 Over 300 Not on Farms TOTAL
Livestock & Livestock Products* £'000 3,287 3 6,314 1 18,805 9 26,544 4 40,700 1 20,755 3 11,275 8 10,195 9 11,219 0 927 2 150,025 0 %of Total 2 2 4 2 12 5 17 7 27 1 138 7 5 6 8 7 5 0 6 100 0 Crops £'000 1,735 2 2,148 6 5,281 4 6,948 8 10,778 2 6,157 7 3,595 7 3,121 6 3,231 3 28 5 43,077 0
% o f Total 4 0 5 0 12 3 16 1 25 0 14 3 8 3 7 2 7 5 0 2 100 0 Total Agricultural Output £'000 5,022 5 8,462 6 24,087 3 33,493 2 51,478 3 26,913 0 14,871 5 13,317 5 14,450 3 1,055 7 193,102 0 %of | Total 2 6 4 4 12 5 17 3 26 7 13 9 7 7 6 9 7 5 0 5 100 0
*Includmg the value of changes in livestock numbers TABLE 3B
DISTRIBUTION OF HOLDINGS, CROPS AND PASTURE, LABOUR AND OUTPUT, BY SIZE OF HOLDING 1960
Size —" Group (acres) i - 5 5—15 15—30 30—50 50—100 100—150 150—200 200—300 Over 300
% of total holdings 25.9 13 2 20 4 17 2 150 4 5 1 8 1 2 0 8
% of total crops and pasture acreage 1 1 3 8 12 9 18 3 27 6 14 2 7 8 6.9 7 0
% of total output 2 6 4 4 12 5 17.3 26 7 13 9 7 7 6 9 7 5
% of total male labour force 3 1 8 7 20 3 21 8 24 4 9 8 4 6 3 6 3 7
9 This problem is discussed in detail in the Final Report of the National Farm Survey
The farms of under 50 acres contributed 36 8 per cent to the total agricultural output, those of 50-100 acres 26 7 per cent and those over 100 acres 36 0 per cent (there was also a very small amount of output recorded as "not on the farm") These figures include a considerable degree of variation according to the product in question In general, the smaller and medium-sized farms of between 15 and 100 acres produced a higher proportion of the livestock and livestock products, and a small output of crops, compared with their contribution to the total agricultural output The position was, of course, reversed m the larger farms, although the contribution of these of over 300 acres to the crop, livestock and, therefore, total output was identical The holdings of under 15 acres produced a relatively higher proportion of crops—this being due to the production of potatoes on these holdings, primarily for home consumption On the larger farms, potatoes were less important and gram crops occupied a relatively much larger part of the total cropping pattern, although sugar beet was of greater relative importance on the medium and larger sized farms than it was on the small ones
In the case of livestock, the pattern followed the expected one, with relatively small differences from product to product There are obvious reasons why the importance of different enterprises will very according to the size of farm, but this has clearly not led to the pattern of resource use on different sized holdings that would give the best return for the different combinations of inputs as farm size varies 10
This data on the total output of the different sized groups of farms can be compared with the acreage and the number of holdings m each group The results of this, given m Table 4 below, show a remarkably similar output per acre for farms of 15 acres and over, and although there appears to be a lower level of output on farms of 30-50 acres than in any other size group, it is doubtful whether the differences are sufficiently large to justify any differentiation between the output per acre for this size group, and those in the next largest or smallest category If instead of taking crops and pasture, the total acreage in each size group (I e including rough grazing and other land) had been taken as the denominator there would have been a steady—but still only small—fall in the output per acre as the size of farm increases It is, however, of more importance to focus attention on the surprisingly narrow range of output per acre—as measured either by acres of crops and grass, or by the total acreage—than to be concerned with whether or not the very slight trend that exists slopes m one direction or the other
10 This is very clearly brought out in the analysis of least cost combinations of Irish
TABLE 4
OUTPUT PER ACRE (£) CROPS AND PASTURE BY SIZE OF HOLDING 1960 Size of holding i-1 1—5 5—10 10—15 15—30 30—50 50—100 100—150 150—200 200—300 Above 300 TOTAL Ireland 54 2 33 0 21 8 18 6 16 6 16 3 16 6 169 169 17 0 18 3 17 2 Leinster 56 6 32 6 21 5 189 16 8 164 167 17 2 17 6 17 5 19 2 17 8 Munster 52 3 34 6 23 3 22 2 20 6 19 2 18 3 17 5 170 17 0 184 18 7 Connacht 48 2 30 9 210 168 14 7 13 8 133 13 8 132 13 6 117 14 3 Ulster 59 6 32 8 219 18 4 161 150 14 6 148 150 166 15 8 159 Output per acre (£) Total Area 1960
i-1 1—5 5—10 10—15 15—30 30—50 50—100 100—150 150—200 200—300 Above 300 TOTAL 51 3 29 2 18 8 15 9 14 2 13 6 13 5 13 4 13 2 12 7 95 11 3 53 1 30 2 20 0 17 4 15 5 150 14 9 15 1 15 3 15 4 14 5 13 9 50 7 32 4 21 2 19 5 17 7 16 1 14 7 13 6 12 8 11 9 86 12 7 44 1 27 3 172 13 9 12 3 112 10 2 98 91 76 32 79 512 24 3 17 6 15 1 130 117 10 4 9 3 79 75 26 85
congestion amongst the population In the western counties of Ireland, the multiplicity of small holdings at a long distance from the main markets has led to a pattern of land use which involves a very considerable degree of self-sufficiency of the individual farm households This means that the production of crops such as potatoes, and the cutting of turf for heating and cooking, still plays an important part m the economy of the region
The degree of self-sufficiency in the agricultural sector of individual counties can be derived from the data given m the County Incomes paper The results of this showed a very wide range from county to county about the national average of 25 per cent of net family farm income from farm produce consumed in the home In Mayo and Donegal, for example, the consumption of farm produce m the farmhouse accounted for 45 per cent of family income11—and it must be remembered that these two counties account for more than one-seventh of the total land area of the State Any proposals for changing the pattern of land use in the western counties must take account of the existing dependency on the farm for the immediate day-to-day requirements of the home
The national policy of relieving congestion through the resettlement of families on holdings created by the subdivision of the larger farms in the more prosperous eastern counties has tended to alter—though only very slowly—the pattern of land use m the areas concerned The smaller farms tend to produce milk in place of dry-stock, and to attain a greater measure of self-sufficiency through potatoes and vegetable crops in place of gram for sale
At the same time, the inevitably slow rate at which this land settlement policy proceeds has meant that its effects on land utilisation are not discernible in the national statistics—at least over the short period. The policy of voluntary migration and rearrangement of holdings involves a necessarily lengthy process and consequently only a relatively small number of farms have been involved Over recent years the number of migrations have been, on average, about 100 per annum and the number of rearrangements around 500
If the relative productivity of land on farms of different sizes remains unchanged, the changes in the pattern of holdings which are currently taking place will have very little effect on the level of total farm output Thus there is little evidence for contention that the current reduction in the number of small farms will adversely affect the level of agricultural output, and on this score such a trend will not have serious repercussions These changes in the number of holdings in each size group have been par-ticularly marked over recent years—the 20 per cent fall in the number of holdings m the 5-15 acre group during 1955-60 was much larger than during the previous intercensal period 1949-55. In the 15-30 acre group the rate of fall was only half that of the smaller size holdings, and m the next size group (30-50 acres) the fall was only marginal Of the farms over 50 acres only the number of these over 200 acres fell after 1955—due primarily to the official policy of dividing large estates
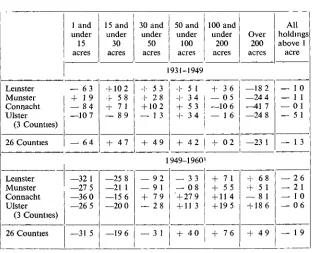
Changes in the distribution of land between different size groups can be seen very clearly if the figures of the changes during 1931-4912 are brought up to 1960 In the eighteen years from 1931 to 1949 the change in the area under crops and pasture on holdings under 15 acres fell by 6 4 per cent, and by 23 per cent on holdings of over 200 acres—and increased in all the size groups in between In the subsequent eleven years from 1949 to 1960 the crops and pasture acreage fell m all the farm size groups of under 50 acres except in Connacht, and increased in all size groups over 100 acres (again with the exception of Connacht) It is rather surprising to find that in Munster and Lemster there was actually a fall in area of crops and pasture in the 50-100 acre group, compared with a very considerable increase in Connacht, and a somewhat smaller one in Ulster
TABLE 5
PERCENTAGE CHANGE IN AREA UNDER CROPS AND PASTURE
Leinster Munster Connacht Ulster (3 Counties) 26 Counties Leinster Munster Connacht Ulster (3 Counties) 26 Counties 1 and under 15 acres 15 and under 30 acres — 63 + 19 — 84 —10 7 — 64 —32 1 —27 5 —36 0 —26 5 —31 5 + 102 + 58 + 71 — 89 + 47 —25 8 —21 1 —15 6 —20 0 —19 6 30 and under 50 acres 50 and under 100 acres 100 and under 200 acres Over 200 acres All holdings above 1 acre 1931-1949 + 53 + 28 + 102 — 1 3
+ 49
+ 5 1 + 34 + 53 + 34 + 42 1949-1960 — 92 — 91 + 79 — 28
— 3 1
— 3 3 — 0 8 '+27 9 + 11 3
+ 40
+ 36
— 05 —10 6 — 1 6
+ 02
i
+ 71 + 55 + 11 4 + 19 5 + 76 —18 2 —24 4 —417 —24 8 —23 1 + 68 + 51 — 8 1 + 186 + 49
— 10 — 1 1 — 0 1 — 51
— 1 3
— 26 — 2 1 — 10 — 0 6
— 1 9
1 The relative changes are overstated here because of the revised method of dealing
with "divided holdings" (I e those in more than one D E D ) introduced in 1960 INPUT REQUIREMENTS IN DIFFERENT LAND USE SITUATIONS
Knowledge of the levels of associated inputs with land in various enter-prises is still incomplete The data included in the Final Report of the 12 Published in Table 29 in the Report of the Commission on Emigration and Other
National Farm Survey, however, throw a valuable light on the con-sequences of different resource combinations on the gross and net product per acre under different farming systems The pattern of resource com-bination in the farms on the survey was a fairly uniform one, as farm size increases the amount of labour and inventory capital increases but at a diminishing rate (1 e inventory capital per acre tends to fall and acres per labour unit tend to increase as farm size increases, but the rate of change gets smaller between each successive size group) There was considerable uniformity in these resource combinations for any given farming* system, although the subsistence group had lower capital inputs and, to a lesser extent, the cattle farms had lower labour inputs per acre than the other three major systems
The more interesting variations were, however, those withm each size/ system group In each size group of the four systems for which data were available, the upper income group had the largest amount of labour per farm, and the lowest income group the least labour This was by no means simply due to the contribution of the additional labour, for there were substantial differences in the output per labour unit between the income groups in each of the size/system groups The more intensive farming policies of the upper income groups were a clear route to a larger and more prosperous farming community, the upper income group m the 15-30 acre farms had 1 man per every 12 to 14 acres,13 on the lower income farms of the same size the ratio was 1 man to 18-27 acres In general, as acreage increases the divergences in the land/labour ratio between the lower and higher income groups tended to narrow, but even in the largest group the average amount of labour per unit of land was from 25-50 per cent higher in the upper income group than in the lower income farms
All of this points very strongly to the need to promote a more intensive use of land, through both the educational and advisory services for farmers and through a greater measure of flexibility in the distribution of land If the available land is to be used for the maximum benefit of the national economy, then more steps are needed to see that those who will develop its potential are put in a position to do so There are considerable hurdles to be overcome, but the direction of official policy needs to be more closely orientated towards bringing together those with the talent and energy to use land to its full potential, and those lands which need devel-oping from the state of low output (which can be seen in any journey across the country) The time is coming in a highly competitive agricultural world where the potential productivity of land is being very rapidly ex-panded by modern technology, when we must question more closely the right to misuse or leave land underdeveloped This does not mean that there should be any arbitrary confiscation (as was, for example, attempted in Britain in the 1947 Agricultural Act, but subsequently found unwork-able), but that ordinary economic pressures towards expanding land use should be encouraged in order that the abilities and opportunities of the younger, more able farmers should be harnessed to create a more intensive
use of the land available Where such a policy would involve social diffi-culties, then measures to relieve this will have to be undertaken This is however* a far more valuable policy than that of reducing the opportunities for greater movement within agriculture
This does not mean, however, that the very large amount of under-employment on the smaller farms, particularly those in Connacht and Ulster, could be readily overcome simply by a policy of intensification The extent of this underemployment has been given in the Report of the Interdepartmental Committee on the Problems of the Small Western Farms,14 and this is such as to make a policy of developing alternative employment opportunities together with more intensive farming system, the only one that will stabilise the population of the western counties.
THE DEVELOPMENT OF LAND USE CRITERIA
The problems involved in any comprehensive appraisal of existing or of optimum land use patterns involve extremely complex issues concerning the methodology to be followed, the precise data which are required, how these data are to be assembled, and the means by which non-economic factors should be integrated into the analysis The methodology involved has recently been the subject of a debate on the national criteria to be used when there are relatively long time periods involved m the decisions In decisions on land use there are long-term implications in many of the alternatives This is most obvious in the case of forestry, but it is also inherent in many impro\ement schemes such as arterial and other drainage programmes, and in farm plans involving other fixed capital investments
Difficulties arise from four different sources The first is that prices received for the different farm products are affected in different degrees by State assistance If land is to be used for the maximum benefit of the national economy, the effects of this assistance must be taken into account
In the second place the pattern of economic growth which is appropriate to the requirements of the community at any one point m time—or at any one level of prosperity—is not likely to meet the needs of society as the level of prosperity improves The changes m the social utility consumption function over time (1 e the way in which society values—m economic terms—the various ways in which it can consume its income) are very difficult to evaluate in quantitative terms, and much more research is required into appropriate ways of evaluating these changes. In all long-term decisions concerning land use (or the use of any other resource) these changes must either explicitly or implicitly be taken into account This has become of much greater importance with the acceptance, and likely fulfilment, of the objective of a 50 per cent growth in Gross National Product over the current decade At this rate of growth the country is likely to be well over three times as prosperous m twenty-five years time as it was at the beginning of the Second Economic Programme, and the way in which the community will want to spend that income is likely to be very different from the pattern of expenditure today. This is likely to
affect, for example, the non-agricultural uses of land in the western counties, which are likely to grow m value at a faster rate than has been the case up to the present. As more and more people have the wealth to maintain recreational facilities in this region, its potential for these pur-poses will become of increasing value
This brings us to the third aspect which must be considered The opti-mum situation in the future may be impossible to achieve if previous decisions do not provide for the possibilities which may arise as the economy progresses For example a policy of extensive land use today in a particular region may make it virtually impossible to develop profitable intensive systems at a later date because of the irreversibihty of population movements This may often mean achieving a balance between policies which promote rapid economic progress in the short term, and those which achieve the optimum pattern of social and geographic developments in the longer period Given the fact that we are now able to postulate with reasonable assuredness the future growth of the economy, there is a major need to examine its implications for the use of the basic national resources—of which land is among the most important There are many difficulties in projecting the optimum pattern of resource use m, say, ten years time, but this does not mean that it should not be undertaken, for this sort of objection has been the source of much unhelpful criticism of economic growth m Ireland The fact that there can be no uniquely correct projection should not be regarded as a deterrent, a constructive policy that has regard to the future pattern of development is likely to be far more successful than one that relies on the pull of short-term economic forces to achieve the optimum pattern of land use
This will involve the fourth problem, which is that of evaluating the non-economic gams—in terms of recreational and amenity use—of devoting land to alternative uses A scientific land use policy which takes account of all the criteria of the physical and social sciences will have to be amenable to mathematical treatment and to processing by modern com-puter techniques This will require considerable research into the appro-priate methods of processing the data, and of determining precise values for the criteria involved
One of the major requirements in formulating national or regional land use plans is a full evaluation of the physical resources in terms of soils and their behaviour under different cultural, manunal and management practices This need is being met by the research work withm An Foras Taluntais The size of this task should not be underestimated, for it is essentially long-term research which will play a basic role m land use planning
is a development of cost/benefit analysis, now widely used m deciding national long-term development projects, and this form of analysis can readily be adopted for deciding an optimum land use policy At the same time, the validity of such an analysis is dependent on the accuracy of the basic data used, modern computer techniques can handle complex data but cannot make up for the gaps in our knowledge of alternative resource uses in different combinations The development of this analysis over the next few years will make it possible to create a more integrated programme for the agricultural sector than has been possible so far, and to relate the developments in the use of land for farm production to the uses of land for other purposes
This is now also taking on a much more immediate importance with the coming into operation recently of the Local Government (Planning and Development) Act of 1963 Under Section 19 of this Act, the local planning authorities are required to prepare de\ elopment plans—and subsequently to effect their implementation These plans must show in urban areas the land to be used for residential, commercial and agricultural purposes In non-urban areas they must give plans for preserving, improving and extending amenities, and in addition, may show details of land to be used solely or primarily for agricultural or other purposes
There is a pressing need for a rational and uniform application of the principles put forward in this Act The rapid extension of urban settlement on to some of the most valuable agricultural land in recent years is likely to continue, although the work on the Dublin Regional Plan is bringing this problem under direct scrutiny The problem is by no means limited to Dublin, and although Ireland has the good fortune to have no great overspill problem, there is no justification for not producing a more orderly pattern of development The improvement of recreational facilities for the growing urban communities, the greater mobility of the city dwellers with the rapid growth of car ownership, and the needs of the tourist industry are all strong reasons for a positive land use policy in the country as a whole All of these problems can be tackled under the new planning legislation which has very strong powers of enforcement but there are very considerable difficulties of achieving a uniform and positive plan based on adequate criteria of optimum use and given sufficient support to see that it is really effective
CONCLUSION
The most immediate task in the development of a land use policy is a much more detailed knowledge of the current economic costs and returns from land in its various uses, and the consequences of changing land use This will necessarily involve very considerable problems of assembling and analysing the data required for a comprehensive assessment of the alternatives This is already being done, but there remains a great deal to be tackled before any realistic appraisal can be made
two activities directly affecting the use of land—afforestation and re-arrangement—have targets of 25,000 acres a >ear It may be that this is, in fact, just the right level for these programmes, but there has been no comprehensive account published of the factors determining the optimum level for these two important land using activities It might be argued that, in the face of the many unknowns as to the future, such an examination is not feasible There are two answers to this In the first place the use of cost/benefit analysis has been applied to problems at least as difficult as these, and these are just the sort of problems to which this approach is appropriate In the second place, there have to be some criteria by which the decision on planting trees or shifting people and rearranging holdings is taken A careful appraisal of these criteria will not only help in the making of more rationally-based decisions, but will give a greater precision to the economic factors which are involved in these policies
The fact that millions of pounds are spent annually on these changes of land use gives a considerable measure of urgency to the problem It is not suggested the cost/benefit analysis can be produced without very detailed research The very fact that a considerable volume of information is required should give a measure of urgency to the task This is in no way meant as a criticism of the work that has been done, but a plea for an economic assessment of the implications of the present situation m order that the further development can be directed m such a way as to give the maximum returns on the investment being made
TABLE A
ACREAGE UNDER CROPS AND PASTURE
Year 1847 1851 1861 1871 1881 1891 1901 1911 1921 1931 1941 1951 1961 1964 1970
W h e a t
671,448 428,705 327,910 184,017 115,342 59,519 31,762 36,232 39 510 20,848 463,206 281,637 344,800 215,700 216,000 Oats 1,544,148 1,584,943 1,419,582 1,132,602 946,683 811,520 722,812 701,518 820 319 622,779 782,201 619,940 367,800 290,900 212,000 Barley 297,676 312,280 193,473 219,049 206,040 175,701 158,418 156,029 168,664 115,735 163,342 167,174 361,700 454,300 531,000 Total corn 2,534,989 2,376,546 1,956,437 1,551,062 1,261,834 1,060,751 923,897 902,707 1,034,705 763,284 1,413,196 1,073,614 1,081,000 969,500 965,000 219,555 666,373 862,103 795,551 635,410 548,900 458,500 424,502 409,303 346,073 428,146 321,448 213,100 183,300 161,000 Turnips and 304,305 330,606 295,234 294,019 270,848 278,375 290,045 286,569 294,603 265,791 252,960 205,212 158,700 140,100 122,000 Sugar — 5,012 76,390 59,885 78,800 80,800 96,000 Total root and 569,634 1,072,321 1,224,794 1,167,877 966,307 898,684 814,620 775,424 756,070 653,729 798,571 619,786 505,700 464,800 435,000 Total corn, root 3,128,555 3,509,229 3,227,032 2,772,430 2,287,752 1,975,145 1,750,803 1,697,338 1,807,843 1,425,021 2,236,413 1,717,283 1,598,700 1,434,300 1,400,000 Hay 959,312 1,060,210 1,281,099 1,499,057 1,646,084 1,661,858 1,757,884 2,045,579 1,983,241 2,313,109 2,004,214 1,936,263 1,889,200 1,925,700 2,000,000 Pasture 7,434,511 8,220,085 8,673,997 8,652,098 8,814,787 9,011,168 8,447,391 7,988,824 7,336,107 7,934,698 7,779,900 7,800,000 Total crops and pasture 12,003,950 12,728,216 12,945,484 12,585,934 12,451,790 12,519,855 12,190,308 11,727,034 11,576,734 11,588,244 11,267,800 11,200,000 Other land 4,973,187 4,248,891 4,007,824 4,396,584 4,535,319 4,467,254 4,813,983 5,297,447 5,447,751 5,435,848 5,755,900 5,800,000 Total area 16,977,137 16,977,107 16,953,308 16,982,518 16,987,109 16,987,109 17,004,291 17,019,155 17,024,491 17,024,485 17,024,092 17,023,700 17,023,000
TABLE B
ALLOCATION OF ACREAGE FED TO GRAZING STOCK
Acreage Fed to Grazing Stock
i
CEREALS Wheat Oats Barley Rye
Peas and Beans Total Cereals
ROOT CROPS Potatoes Turnips
Mangolds & Fodder Beet Cabbage & Kale Other Root & Green Total Roots
GRASSLAND Other Hay Pasture Total Grassland
TOTAL ACRES
(OOO's) 14 0 198 3 70 1 1 3 25 *286 2
1014 1012 66 8 33 9 14 9 318 2
99 1,980 7 7,577 9 9,568 5
10,172 9
Number of Grazing Livestock Units CATTLE
Bulls Milch Cows Heifers in Calf Total Dairy 3 y o and over 2-3 y o 1 2 y o Under 1 y o Total Cattle SHEEP
Cheviot Ewes Black Face Ewes Short Wooled Ewes Other Ewes Over 2 y o 1-2 y o Under 1 y o Rams Total Sheep HORSES
Working Horses Thorough-bred Horses Other Horses
Mules and Asses Total Horses
TOTAL LIVESTOCK UNITS
(OOO's) 18 3 1,347 9 1216 1,487 7 272 9 843 2 731 8 413 7 2,261 6
43 2 76 4 85 5 155 5 22 8 68 2 190 5 114 653 5
PRODUCTION AND ALLOCATION OF MAIN CROPS 1960
Wheat Oats Barley (M) Barley (F) Potatoes Turnips
Mangels (Fodder Beet included)
Sugar Beet
Cabbage
Acreage (000's)
366.3 425 8 1184 210 0 233 8 102 9
66 8 67 8
33 9
Production Imports Exports
Total Available
Household Consumption
Fed to Livestock
Grazing
Stock Pigs Poultry (Tons 000's)
462
419
149
286
1,800 2,158
1,254
120t
581
1331
—
—
121
—
—
—
26
—
2
—
55
261
65
—
—
27
—
593
419
95
271
1,755
2,158
1,254
119
581
388
11
492
458
35
—.
119
103
167
382
298
1,067
2,123
1,254
/117* \ 72 478
61
210
141
899
1,790
1,254
fill* \ 72
478
90
145
129
139
276
—
—
—
16
36
28
29
57
—
—
—
All figures, except for last 3 columns, (which are author's estimates) are obtained from Statistical Abstract except for * Trade Statistics,
2 Derived from Census of Industrial Production
fAs sugar *Pressed and Dried Pulp
ON
TABLE D
PERCENTAGE1 OF PURCHASED AND HOME-GROWN FEEDTNGSTUFFS
FED TO THE MATN CATEGORIES OF LIVESTOCK
Feedingstuffs Purchased Concentrates Purchased Bulky Foods Home-Grown Cereals
Home-Grown Roots (inci Potatoes) Hay, Silage and Pasture
Total Purchased Feedingstuffs Total Home-Grown Feedingstuffs
(excl Hay, Silage and Pasture)
Pigs
/o
59 0 60 35 6 13 0
52 7 27 0
Poultry °/ /o
92
95 27
82 69
Grazing Stock
/o
31 8 94 0 54 9 84 3 100 0 39 1 66 1
1 Based on acreage equivalent
SOURCE Attwood, E A , and O'Carroll, Barbara, Structure of the Feedingstuffs Industry m Ireland, An Foras Taluntais Economic Research Series No 5, Dublin 1962
DISCUSSION
Mr H J Gray, seconding the vote of thanks, said that Mr Attwood
had not alone contributed a most interesting paper but had also made a most useful contribution towards progress m this difficult field of com-parative evaluation of different land uses Mr Attwood's conclusions were set withm the framework of the problems of implementing the Regional Planning Act, here he felt Mr Attwood was expecting too much since the functions of planning authorities under the Act would be related to the delineation of areas for building and industrial development as against scenic preservation or productive use in agriculture and forestry, it seemed unlikely that such legislation would ever comprehend the deter-mination of different forms of productive use
Mr Attwood, while recognising broader issues, had made specific suggestions in relation to land rearrangement and afforestation It was important to remember that the objectives of land rearrangement were not solely economic but indeed largely social and the application of cost-benefit principles would be very difficult On present knowledge, forest policy could not be based on specific determination of the area of land which could be most economically3 devoted to forest use Mr Attwood foresaw increasing difficulty in securing land for forestry purposes but his comparison with Britain was scarcely valid, having regard to population densities, etc In many European countries the trend was for more intensive agricultural production to be offset by a fall m the area devoted to agri-culture, the land thus released being transferred to forestry
He felt there would be great difficulty, however, in development of a system of comparative evaluation which would not merely be sound but would be accepted as such by all the interests concerned and would be reflected in actual changes in the pattern of land use Mr Attwood rightly stressed the inadequacy of gross output figures Input-benefit assessment as favoured by Mr Attwood was accepted in forestry but might be difficult to attain in agriculture In an assessment of the rival claims of forestry and agriculture, it would be necessary to allow for long-term price vagaries on the forestry side and to resolve the problems posed by actual versus optimum uses in agriculture It might well be that progress m the near future would come rather from the soil survey work of the Agricultural Institute than from economic comparisons
Forestry's contribution towards stabilising population in areas of reducing farm employment should not be overlooked.
Dr R Johnston suggested that there was a case for considering
affores-tation and arterial drainage as two elements m an overall "allocation of resources" study of land utilisation In this study it would be necessary to consider the interaction between these two factors in evaluating the expected return from either He questioned whether arterial drainage on its own was sound policy, lowering an average level in order to reduce the peak might lead to trouble in a dry period Reducing variability of level was better, he had heard of evidence that afforestation of high-rainfall areas of the catchment had this effect He asked were there, any co-ordinated investigations into the question going on in this country.
On the question of allocation of resources to backward areas he sug-gested that an opportunity existed for examining the response of the human resource to changed policies The recent change m "dole" regulations had had the effect of removing the "dole barrier" through which small farmers who wished to improve had to break The threshold for the return of the small farmer with savings to invest was now lower than before, he now had a reasonable prospect of earning a tolerable income m his first year of return, whereas under the old regulations his first increment in income would be negatived by the application of the "means test" There was scope for study of selected small-farm regions for a couple of years on either side of the "break-point" represented by the change in "dole" policy
Dr Pierce Ryan The great need for more factual information in
estab-lishing working criteria and the necessary methodology for economic land use planning has been highlighted. Knowledge of actual land resources is far from adequate also, land-use appraisal and physical planning may have little value unless based on fundamental physical data and no amount of "computerisation" can compensate for a lack of factual information Mindful of this, the research programme of An Foras Taluntais, dealing with resource appraisal, considers both physical and economic elements together, through specialist teams working in particular regions, mainly responsible on the physical side is the National Soil Survey
segrega-tion and mapping of different soils and the characterisasegrega-tion of their environment but also an evaluation of their use possibilities, major limitations and cultural requirements The relative suitability of the soils for various agricultural and other enterprises are considered and in col-laboration with other specialists, the relative productivity of the soils for various crop enterprises, including grass, and the physical inputs necessary to meet this potential are being determined This is a long-term research programme requiring the best of scientific endeavour using modern methods, older land surveys such as the Griffith's Valuation are no sub-stitute
Only on the basis of such knowledge can shifts in land use be made with confidence and to the national good In a rapidly-changing economy the alternative uses to which soils can be devoted must be known, not only the foremost use under which a particular soil is most productive but also the alternative uses m order of merit so as to cater for changes in social and economic demands
The whole concept of land quality has changed radically in recent years but land use practise has not changed at equal pace With modern fer-tiliser technology, considerations of natural nutrient fertility in soils have become subordinate to physical problems such as poor drainage, heavy texture and poor structure which are much more difficult and costly to rectify Besides, copious farm labour supply has been replaced largely by mechanisation which drastically altered the feasible cultural and manage-ment practices on many soils By means of modern technology it has been possible to obtain higher production per acre and also to bring sizeable areas of marginal land into a higher production category These radical changes m the relative usefulness of different categories of land are bound to have a considerable influence in land use planning and particularly m the allocation of land to the various enterprises such as agriculture, forestry, urbanisation, industrialisation, transportation, etc
Dr. R. C. Geary I would like to join the other speakers m complimenting