Mathematics Theses Department of Mathematics and Statistics
5-3-2017
Differences Of Diabetes-Related Complications
And Diabetes Preventive Health Care Utilization In
Asian And White Using Multiple Years National
Health Survey Data
Yonggang Li
Follow this and additional works at:https://scholarworks.gsu.edu/math_theses
This Thesis is brought to you for free and open access by the Department of Mathematics and Statistics at ScholarWorks @ Georgia State University. It has been accepted for inclusion in Mathematics Theses by an authorized administrator of ScholarWorks @ Georgia State University. For more information, please [email protected].
Recommended Citation
Li, Yonggang, "Differences Of Diabetes-Related Complications And Diabetes Preventive Health Care Utilization In Asian And White Using Multiple Years National Health Survey Data." Thesis, Georgia State University, 2017.
PREVENTIVE HEALTH CARE UTILIZATION IN ASIAN AND WHITES USING
MULTIPLE YEARS NATIONAL HEALTH SURVEY DATA
by
YONGGANG LI
Under the Direction of Gengsheng Qin Ph.D
ABSTRACT
The main purpose of this study is to examine the differences of preventive management
utilizations and diabetes complications in Asian Americans and Non-Hispanic whites using
multiple years (2002-2013) Behavioral Risk Factor Surveillance System (BRFSS). SAS for
complex survey procedures were used to perform the data analysis. Odds ratios (OR) were
calculated to compare the prevalence of diabetes complications and preventive management rate
in Asian with white. Compared to white, the prevalence of diabetes retinopathy in Asians were
higher, while the rates of neuropathy and cardiovascular complications, pneumonia shot,
personally management as well as management diabetes with doctors were lower. The
prevalence of routine checkup in Asian was not significantly different from the prevalence in
white. More attentions should be paid on Asians for diabetes related retinopathy.
INDEX WORDS: BRFSS, Diabetes, Complications, Hypertension, Coronary heart disease,
PREVENTIVE HEALTH CARE UTILIZATION IN ASIAN AND WHITES USING
MULTIPLE YEARS NATIONAL HEALTH SURVEY DATA
by
YONGGANG LI
A Thesis Submitted in Partial Fulfillment of the Requirements for the Degree of
Master of Science
in the College of Arts and Sciences
Georgia State University
Copyright by Yonggang Li
PREVENTIVE HEALTH CARE UTILIZATION IN ASIAN AND WHITES USING
MULTIPLE YEARS NATIONAL HEALTH SURVEY DATA
by
YONGGANG LI
Committee Chair: Gengsheng Qin
Committee: Gengsheng Qin
Xin Qi
Xiaoyi Min
Electronic Version Approved:
Office of Graduate Studies
College of Arts and Sciences
Georgia State University
DEDICATION
My special thanks go to my wife, not only to thank her for her dedication, love and persistent
confidence in me but being supportive and caring my kids. She really has taken the load off my
ACKNOWLEDGEMENTS
It is my greatest pleasure to thank everyone who helped me with my research and my thesis.
Without you all, this thesis can’t be finished and presented.
In the first place, I would like to present my heartily thankful and appreciation to my
awesome supervisor, Pro. Qin. Without his supervision, advice, support and guidance, this thesis
can’t be finish today. He is always eager to find best way for me to perform my thesis research.
He showed me the centers for disease control website where I can successfully find the BRFSS
data, the world largest telephone survey data including diabetes associated risk factors,
complications and disease management. This thesis research provided me great knowledge of
analyzing large survey data. His truly scientific sense has made him as a constant oasis of ideas
and passions in science, which exceptionally inspire and enrich my growth as a student and a
researcher.
It has been an extraordinarily fortunate for studying here at Georgia State University only
because there are so many wonderful professors in Statistical department. I could never have
started any part of my thesis without their prior teachings in linear and categorical data analysis,
SAS programming, sampling technique, et al.
It is a great honor for me that Dr. Qin, Dr. Qi and Dr.Min would like to attend my defense
and be my thesis committee members. Thanks for their time and commitment and the helpful
comments to my thesis.
Finally, I would like to thank all my colleagues and friends who give me supports and help
TABLE OF CONTENTS
ACKNOWLEDGEMENTS ... V
LIST OF TABLES ... VIII
LIST OF FIGURES ... IX
1 INTRODUCTION ... 1
1.1 Background and Significance ... 1
1.1.1 Diabetes Prevalence and Complications ... 1
1.1.2 Preventive Health Care Utilizations ... 2
1.1.3 Effects of Preventive Health Care on Diabetes Care ... 3
1.2 Data Source ... 3
1.3 Purpose of Study ... 7
1.4 Specific Aims ... 8
2 METHODS AND PROCEDURES... 9
2.1 Study Population ... 9
2.2 Study Measures ... 9
2.2.1 Diabetes Status and Typology ... 9
2.2.2 Race and Ethnicity ... 9
2.2.3 Diabetes Complications... 10
2.2.4 Preventive Care ... 10
3 RESULTS ... 13
3.1 Diabetes Prevalence... 13
3.2 Demographic Characteristics ... 15
3.3 Preventive Health Care Utilizations ... 17
3.3.1 Personally Diabetes Management ... 17
3.3.2 Diabetes Management with Healthcare Providers ... 22
3.3.3 Flu Vaccination and Pneumonia Shot or Pneumococcal Vaccine ... 28
3.4 Diabetes Complications... 31
3.4.1 Diabetes Retinopathy ... 31
3.4.2 Feet Sore or Irritation ... 32
3.4.3 Neuropathy and Cardiovascular Diseases ... 33
4 DISCUSSION ... 34
5 STUDY LIMITATIONS ... 38
6 CONCLUSIONS ... 39
LIST OF TABLES
Table 1 Diabetes prevalence in Asian Americans and White from 2002-2013 ... 13
Table 2 Demographic Characters of Participants with type 2 2002-2013 ... 15
Table 3 Blood sugar self-checking in Asian and White ... 18
Table 4 Feet self-checking for sores or irritations in Asian and White ... 19
Table 5Personally diabetes management in Asian and White ... 21
Table 6 Routine checkup with healthcare provider in Asian and White ... 22
Table 7 Checking feet with doctors for sore or irritation in Asian and White ... 24
Table 8 Checking eyes with doctors in Asian and White ... 25
Table 9 Checking HbA1C with doctors at least twice a year in Asian and White ... 26
Table 10 Diabetes management with healthcare providers in Asian and White ... 27
Table 11 Flu vaccination & pneumonia shot in Asian and White from 2002-2013 ... 29
Table 12 Diabetes retinopathy in Asian and White from 2002-2013 ... 31
Table 13 Feet sore or irritation in Asian and White from 2002-2013 ... 32
LIST OF FIGURES
Figure 1 Bar chart for diabetes prevalence of Asian and White 2002-2013 ... 14
Figure 2 Adjusted Odds ratio of diabetes prevalence in Asian and White 2002-2013 ... 14
Figure 3 Odds ratio of sugar self-checking in Asian and White 2002-2013 ... 18
Figure 4 Odds ratio of feet self-checking for sore or irritation in Asian and White 2002-2013 .. 20
Figure 5 Odds ratio of personally management in Asian and White 2002-2013 ... 21
Figure 6 Odds ratio of routine checkup in Asian and White 2002-2013 ... 23
Figure 7 Odds ratio of checking feet for sore or irritation with doctor in Asian and White 2002-2013... 24
Figure 8 Odds ratio of checking eyes with doctors in Asian and White 2002-2013 ... 25
Figure 9 Odds ratio of checking HbA1C at least twice a year in Asian and White 2002-2013 ... 27
Figure 10 Odds ratio diabetes management with healthcare provider in Asian and White 2002-2013... 28
Figure 11 Odds ratio of flu shot in Asian and White 2002-2013... 30
Figure 12 Odds ratio of pneumonia shot in Asian and White 2002-2013 ... 30
Figure 13 Odds ratio of diabetes retinopathy in Asian and White 2002-2013 ... 32
Figure 14 Odds ratio of feet sore in Asian and White 2002-2013 ... 33
1 INTRODUCTION
1.1 Background and Significance
1.1.1 Diabetes Prevalence and Complications
Asian American populations have grown very fast in the United States which has grown
from 11.9 million (4.2%) in 2000 to 19.4 million (6%) in 2013. According to Census Bureau’s
estimation, Asian Americans will increase to more than 40.6 million (9.2%) by 2050.1, 2 The
health related information in this population turns to be important because of the rapid
population increase. Studies using Asian population have shown that the prevalence of diabetes
have increased dramatically in most of the Asian countries.3-10 Also study using National Health
Interview Survey (NHIS) data also showed Asian Americans have higher prevalence of type 2
diabetes.11 From the National Diabetes Statistics Report data released on June 2014, the diabetes
prevalence in Asian American is 1.4 percent higher than Non-Hispanic White12. Based on 2014
data from the National Diabetes Statistics Report diabetes mellitus was estimated to be the
seventh leading cause of death in the United States.12 Diabetes is the leading cause of
non-traumatic lower limb amputation, blindness and kidney failure.13 Racial disparities of diabetes
complication development between Asian Americans and Non-Hispanic whites were detected in
several studies. All these results showed that Asian Americans were significantly more likely to
develop end-stage renal disease and were less likely to develop myocardial diseases14, 15. Even
though study using 2001 BRFSS data showed that among Americans with diabetes, Asian
Americans have similar prevalence of hypertension, hypercholesterolemia, retinopathy and foot
ulceration with white14, research using 2006-2008 BRFSS data found out that Asian
Americans/Pacific Islanders (AAPIs) had significantly higher prevalence of diabetic retinopathy
diabetes complication between Asian Americans and Non-Hispanic whites. This may induce us
to perform the diabetes complication comparison using multiple year survey data. Right now, no
study has been focused on the diabetes related complication changes over time for Asian
Americans as well as Non-Hispanic whites. Finding the trend of diabetic complications in these
two groups as well as the racial differences can provide valuable information to understand the
diabetic complication development and provide effective intervention to prevent the
complications and related co-morbidities.
1.1.2 Preventive Health Care Utilizations
Effective diabetes self-management, including self-care, keeping diabetes care
appointments and getting vaccinated against influenza and pneumonia, is very important in
reducing diabetes related morbidity and mortality. There is evidence that by lifestyle
modification, medication and self-monitoring of blood glucose, diabetes can be better
controlled17, 18. The main goal of diabetes management is glycemic control and a reduction in
diabetes related complications, morbidity and mortality. Self-management can benefit glycemic
control as well as the diabetes management. Researchers have showed that diabetes
self-management has great differences between racial and ethnic groups because of the
socioeconomic status, disease knowledge and awareness, as well as access to healthcare which
may influence the racial disparities of the diabetes outcomes.19-25 Even though, no significant
differences among whites, African Americans and Hispanic in HbA1c testing or examining feet
for sores have been detected using 2000 Medical Expenditure Panel Survey (MEPS) data26. The
recently completed research using 2009 BRFSS data27 showed that compared to Whites, the
Asian Americans were significantly less likely to check their blood sugar at least once a day,
these two groups for diabetes education, having seen professionals for diabetes within past year,
having cholesterol or HbA1C checked in past year, and having an eye or foot exam in past year.
Several trend analyses conducted using national data showed an increase rate of diabetes
prevalence over past decade11, 27. Also there was a study revealing increased rate of preventive
healthcare for diabetes both in Non-Hispanic white and Africa American17. To provide better
intervention program and better control over the diabetes, there is a need of examining the
preventive diabetes self-management changes over time as well as the racial differences.
However, there is little information about the preventive health care trend over time period in
Asian American population.
1.1.3 Effects of Preventive Health Care on Diabetes
The American Diabetes Association recommends annual measurements of HbA1c, lipids,
cholesterol and urine protein; dilated eye and foot examinations; and biannual measurement of
blood pressure28. These recommendations have been associated with the decreases of diabetes
complications rate29-33. The diabetes complications rate is higher for minorities including Asian
Americans than for whites14, 34, as well as the preventive health care are less in minority
including Asian Americans17, racial disparities in preventive health care may contribute to the
higher rate of diabetes-related complications and mortality.
1.2 Data Source
Behavioral Risk Factor Surveillance System (BRFSS) from Center for Disease Control
and Prevention (CDC) was used for this study. This survey is a state-based system that is used to
gather information through random digit dialing conducted by the health departments of all 50
Centers for Disease Control and Prevention (CDC). This survey collects preventive health
practices and chronic disease data from individuals aged 18 and older35.
The subgroups of non-Hispanic whites and Asian Americans who were surveyed between 2002
and 2013 were included in this study. Each survey respondent was weighted to account for the
number of residential telephones in the household, the number of adults in the household,
differences in probability of election, non-coverage and non-response. The each year of 12 years
data was plotted to get first visualization and was examined in tabular forms. Then the 12 year
data were combined. New variables that consider stratum, primary sampling unit and sampling
weight were created in order to accommodate different sampling designs between 2002-2010 and
2011-2013.
1.2.1 Questionnaire and Data Collection
Each year’s questionnaire has both English and Spanish version where three components
are included: the core component, optional modules and state-added questions. All state health
departments must ask the core component questions without modification. The core component
questions are standard questions associated with current health-related conditions, perceptions,
and behaviors, such as health status, health insurance, diabetes, tobacco use, disability, and
HIV/AIDS risks, as well as demographic questions. Optional modules are about specific topics
(e.g., cardiovascular disease, arthritis, women’s health). State can choose to use these optional
modules and also add its own questions. From 2002 to 2013, the core components varied in
some topics. For example, the variable of firearms was only included in 2002 and 2004 and the
hypertension and high cholesterol awareness were only included in odds year which makes our
were collected in the optional modules in year 2002 and 2004. And the routine checkup with the
healthcare provider information was not collected in 2003 and 2004 in both core and optional
modules.36
The core component questions last an average of 15 minutes, and modules and
state-added questions usually took 5-10 more minutes. Materials developed by CDC were used to train
the state interviewers or coordinators. These materials cover seven basic areas: overview of the
BRFSS, the questionnaire, sampling, role descriptions for staff, codes and dispositions
(three-digit codes indicating the outcome of each call attempts), survey follow-up, and practice
sessions. Contractors typically use experienced interviewers, but these interviewers are still
given additional training on the BRFSS questionnaire and procedures before they are approved
to work on BRFSS. Telephone interviewing was conducted during each calendar month, and
calls were made seven days per week, during both daytime and evening hours. Standard
procedures were followed for rotation of calls over days of the week and time of day.36
1.2.2 Sources of Error
The BRFSS is a complex telephone survey which would include statistical error in the data
collection. Overall, four types of errors included in it: no-coverage error, sampling error,
non-response error and measurement error.
Non-coverage Error: For year 2002-2010, because BRFSS didn’t include the person who
only has cellphone, the households without telephones make this a larger source of non-coverage
error. Even though census data showed approximately 94% of U.S. households have telephones,
minorities, and those in lower socioeconomic groups typically have lower telephone coverage.
Persons without telephones tend to have lower household incomes, and low income is associated
with certain health risk behaviors. Another source of non-coverage error came from the
exclusion of person who lived in nonresidential settings, such as hospitals, nursing homes,
prisons, military bases, and college dormitories. Compared with the size of the whole adult
population of the state, the number of persons within the above-mentioned groups is generally
small. After year 2011, CDC corrected this non-coverage error by including the cell phone into
the survey. For the first half of 2011, the percentage of cell phone-only households was 31.6
percent38. This is an increase of 1.9 percent over the preceding 6-month period. In households
where both landline and wireless phone service is available, there is a trend toward increased use
of wireless communication. In 2011, BRFSS respondents who received 100 percent of their calls
on cell phones were eligible for participation in the cell phone survey.
Sampling Error: Like all the other survey data, all estimates in BRFSS are based on only a
sample of the population rather than on the entire population. This may lead to sampling error.
Strictly adhering to the BRFSS calling rules and randomly selecting a household member can
avoid some sampling error36.
Non-response Error: All surveillance data would be hard to avoid this error where two levels of
non-response showed: unit non-response and item non-response. In BRFSS data, if a person
refuse to participate or didn’t respond or the person can’t understand English and Spanish, then
unit non-response occurs. Item non-response occurs when useful data are not obtained for all
Measurement Error: The quality of measurements in BRFSS data can be affected by the question
order, question wording, response-code precision, recall error, length of interview, interviewer
technique, coding errors and simple data entry error36.
1.2.3 Variables Related to Complex Survey Data Analysis
BRFSS survey is a complex survey data where variables related to complex survey were
collected. Within our study, all these variables were checked for 12 years from 2002 to 2013.
These variables include _PSU, _STSTR, _FINALWT and _LLCPWT.
Primary sampling unit (_PSU): Value should be unique for a state for a year. Sample design
stratification variable (_STSTR): This is a five digit number that combines the values for state,
Geographic Stratum Code and Household Density Stratum Code.
The weighting variable was _FINALWT in 2002-2010 while the weighting variable was
_LLCPWT for year 2011-2013. FINAL WEIGHT = The design weight is raked to 8 margins
(age group by gender, race/ethnicity, education, marital status, tenure, gender by race/ethnicity,
age group by race/ethnicity, phone ownership). If geographic regions are included, four
additional margins (region, region by age group, region by gender, region by race/ethnicity) are
included. Post stratification weights are used in order to partially correct any bias caused by
non-telephone coverage.
1.3 Purpose of Study
The purpose of this study is to examine the trend of preventive healthcare utilization and
diabetes complications in both Asian American and Non-Hispanic white and try to find the racial
(BRFSS) data were used to perform our analysis. The BRFSS data is the largest telephone survey
data to collect uniform, state specific data on preventive health practices and risk behaviors that
are linked to chronic diseases, injuries, and preventable infectious diseases that affect the adult
population. BRFSS data were consistently used to provide valid and reliable estimates compared
with other national household survey.
1.4 Specific Aims
Specific Aim 1: The outcomes are preventive health care variables. Trend for each
individual outcome in Asian Americans and Non-Hispanic whites as well as the racial disparities
will be examined. All preventive health care variables will be determined from self-reported
data.
Specific Aim 2: The outcomes are diabetes complications variables. Trend for each
outcome in Asian Americans and Non-Hispanic whites as well as the racial disparities will be
examined. All diabetes complications variables will be determined from self-reported data.
Specific Aim 3: The outcomes for this specific aim are diabetes complications. The main
independent variables are preventive health care variables, group and year. The association
between diabetes complications and the preventive health care utilization as well as the racial
differences will be assessed.
If any of the preventive health care or diabetes complication outcomes was not measured
2 METHODS AND PROCEDURES
2.1 Study Population
Data files were downloaded from the CDC website in SAS Transport format. Adults aged 18
years or older with type 2 diabetes from the 2002-2013 Behavior Risk Factor Surveillance
system were utilized to do analysis. The variables with missing values exceeded 20% were
excluded from the study measures. The separate dataset was analyzed for each and the combined
data also was analyzed to examine the differences. Because same variable may have different
measurement in different year, the related variables in each year were checked to make sure they
are combinable.
2.2 Study Measures
2.2.1 Diabetes Status and Typology
Diabetes status was determined using responses to the question, “Have you ever been told by a
doctor that you have diabetes”. BRFSS participants were considered to have diabetes if they
reported having been told by a doctor that they had the disease. Women who reported diabetes
only when pregnant and respondents told they had pre-diabetes or borderline diabetes will be
treated as non-diabetic individuals. Study participants were considered to have type 2 diabetes if
their age at diagnosis was 30 years or older or if their age at diagnosis was less than 30 years and
they did not use insulin39, 40.
2.2.2 Race and Ethnicity
Race and ethnicity status were based on self-report data. Ethnicity was coded as Hispanic
or non-Hispanic. Non-Hispanic participants were assigned one of the following racial categories:
Indian/Native Alaskan (Native American), other, or mixed race. We included non-Hispanic
white and Asian in our study. Other socioeconomic status variable including age, gender,
education, income, access to health care and US born also will be adjusted. If more than 5%
missing values are observed for any socioeconomic status variable, the unknown level will be
added for that variable.
2.2.3 Diabetes Complications
The diabetes complications include three aspects: 1) Diabetic retinopathy is defined from
question ‘Has a doctor ever told you that diabetes has affected your eyes or that you had
retinopathy?’ 2) Foot complication is determined from question ‘Have you ever have any sores
or irritations on your feet that took more than four weeks to heal?’ 3) Neuropathy and
cardiovascular disease will be defined if they reported at least one of the following
cardiovascular disease or neuropathy: hypertension, angina, coronary heart attack, stroke, or
other form of heart disease. All these disease status are from self-reported questions.
2.2.4 Preventive Care
The frequency for each individual outcome was presented first. Furthermore, the
preventive health care variables were reclassified as three groups: 1) Personally manage their
diabetes: if they reported checking their blood sugar levels at least once a day and if they
checked their feet for sores or irritations at least once a day, they will be treated as personally
manage their diabetes well. Otherwise, they were treated as no personally manage their diabetes.
2) Manage diabetes via healthcare provider: if they visited a healthcare professional for diabetes
within past year, had their hemoglobin A1c checked at least twice a year, and had their feet
past year, they were treated as manage diabetes well via healthcare provider. Otherwise, they
were treated as no manage diabetes via healthcare provider. 3) Adequately vaccinated: if they
received a flu vaccination in the past year and if they had ever got pneumonia vaccination, they
would be treated as adequately vaccinated. Otherwise, they would be treated as no adequately
vaccinated.
2.3 Statistical Analysis
Characteristics of Asians versus Non-Hispanic whites were compared over times which
include age, gender, access to health care and U.S. born. In each time period, t tests was used to
compare continuous variables and chi-square test was used to compare categorical variables.
In specific aim1 and aim2, for all the preventive health care utilization variables and
diabetes complications variables, data were plotted for 12 years to get first visualization and
examined in tabular forms in order to understand the general shape of the trend and identify any
entry errors and outliers in the data and in order to be familiar with the numbers and percentages
of each outcome being studied. Inspection of the data provided the basis for making subsequent
analysis choices. The age adjusted percentage change for each outcome variable was presented
for different year to check the trend of each outcome.
We assumed that the visual inspection would show a linear trend and that the percentage
changes for all the outcomes over years would be statistically independent. The logistic
regression model was constructed to assess the age adjusted percentage change of each outcome
variable for each year period in each group and overall population. The model included age and
year variables for overall population, Asian American only and Non-Hispanic whites only. The
applied because of different survey design. Multivariate logistic regression models was used to
determine if there was a linear trend in the outcome over the study time period in each race group
and the percentage change in outcome prevalence over the study time period. The dependent
variables are each preventive healthcare outcomes or diabetes complications. The model
included year period, races and the interaction terms that are race multiplied by year period. The
model also included other possible confounding effects such as age, socioeconomic status. All
these variables were also derived from self-reported data. Wald chi-square probabilities were
utilized to determine if there are significant linear trends over the study time period in the
outcome variable in each race group. Models were solved for years to determine the percent
change in outcome prevalence over the study time period for each race.
Finally, a logistic regression model including year, race year/race variables was used to
determine if there are significantly different linear trend in outcome variables over the study time
period between racial groups. Any statistically significant year/race variable indicates that there
is a significant difference in the outcome’s linear trend over the study time period between Asian
Americans and Non-Hispanic whites.
For specific aim 3, chi-square test was used to check if there is any association between
the preventive health care outcome and diabetes complications in overall population. The logistic
regression model with outcome of each diabetes complication was used to examine the trend of
preventive health care effect on complications within each group. Then the trend of this
association was assessed by constructing multiple logistic regression models. The year and race
All data management and analyses were performed using the SAS system (version 9.4;
SAS institute; Cary, NC). The complex survey-specific procedures accounted for the complex
survey design. P-value less than 0.05 were considered as statistically significant. No multiple
comparisons were considered in this study.
3 RESULTS
3.1 Diabetes Prevalence
Shown from table 1, figure 1 and figure2, 6640 Asian Americans and 365892 Whites
type II diabetes people were identified from the12 year data (2002-2013). The prevalence of
diabetes in Asian American increased from year 2002 (5.48%) to year 2013 (8.34%) although
decreased prevalence were observed in 2004 (4.55%) and 2005 (4.49%). The prevalence of
diabetes in Whites increased steadily from 2002 (6.33%) to 2013 (9.45%). In 2004 and 2005, the
diabetes prevalence in Asian is almost 40% less than Whites while the prevalence became only
20% less in Asian than in Whites in 2011 and 2012. The differences were all statistically
significant. After adjusting age, gender and BMI level, the diabetes prevalence in Asian within
12 years was all higher than diabetes prevalence in white where the odd ratio was from 1.57 to
2.12. In other words, the diabetes prevalence in Asian was 50% - 110% higher than the diabetes
prevalence in white and all odds ratios were statistically significant.
Table 1 Diabetes prevalence in Asian Americans and White from 2002-2013
Year Asian White
Raw odds ratio (95% CI)
2009 7.61(0.53) 8.20(0.07) 0.92(0.79-1.07) 2.07(1.77-2.43) 0.2797 2010 6.86(0.46) 8.42(0.07) 0.80(0.70-0.92) 1.97(1.69-2.30) 0.0020 2011 7.73(0.53) 9.15(0.08) 0.83(0.72-0.96) 1.95(1.66-2.28) 0.0144 2012 7.91(0.70) 9.45(0.08) 0.82(0.68-0.99) 1.78(1.45-2.20) 0.0439 2013 8.34(0.63) 9.45(0.08) 0.87(0.74-1.03) 2.12(1.77-2.53) 0.0981
0 1 2 3 4 5 6 7 8 9 10
Wei
gh
te
d
Per
ce
n
tage
Diabetes prevalence comparison between Asian and White over 12 years
Asian
[image:25.612.113.494.74.667.2]White
Figure 2 Adjusted Odds ratio of diabetes prevalence in Asian and White 2002-2013
[image:25.612.142.468.415.664.2]3.2 Demographic Characteristics
The characteristics of all 12 year participants with type 2 diabetes are shown in Table 2.
The percentage of Asian male participants with diabetes was higher than the percentage of White
males for all these 12 years. Except in 2003, 2005, 2012 and 2013 (p=0.8922, 0.3074, 0.2433
and 0.2479 respectively), these differences were all statistically significant. For all 12 years, the
percentages of who have some college or graduated from college in Asian were all significantly
higher than the percentages in whites. At earlier years before 2008, the percentage of having
income 50k or more in Asian Americans is higher than the percentage in Whites although there
were no statistically significant differences. These percentages became significantly higher in
Asians compare to whites after 2008. The percentages of employed and married in Asians were
all significantly higher than percentages in whites except for 2002. The obese rates of 12 years in
Asian increased from less than 10% to more than 20% while these rates in Whites increased from
around 45% to almost 55%. Compared to whites, Asian Americans had much lower obese rate
for all 12 years.
Table 2 Demographic Characters of Participants with type 2 2002-2013
Asian (weighted percent or mean with
SE)
White (weighted percent or mean with
SE) p-value
2002 Male 65.56(7.27) 49.94(0.71) 0.0414
Education some
college or graduate 89.01(2.66) 48.83(0.71) <0.0001
Income 50k or more 56.37(9.13) 26.16(0.71) 0.0002
Employed 63.13(8.44) 40.86(0.70) 0.01
Married 73.14(7.32) 63.17(0.66) 0.3848
Obese 7.87(2.98) 47.04(0.73) <0.0001
2003 Male 50.43(8.39) 51.55(0.71) 0.8922
Education some
college or graduate 69.20(9.44) 49.14(0.71) 0.0225
Income 50k or more 42.77(6.93) 28.26(0.73) 0.0804
Employed 53.36(8.63) 42.55(0.71) 0.2098
Married 69.77(9.61) 63.91(0.66) 0.0037
Obese 11.02(3.63) 49.02(0.73) <0.0001
2004 Male 73.26(7.08) 51.28(0.67) 0.0062
college or graduate
Income 50k or more 41.93(8.24) 28.98(0.68) 0.2443
Employed 60.31(8.98) 40.56(0.66) 0.0295
Married 90.11(3.22) 63.50(0.63) <0.0001
Obese 14.60(6.38) 49.65(0.69) <0.0001
2005 Male 57.45(6.42) 50.80(0.58) 0.3074
Education some
college or graduate 78.51(4.41) 51.19(0.58) <0.0001
Income 50k or more 40.31(7.06) 31.81(0.63) 0.4206
Employed 63.98(6.01) 41.09(0.58) 0.0002
Married 83.96(3.26) 64.05(0.53) <0.0001
Obese 12.30(2.60) 51.00(0.60) <0.0001
2006 Male 69.02(4.78) 52.16(0.60) 0.0012
Education some
college or graduate 81.90(4.48) 51.95(0.60) <0.0001
Income 50k or more 41.22(5.55) 33.70(0.65) 0.2424
Employed 63.29(5.38) 41.88(0.61) 0.0001
Married 78.51(4.30) 63.34(0.57) <0.0001
Obese 22.67(4.71) 50.99(0.63) <0.0001
2007 Male 65.35(4.62) 51.73(0.48) 0.0052
Education some
college or graduate 74.07(4.26) 53.00(0.48) <0.0001
Income 50k or more 40.49(4.98) 37.28(0.54) 0.0414
Employed 52.49(4.89) 40.98(0.49) 0.0177
Married 85.98(2.85) 63.79(0.45) <0.0001
Obese 19.09(3.95) 51.87(0.50) <0.0001
2008 Male 67.81(3.62) 51.69(0.48) <0.0001
Education some
college or graduate 75.00(3.48) 53.69(0.48) <0.0001
Income 50k or more 45.46(4.42) 37.11(0.53) 0.071
Employed 54.17(4.19) 41.98(0.49) 0.0035
Married 77.28(3.30) 63.38(0.46) 0.0008
Obese 18.58(2.85) 53.07(0.50) <0.0001
2009 Male 63.18(3.32) 51.78(0.46) 0.001
Education some
college or graduate 77.62(2.98) 53.80(0.46) <0.0001
Income 50k or more 50.51(3.82) 36.63(0.50) 0.0008
Employed 55.68(3.53) 40.62(0.47) <0.0001
Married 80.05(2.79) 63.51(0.43) <0.0001
Obese 23.31(3.40) 52.77(0.47) <0.0001
2010 Male 64.45(3.06) 52.72(0.44) 0.0003
Education some
college or graduate 79.21(2.65) 55.26(0.44) <0.0001
Income 50k or more 52.36(3.63) 37.27(0.49) <0.0001
Employed 57.71(3.37) 39.05(0.45) <0.0001
Married 81.98(2.17) 63.79(0.41) <0.0001
Obese 18.61(2.67) 53.82(0.46) <0.0001
2011 Male 58.23(3.57) 50.72(0.45) 0.0393
Education some
college or graduate 76.91(3.16) 48.08(0.45) <0.0001
Income 50k or more 54.8(3.79) 33.48(0.47) <0.0001
Employed 59.47(3.40) 37.02(0.44) <0.0001
Married 70.19(3.22) 57.44(0.44) 0.0005
Obese 23.73(3.11) 54.20(0.46) <0.0001
2012 Male 57.37(4.56) 51.98(0.46) 0.2433
college or graduate
Income 50k or more 47.49(4.79) 35.12(0.48) 0.0096
Employed 53.55(4.75) 37.40(0.45) 0.0005
Married 67.70(4.23) 56.99(0.46) 0.0052
Obese 19.73(3.71) 53.48(0.47) <0.0001
2013 Male 55.85(4.07) 51.08(0.46) 0.2479
Education some
college or graduate 68.25(4.05) 50.07(0.46) 0.0002
Income 50k or more 46.53(4.45) 34.93(0.49) 0.0085
Employed 55.31(4.04) 36.79(0.45) <0.0001
Married 68.21(3.94) 58.83(0.45) 0.0019
Obese 23.22(3.45) 54.63(0.47) <0.0001
3.3 Preventive Health Care Utilizations
[image:28.612.104.493.75.211.2]3.3.1 Personally Diabetes Management
Table 3, 4 and 5 showed the results of personally diabetes management which included
blood sugar self-checking, checking feet for sore or irritation by oneself as well as the combined
personally diabetes management variable.
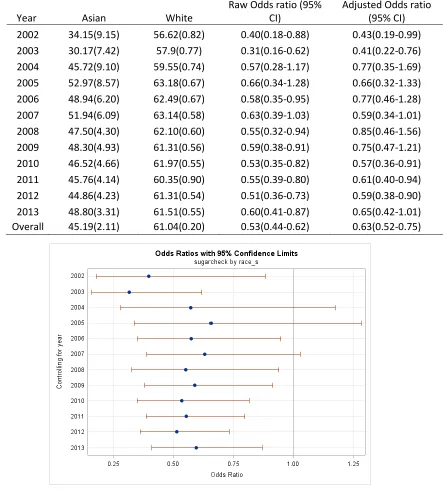
Table 3 showed the results of combined 12 years data as well as separate year data for
blood sugar self-checking. Asians were significantly less likely to check their blood sugar at least
one day by themselves compared to whites. The odds ratio equaled 0.53 with 95% confidence
interval (0.44-0.62) which means that the Asian Americans are almost 50% less likely to check
their blood sugar at least one day. After adjusting the possible covariates age, gender, income,
education, marriage status as well as obese status, the Asians still remained almost 40% less
likely to do it. For both Asian and whites, there were peak times during year 2004-2007. The
Asian’s blood sugar self-checking rate reached to 53% and the whites’ rate had the highest 63%.
The percentage of blood sugar self-checking at least once a day in Asians is around 45% and the
percentage of blood sugar self-checking at least once a day in whites is around 60%. From the
results showed in figure, the blood sugar self-checking at least once a day rates in Asians were
After adjusting for possible demographical risk factors as well as the obese status, almost half of
the 12 years still had significantly difference between Asians and whites.
Table 3 Blood sugar self-checking in Asian and White
Year Asian White
Raw Odds ratio (95% CI)
[image:29.612.88.533.163.653.2]Adjusted Odds ratio (95% CI) 2002 34.15(9.15) 56.62(0.82) 0.40(0.18-0.88) 0.43(0.19-0.99) 2003 30.17(7.42) 57.9(0.77) 0.31(0.16-0.62) 0.41(0.22-0.76) 2004 45.72(9.10) 59.55(0.74) 0.57(0.28-1.17) 0.77(0.35-1.69) 2005 52.97(8.57) 63.18(0.67) 0.66(0.34-1.28) 0.66(0.32-1.33) 2006 48.94(6.20) 62.49(0.67) 0.58(0.35-0.95) 0.77(0.46-1.28) 2007 51.94(6.09) 63.14(0.58) 0.63(0.39-1.03) 0.59(0.34-1.01) 2008 47.50(4.30) 62.10(0.60) 0.55(0.32-0.94) 0.85(0.46-1.56) 2009 48.30(4.93) 61.31(0.56) 0.59(0.38-0.91) 0.75(0.47-1.21) 2010 46.52(4.66) 61.97(0.55) 0.53(0.35-0.82) 0.57(0.36-0.91) 2011 45.76(4.14) 60.35(0.90) 0.55(0.39-0.80) 0.61(0.40-0.94) 2012 44.86(4.23) 61.31(0.54) 0.51(0.36-0.73) 0.59(0.38-0.90) 2013 48.80(3.31) 61.51(0.55) 0.60(0.41-0.87) 0.65(0.42-1.01) Overall 45.19(2.11) 61.04(0.20) 0.53(0.44-0.62) 0.63(0.52-0.75)
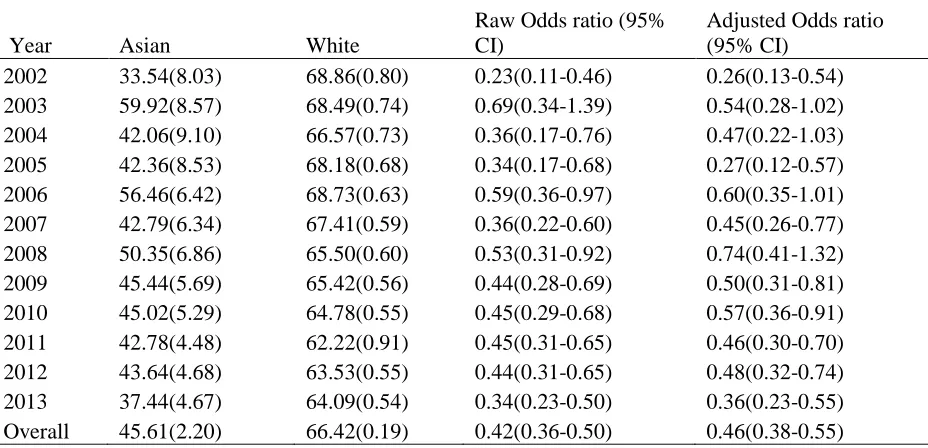
Table 4 showed the results of combined 12 years data as well as separate year data for feet
self-checking. Data of combined 12 years showed that Asians’ self-checking feet for sore or
irritation rate was 46% while this rate in whites was 66%. The Asians were almost 60% less
likely to self-check their feet for sore or irritation compare to white (odds ratio=0.42(0.36-0.50)).
After adjusting the possible covariates, this relationship still remain significant (odds
ratio=0.46(0.38-0.55)). The feet self-checking rates in Asian had the lowest 34% in 2002 and the
highest 60% in 2003. The other years had rate from 37% to 56%. The feet self-checking rates in
white had the lowest 62% in 2011 and the highest 69% in 2002, 2003 and 2006. The other years
had rate from 64% to 67%.
Compared to white, the feet self-checking rates in Asian were 30-75% lower and they
were statistically significant except for year 2003. After adjusting the possible demographic
characteristics and obese status, the Asian still were 25-75% less likely to check their feet for
sore and irritation compare to white. The odds ratios in some years such as 2002, 2006 and 2008
[image:30.612.75.539.486.710.2]turned to be not statistically significant.
Table 4 Feet self-checking for sores or irritations in Asian and White
Year Asian White
Raw Odds ratio (95% CI)
Adjusted Odds ratio (95% CI)
Table 5 showed the results of combined 12 years data as well as separate year data for
personally diabetes management. The results from the combined data showed that Asian’s
personally well diabetes management rate was 23% while this rate in white was 43%. Then
Asian was 60% less likely to perform personally diabetes management well compare to white.
After adjusting possible risk factors, this association still remained significant (odds
ratio=0.50(0.40-0.61)). The separate year data showed that the Asian’s well personally
management rates were the lowest in 2002 of 10% and were the highest in 2008 of 35%. On the
other hand, the white’s well personally management rates were from 41% to 45% throughout the
12 year period. Compared to white, the Asian was 30% to 80% less likely to perform well
[image:31.612.146.470.72.314.2]personally diabetes management.
Except for 2004 and 2008, the other years were all statistically significant. After
adjusting covariates, there were more years results became not significant, such as 2006, 2009
[image:32.612.82.538.181.408.2]and 2010.
Table 5 Personally diabetes management in Asian and White
Year Asian White
Raw Odds ratio (95% CI)
Adjusted Odds ratio (95% CI) 2002 9.92(2.70) 40.95(0.80) 0.16(0.09-0.29) 0.17(0.08-0.33) 2003 18.55(5.79) 41.87(0.75) 0.32(0.15-0.67) 0.39(0.19-0.80) 2004 26.33(7.81) 42.27(0.73) 0.49(0.22-1.08) 0.65(0.26-1.60) 2005 23.19(7.38) 45.04(0.69) 0.37(0.16-0.83) 0.27(0.12-0.59) 2006 31.17(6.03) 44.55(0.67) 0.56(0.32-0.98) 0.68(0.38-1.22) 2007 20.59(5.56) 45.01(0.59) 0.32(0.16-0.62) 0.38(0.18-0.80) 2008 34.24(6.73) 43.10(0.58) 0.69(0.38-1.24) 1.10(0.58-2.09) 2009 24.94(4.64) 42.07(0.54) 0.46(0.28-0.75) 0.69(0.41-1.17) 2010 28.53(4.62) 42.66(0.55) 0.54(0.34-0.84) 0.75(0.46-1.22) 2011 22.68(3.47) 40.62(0.91) 0.43(0.29-0.64) 0.50(0.31-0.78) 2012 23.31(3.54) 40.80(0.54) 0.44(0.30-0.65) 0.53(0.34-0.84) 2013 17.79(3.53) 41.36(0.54) 0.31(0.19-0.49) 0.33(0.19-0.55) Overall 23.05(1.67) 42.69(0.19) 0.40(0.33-0.48) 0.50(0.40-0.61) Personally management was defined as check sugar at least once a day and check feet at least once a day.
[image:32.612.151.474.436.678.2]3.3.2 Diabetes Management with Healthcare Providers
Table 6-10 showed the results of diabetes management with healthcare providers which
included routine checkup, checking feet and eyes with doctors, checking HbA1C at least twice a
year as well as the combined healthcare management variable.
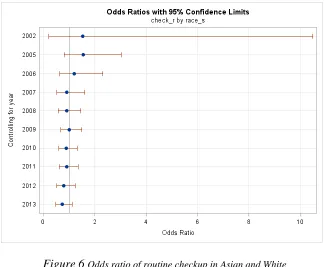
Combined data in table 6 showed that the routine checkup rate within past year in Asian
was 86% and this rate in white was 87%. No significantly differences were detected between
Asian and white. Regarding the separate year data, there was no measure of routine checkup in
year 2003 and 2004. The routine checkup rate in Asian and white over 12 years were all around
84-88%. There were also no statistically significant changes detected from either raw model or
adjusted model. The figure showed a big range of 95% confidence interval for odds ratio
between Asian and white in year 2002.
Table 6 Routine checkup with healthcare provider in Asian and White
Year Asian White
Raw Odds ratio (95% CI)
Adjusted Odds ratio (95% CI) 2002 93.30(6.07) 90.13(1.36) 1.53(0.22-10.48) 2.33(0.26-21.10)
2003 - - -
2004 - - -
The combined data results as well as the separate year results of checking feet for sore or
irritation with doctors in past year were shown in Table 7. The overall rate of checking feet with
doctors within past year in Asian was 63% and this rate in white was 71%. The Asian was almost
30% less likely to check their feet with doctors within past year compare to white. After
adjusting the possible demographic risk factors, this odds ratio remained unchanged (odds
ratio=0.74(0.60-0.91)). Focusing on each year, the checking rates in Asian ranged from 49% in
2002 to 75% in 2010 while these rates in white ranged from 67% in 2002 to 75% in 2011.
Compare the Asian to white within each specific year, only significant differences were detected
in year 2004 and 2007 (odds ratio=0.47(0.23-0.96) and 0.53(0.31-0.88) respectively). After
adjusting the covariates, the significant difference only remained in 2007.
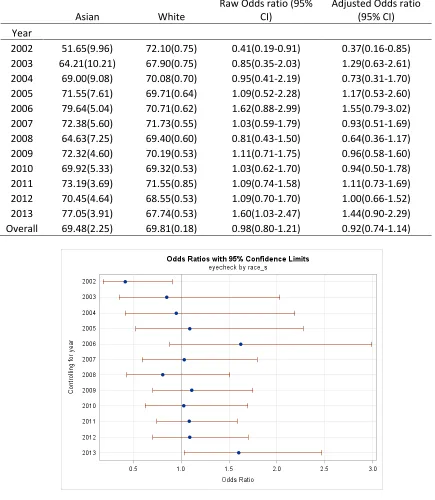
Results for rate of checking eye with doctors in past year in Asian and white were shown
in Table 8. The overall rates of checking eye with doctors within past a year were very similar in
[image:34.612.145.470.70.337.2]Asian and white which was 70%. No significant difference was examined. Separate year data Figure 6 Odds ratio of routine checkup in Asian and White
Table 7 Checking feet with doctors for sore or irritation in Asian and White
Asian White
Raw Odds ratio (95% CI)
Adjusted Odds ratio (95% CI)
Year
2002 49.12(9.88) 67.33(0.81) 0.47(0.22-1.02) 0.48(0.21-1.10) 2003 66.13(8.14) 69.05(0.72) 0.88(0.43-1.79) 0.66(0.34-1.29) 2004 49.31(9.2) 67.61(0.73) 0.47(0.23-0.96) 0.67(0.31-1.45) 2005 59.88(8.78) 69.24(0.65) 0.66(0.32-1.66) 0.69(0.31-1.51) 2006 69.77(5.74) 69.98(0.63) 0.99(0.58-1.69) 1.05(0.61-1.84) 2007 56.42(6.5) 71.15(0.55) 0.53(0.31-0.88) 0.56(0.32-0.99) 2008 69.88(6.36) 70.28(0.58) 0.98(0.54-1.78) 1.17(0.62-2.22) 2009 65.12(5.83) 72.91(0.50) 0.69(0.42-1.15) 0.62(0.35-1.09) 2010 74.47(5.26) 71.93(0.53) 1.14(0.66-1.96) 1.19(0.63-2.25) 2011 69.82(4.14) 75.15(0.80) 0.77(0.52-1.13) 0.68(0.44-1.06) 2012 64.44(4.75) 72.59(0.50) 0.68(0.45-1.03) 0.72(0.45-1.15) 2013 71.92(4.13) 72.27(0.52) 0.98(0.66-1.47) 1.01(0.66-1.52) Overall 63.25(2.22) 70.55(0.18) 0.72(0.60-0.87) 0.74(0.60-0.91)
results showed the similar findings. The eye checking rates in Asian ranged from 52% in 2002 to
[image:35.612.82.521.94.609.2]77% in 2013 while these rates in white ranged from 68% in 2003 to 72% in 2002 and 2011. Figure 7 Odds ratio of checking feet for sore or irritation
Table 8 Checking eyes with doctors in Asian and White
Asian White
Raw Odds ratio (95% CI)
Adjusted Odds ratio (95% CI)
Year
2002 51.65(9.96) 72.10(0.75) 0.41(0.19-0.91) 0.37(0.16-0.85) 2003 64.21(10.21) 67.90(0.75) 0.85(0.35-2.03) 1.29(0.63-2.61) 2004 69.00(9.08) 70.08(0.70) 0.95(0.41-2.19) 0.73(0.31-1.70) 2005 71.55(7.61) 69.71(0.64) 1.09(0.52-2.28) 1.17(0.53-2.60) 2006 79.64(5.04) 70.71(0.62) 1.62(0.88-2.99) 1.55(0.79-3.02) 2007 72.38(5.60) 71.73(0.55) 1.03(0.59-1.79) 0.93(0.51-1.69) 2008 64.63(7.25) 69.40(0.60) 0.81(0.43-1.50) 0.64(0.36-1.17) 2009 72.32(4.60) 70.19(0.53) 1.11(0.71-1.75) 0.96(0.58-1.60) 2010 69.92(5.33) 69.32(0.53) 1.03(0.62-1.70) 0.94(0.50-1.78) 2011 73.19(3.69) 71.55(0.85) 1.09(0.74-1.58) 1.11(0.73-1.69) 2012 70.45(4.64) 68.55(0.53) 1.09(0.70-1.70) 1.00(0.66-1.52) 2013 77.05(3.91) 67.74(0.53) 1.60(1.03-2.47) 1.44(0.90-2.29) Overall 69.48(2.25) 69.81(0.18) 0.98(0.80-1.21) 0.92(0.74-1.14)
Table 9 showed checking HbA1C with doctors at least twice a year in Asian and white for
overall data and separate year data. Overall, the percentage of checking HbA1C with doctors at
[image:36.612.85.520.108.608.2]least twice a year in Asian was almost 88% while this rate in white was 90%. There was no Figure 8 Odds ratio of checking eyes with doctors in Asian
significant difference between Asian and white for both raw comparison and adjusting possible
risk factors (odds ratio=0.74(0.51-1.08 and 0.96(0.68-1.36) respectively)). Taking look at the
separate year results, the HbA1C checking at least twice a year rates within Asian were from
81% to 97% except 2003 which had a rate 67%. These rates in white were around 90%. There
[image:37.612.85.505.237.459.2]were no significant differences for each year of these 12 years.
Table 9 Checking HbA1C with doctors at least twice a year in Asian and White
Asian White
Raw Odds ratio (95% CI)
Adjusted Odds ratio (95% CI)
Year
2002 84.62(9.19) 89.97(0.66) 0.61(0.15-2.47) 0.82(0.23-2.98) 2003 67.25(12.20) 90.07(0.55) 0.23(0.08-0.68) 0.45(0.16-1.27) 2004 97.15(1.45) 87.97(0.60) 4.67(1.67-13.06) 5.91(1.72-20.32) 2005 81.42(7.86) 88.71(0.51) 0.56(0.20-1.55) 0.59(0.24-1.44) 2006 90.47(3.97) 89.10(0.45) 1.17(0.47-2.88) 1.50(0.62-3.61) 2007 96.10(1.15) 91.52(0.32) 2.28(1.24-4.19) 2.87(1.38-6.00) 2008 81.01(6.25) 90.33(0.38) 0.46(0.20-1.02) 0.54(0.23-1.32) 2009 92.73(2.79) 91.78(0.33) 1.14(0.51-2.58) 2.14(0.93-4.88) 2010 91.21(2.78) 91.19(0.36) 1.00(0.51-1.99) 1.02(0.41-2.50) 2011 89.09(2.93) 92.01(0.56) 0.71(0.39-1.30) 0.69(0.34-1.38) 2012 92.03(2.06) 91.44(0.35) 1.08(0.62-1.89) 1.06(0.55-2.05) 2013 89.98(2.95) 92.21(0.36) 0.76(0.40-1.45) 0.72(0.35-1.49) Overall 87.53(2.06) 90.44(0.13) 0.74(0.51-1.08) 0.96(0.68-1.36)
Diabetes management with healthcare providers combined routine checkup, feet and eye
checking with doctors and HbA1C checking. These results were shown in table 10. Overall, only
17 % of Asian and 26% of white managed their diabetes with healthcare providers. Asian was
more than 40% less likely to manage their diabetes via healthcare providers (odds ratio = 0.57
(0.50-0.65)). After adjusting the possible risk factors, this relationship remained unchanged
(odds ratio=0.57(0.49-0.66)). Separate year results showed that the percentage differences of
managing diabetes via healthcare providers between Asian and white mainly appeared in recent
Table 10 Diabetes management with healthcare providers in Asian and White
Asian White
Raw Odds ratio (95% CI)
Adjusted Odds ratio (95% CI)
Year
[image:38.612.86.528.402.648.2]2002 2.62(1.63) 3.74(0.21) 0.69(0.20-2.43) 0.91(0.26-3.16) 2003 36.18(7.55) 43.24(0.75) 0.74(0.39-1.42) 0.80(0.44-1.47) 2004 28.62(7.38) 40.46(0.73) 0.59(0.29-1.20) 0.72(0.33-1.54) 2005 27.84(6.27) 29.81(0.54) 0.91(0.49-1.68) 0.79(0.42-1.48) 2006 42.08(5.61) 34.35(0.59) 1.39(0.88-2.19) 1.25(0.77-2.03) 2007 26.23(4.22) 28.97(0.44) 0.87(0.57-1.34) 0.93(0.58-1.48) 2008 14.78(2.52) 25.98(0.40) 0.49(0.33-0.73) 0.52(0.34-0.79) 2009 15.70(2.68) 30.57(0.43) 0.42(0.28-0.63) 0.41(0.26-0.65) 2010 14.43(2.03) 26.65(0.38) 0.46(0.34-0.64) 0.49(0.33-0.70) 2011 7.14(1.06) 9.15(0.23) 0.76(0.56-1.05) 0.74(0.52-1.05) 2012 8.09(1.16) 20.54(0.31) 0.34(0.25-0.46) 0.38(0.27-0.53) 2013 12.34(1.88) 23.10(0.32) 0.47(0.33-0.66) 0.50(0.34-0.74) Overall 16.62(0.93) 25.99(0.13) 0.57(0.50-0.65) 0.57(0.49-0.66)
3.3.3 Flu Vaccination and Pneumonia Shot or Pneumococcal Vaccine
Table 11 showed Flu vaccination and pneumonia shot or pneumococcal vaccine in Asian
and white. Overall, 58% Asian got flu shot in past a year and 43% got pneumonia shot or
pneumococcal vaccine while these rates in whites were 61% and 60%. Compare to white, Asian
was 13% less like to get flu shot and 50% less likely to get pneumonia shot or pneumococcal
vaccine (odds ratio=0.87(0.77-0.98) and 0.50(0.44-0.57) respectively). After adjusting possible
risk factors, the flu shot rate in Asian changed (odds ratio=0.89(0.79-1.02) while the pneumonia
shot or pneumococcal vaccine rate was still statistically significant (odds ratio=0.54(0.47-0.62)).
The separate year data results showed that Asian had the lowest flu shot rate of 44% in 2003 and
the highest rate of 64% in 2012 while Asian had the lowest pneumonia shot or vaccination rate
of 30% in 2002 and the highest pneumonia shot or vaccination rate of 54% in 2013. The white
had the lowest rate of 54% in 2005 and the highest rate of 67% in 2007 while they had the lowest
[image:39.612.146.470.72.314.2]pneumonia shot or vaccination rate of 53% in 2002 and the highest rate of 64% in 2013.Compare Figure 10 Odds ratio diabetes management with healthcare
to white, Asian’s flu shot rate had no significant differences in most years except 2003, and
2013. After adjusting the demographic characteristics, the significant differences in 2003 and
2013 changed to not statistically significant. On the other hand, Asian was 33% to 63% less
likely to get pneumonia shot or pneumococcal vaccination compare to white. After adjusting
possible risk factors, these relationships remained unchanged except the relationship between
[image:40.612.90.545.260.713.2]Asian and white in 2003 and 2013.
Table 11 Flu vaccination & pneumonia shot in Asian and White from 2002-2013
Asian White
Raw Odds ratio (95% CI)
Adjusted odds ratio (95% CI) Received flu
vaccination
within past year Year
2002 55.88(8.43) 61.14(0.69) 0.80(0.41-1.58) 0.87(0.43-1.76) 2003 43.76(7.86) 61.30(0.71) 0.49(0.26-0.92) 0.64(0.35-1.17) 2004 52.83(8.33) 61.39(0.66) 0.70(0.37-1.36) 0.88(0.45-1.73) 2005 50.35(6.54) 54.61(0.59) 0.84(0.50-4.41) 0.78(0.43-1.41) 2006 56.63(5.65) 61.86(0.61) 0.81(0.51-1.27) 0.74(0.44-1.24) 2007 57.92(4.87) 66.31(0.47) 0.70(0.47-1.04) 0.72(0.46-1.14) 2008 57.27(4.38) 64.40(0.49) 0.74(0.52-1.05) 0.82(0.55-1.21) 2009 57.68(3.75) 64.68(0.46) 0.74(0.55-1.01) 0.75(0.53-1.05) 2010 57.65(3.49) 63.87(0.45) 0.77(0.58-1.02) 0.77(0.55-1.07) 2011 57.99(3.78) 57.16(0.47) 1.03(0.76-1.41) 1.03(0.73-1.44) 2012 64.07(4.62) 57.91(0.46) 1.30(0.87-1.92) 1.43(0.98-2.10) 2013 61.28(4.13) 58.29(0.48) 1.13(0.80-1.60) 1.06(0.72-1.56) Overall 57.60(1.51) 61.03(0.15) 0.87(0.77-0.98) 0.89(0.79-1.02) A pneumonia
shot or pneumococcal
vaccine
2010 36.08(3.35) 61.29(0.46) 0.36(0.27-0.48) 0.47(0.34-0.65) 2011 47.13(3.95) 63.65(0.47) 0.51(0.37-0.70) 0.57(0.40-0.83) 2012 51.34(5.27) 63.17(0.47) 0.62(0.41-0.93) 0.60(0.39-0.90) 2013 53.95(4.45) 63.61(0.49) 0.67(0.47-0.95) 0.83(0.56-1.23) Overall 42.51(1.54) 59.53(0.16) 0.50(0.44-0.57) 0.54(0.47-0.62)
[image:41.612.100.508.73.410.2]
Figure 11 Odds ratio of flu shot in Asian and White 2002-2013
[image:41.612.130.456.428.676.2]3.4 Diabetes Complications
3.4.1 Diabetes Retinopathy
Table 12 showed the diabetes retinopathy complication in Asian and white. The
combined data results showed that the diabetes retinopathy rate in Asian was 28% while this rate
in white was 17%. The difference between these two groups was statistically significant (odds
ratio=1.86(1.54-2.26)). After adjusting the demographic characteristics and obese status, Asian
was almost 150% more likely to develop diabetes retinopathy compare to white. There was no
apparent increase or decrease trend over the 12 year period for both Asian and white. The
diabetes retinopathy rates in Asian were significantly higher than white in most years except
2003, 2005 and 2007. The highest difference was presented in year 2011 where Asian was
almost 180% more likely to develop diabetes retinopathy. After adjusting the possible risk
[image:42.612.69.539.437.672.2]factors for each year, the differences between these two groups remained the same trend.
Table 12 Diabetes retinopathy in Asian and White from 2002-2013
Year Asian White
Raw Odds ratio (95% CI)
Adjusted odds ratio (95% CI) 2002 39.38(10.13) 21.14(0.70) 2.42(1.05-5.59) 3.55(1.72-7.36)
3.4.2 Feet Sore or Irritation
The feet sore or irritation complications in participants were only measured in 2002-2007.
The combined data result showed that Asian have a rate of 9% while white had a rate of 11%.
This difference was not statistically significant for raw and adjusted model (odds
ratio=0.81(0.42-1.59) and 0.68(0.38-1.22) respectively). The rates of feet sore or irritation in
Asian were not consistent with these six year period while the rates in white were steady at
[image:43.612.145.470.71.311.2]10-11%.
Table 13 Feet sore or irritation in Asian and White from 2002-2013
Asian White
Raw Odds ratio (95% CI)
Adjusted odds ratio (95% CI) Year
2002 7.40(5.88) 10.68(0.50) 0.67(0.12-3.60) 0.80(0.17-3.75) 2003 18.68(11.30) 11.12(0.52) 1.84(0.43-7.92) 0.64(0.16-2.58) 2004 9.38(6.49) 10.83(0.49) 0.85(0.19-3.82) 1.25(0.27-5.79) 2005 6.34(3.14) 10.42(0.41) 0.58(0.21-1.65) 0.45(0.12-1.71) 2006 9.07(3.56) 10.66(0.50) 0.84(0.36-1.96) 0.96(0.40-2.30) 2007 2.10(0.91) 10.21(0.37) 0.19(0.08-0.45) 0.22(0.09-0.57)
Overall 8.86(2.75) 10.66(0.19) 0.81(0.42-1.59) 0.68(0.38-1.22)
3.4.3 Neuropathy and Cardiovascular Diseases
The neuropathy and cardiovascular complications were combined variable which
considered hypertension, angina, coronary heart attack, stroke, or other form of heart disease.
The combined data showed that Asian had 45% of this complication while white had 56% of it.
The Asian was more than 35% less likely to develop this complication compare to white. After
adjusting the covariates, Asian still was almost 15% less likely to develop neuropathy and
cardiovascular complications. For year 2006, 2008, 2010 and 2012, the high blood pressure as
well as the high blood cholesterol didn’t get measured. Comparison of these years’ data showed
that there were no significant changes in both Asian and white. Comparison of other years’ data
showed that the neuropathy and cardiovascular disease complications were increased both in
Asian and white.
[image:44.612.69.523.72.351.2]Asian White
Raw Odds ratio (95% CI)
Adjusted odds ratio (95% CI) Year
2002 20.15(11.45) 58.83(1.21) 0.18(0.04-0.71) 0.49(0.10-2.34) 2003 40.50(7.50) 67.10(0.68) 0.33(0.18-0.62) 0.590.34-1.03) 2004 42.75(15.09) 59.61(1.17) 0.51(0.15-1.70) 1.08(0.33-3.47) 2005 62.78(6.56) 72.74(0.52) 0.63(0.36-1.10) 1.23(0.68-2.23) 2006 19.29(4.64) 30.23(0.57) 0.55(0.31-0.99) 0.61(0.31-1.19) 2007 56.44(4.84) 74.54(0.43) 0.44(0.30-0.65) 0.53(0.34-0.83) 2008 22.37(3.71) 28.05(0.41) 0.74(0.49-1.13) 0.76(0.48-1.21) 2009 58.38(3.56) 73.95(0.43) 0.49(0.37-0.66) 0.78(0.55-1.11) 2010 14.28(2.22) 28.00(0.38) 0.43(0.30-0.61) 0.51(0.34-0.76) 2011 70.91(3.26) 76.95(0.41) 0.73(0.53-0.99) 1.13(0.79-1.62) 2012 18.90(4.54) 28.12(0.40) 0.60(0.33-1.07) 0.74(0.39-1.38) 2013 71.70(3.17) 77.47(0.39) 0.74(0.54-1.00) 1.06(0.73-1.53) Overall 44.70(1.47) 55.74(0.16) 0.64(0.57-0.72) 0.85(0.75-0.97)
4 DISCUSSION
The type II diabetes disproportionally distributed among different races/ethnicities and
[image:45.612.68.536.71.606.2]minorities possessed higher rate of diabetes compared to white41. In this study, the 12 year Figure 15 Odds ratio of neuropathy and cardio-vascular
BRFSS data were utilized to compare the diabetes complications and diabetes preventive health
care utilizations. The results showed that the prevalence of diabetes in Asian was lower than
prevalence in white before adjusting age, gender and BMI which is not consistent with the report
from American Diabetes Association, where they reported that the Asian population had higher
type II diabetes prevalence compared to their white counterparts42. This may be due to the
telephone survey sampling of Asian population. After adjusting with age, gender and BMI levels,
the diabetes prevalence in Asian in 12 years was 50% - 110% higher than the diabetes prevalence
in white and all odds ratios were statistically significant. So our data well coincide with the
previous studies. Several studies explained the possible reasons for this difference 43-49 which
formed the foundation for our study. The reason includes environmental risks as well as the race
factors. Using same criterion of obesity for Asian population, the obesity rate in Asian is
significantly lower than white while this difference is not statistically significant if different
criterion were applied as mentioned by WHO expert consultation50. After adjusted with BMI, the
diabetes prevalence in Asian was much higher than the prevalence in white at the same BMI
level.
A number of diabetes associated health complications including cardiovascular disease,
retinopathy and limb amputation have been reported by several studies41, 51, 52. In this study, the
prevalence of neuropathy and cardiovascular complications in Non-Hispanic White adults with
diagnosed type 2 diabetes was much higher than the prevalence in Asian American even after
adjusting the possible demographic risk factors and BMI level. These findings coincide with the
lower incidence of all these diseases observed in Asian or Pacific Islander in other studies53, 54.
For year 2006, 2008, 2010 and 2012, the high blood pressure as well as the high blood
significant changes in both Asian and white. Comparison of other years’ data showed that the
neuropathy and cardiovascular disease complications were increased both in Asian and white.
There was research showed that the prevalence of coronary heart disease and high blood
cholesterol in Asian increase with the adoption of more Westernized lifestyle55, 56. The
subgroups, Pacific Islander and other Asian such as Japanese American had lower proportion of
recent immigrants. Six years data of feet sore complication showed that the feet sore rate in both
Asian and white was lower than 10% and there was no significant difference between these two
groups. Our finding is different from the study performed by Abbott where they concluded that
South Asians with diabetes in the U.K. have about one-third the risk of foot ulcers of
Europeans57.
The diabetes retinopathy rate in Asian was almost 10% higher than white. After adjusting
the demographic characteristics and obese status, Asian was almost 150% more likely to develop
diabetes retinopathy compare to white. Our finding was different from other research that Asian
American and African American has a similar prevalence of retinopathy to that in white58. But,
another report showed that the prevalence of retinopathy related with diabetes was twice in other
racial/ethnic backgrounds than in non-Hispanic white59. Our findings were from multiple year
data which have more power to illustrate the retinopathy issue. Further study need to perform to
examine the reason of the higher diabetes retinopathy rate in Asian. There was no apparent
increase or decrease trend over the 12 year period for both Asian and white implied that issue
persisted along 12 year period which need more attention to address.
Proper preventive diabetes management can reduce the diabetes mortality and morbidity.
Study using 2008-2012 BRFSS data showed us that there were racial disparity of health care
proved that Asian Americans were significantly less likely to check their blood sugar. These
differences remained unchanged even after adjusting possible demographic risk factors. Blood
sugar is the major factor to affect the process of diabetes. The reduced blood sugar check may
lead to worse diabetes outcome, such as diabetes retinopathy. The good parts found from this
study was both Asian and white had an increase trend of performing preventive health care over
12 year period. Results from previous study showed that the more cardiovascular disease the
person had, the more possibly to develop retinopathy which seems conflict with our finding
where Asian had less cardiovascular disease with higher rate of retinopathy. The possible reason
may be genetics difference. Our studies also showed that Asian population was more likely to
check their eyes compare to their white counterparts. One possibility is that the people who
suffered from diabetes retinopathy badly were more likely to check their eyes with doctors.
Those who have more cardiovascular disease complications were more likely to get severe
situation which makes them more to check blood sugar once a day, check HbA1C at least twice a
year and more likely to perform routine checkup. Results from this study showed that both Asian
and white had higher checkup rate with health care provider while the self-management rates
were lower. Half of the participants didn’t report self-management for blood sugar check as well
as the eyes and feet check. Some researchers found out that Asian were the least race to get
recommended diabetes screening which may contribute to the lower rate of blood sugar
self-checking61. In our study, we considered the complex survey design of BRFSS data and related
statistical test also was modified. The modified Chi-square test for categorical data was based the
method proposed by Rao62, 63, 64 which better accommodated the design and produced reliable
5 STUDY LIMITATIONS
Several limitations in this study need to be improved: first, all the variables included in
this study such as the type 2 diabetes status are based on self-reported results and there is no way
to verify by medical record review. Secondly, the sample size in Asian and white had a big
difference which may result some analysis bias. Even we considered the sampling design using
survey procedure in SAS, this sample size difference might still contribute some estimation
error. This error can be corrected in one way: draw random sample with similar sample size
from white population and analyze the data using the subgroup.
On the other hand, those individuals with severe physical disease, such as heart attack,
stroke might not have been able to complete the survey. Although a previous research showed
relatively high agreement of determining the diabetes status based on self-reports and those
based on clinical diagnoses (kappa=0.76; sensitivity=75%), bias may occur due to the
misclassification of diabetes and other variables status65.
Another limitation came from the BRFSS data collection which excludes people without
telephone and those with cell phone only before year 2011. The excluded people may be
minority in majority and they may have higher cardiovascular disease which may lower the
coverage of cardiovascular disease in Asian.
The last limitation may be from the questionnaire design. The questionnaire only include
English version and Spanish version. Some Asians especially older Asian can’t understand both
languages, which may reduce the Asian population with Diabetes. In the Kaiser study, Asian