Numerical Sand Prediction Model Analysis for Sand
Onset, Sand Volume and Sanding Rate.
Amiebenomo Hauwa Christiana
*, Prof Adewale Dosunmu
**, Prof Joel Ogbonna
**DEPARTMENT OF PETROLEUM ENGINEERING, FACULTY OF ENGINEERING
In Collaboration with World Bank Africa Centre of Excellence for Oilfield Chemical Research University of Port Harcourt
Port Harcourt, Nigeria.
DOI: 10.29322/IJSRP.9.08.2019.p9221 http://dx.doi.org/10.29322/IJSRP.9.08.2019.p9221
Abstract- Sand production occurs during the hydrocarbon production from a well when the reservoir sandstone is weak enough to fail under the in-situ stress conditions and the imposed stress changes due to the hydrocarbon production. A 3D Numerical Geomechanical Model of Greater Ughelli Depobelt in the Niger Delta was analysed by assessing the mechanical response to rock. This was done through the analysis and modelling of information from offset data. The developed model is capable of assessing the conditions that lead to the onset of sanding, the rate of sanding and the volume of sand that would be produced.
Index Terms- Critical wellbore pressure, uniaxial Compressive strength, Rock Failure, Mogi Criteria, Young Modulus, Shear stress.
I. INTRODUCTION
Mechanisms causing sand production are related to the formation strength, flow stability, viscous drag forces and pressure drop into the wellbore (Osisanya, 2010). The critical factors leading to accurate prediction of sand production potential and sand production are: formation strength, in-situ stress, and production rate. Other factors are reservoir depth, natural permeability, formation cementation, compressibility, surface exposed to flow, produced fluid types and phases, formation characteristics, pressure drawdown and reservoir pressure. Predicting sand production involves developing empirical and analytical. Numerical analytical techniques are also sometimes used. They are models developed from finite element analysis. The techniques above use production data, well logs, laboratory testing, acoustic, intrusive sand monitoring
devices, and analogy (Osisanya, 2010). Techniques. Empirical techniques relate sand production to some single parameter or group of parameters such as porosity, flow or drawdown, while analytical techniques relates to rock stresses.
II. IDENTIFY,RESEARCHANDCOLLECTIDEA
In developing this numerical model, the work will incorporate a computer model which will be used to carry out these analytical predictions based on input data considering hydrib approach with the assumption that the formation is heterogeneous, discontinuous and non-linear in nature. Geomechanical model determination for shear failure was carried out by using input and output data obtained from offset data. This data were used to obtain the maximum horizontal stress, fracture break down pressure, collapse pressure, maximum drawdown pressure, critical wellbore pressure, failure stresses and porosity at different depths. Some regressional plots for different criteria will be developed to show the effects of these stresses, porosity, drawdown, critical pressure, failure criteria and unconfined compressive strength (UCS) in predicting sand production at different well directions respectively.
III. EQUATIONS FOR NUMERICAL SAND PREDICTION MODEL DEVELOPMENT
For the purpose of this research, all equations used for the development of the software are based on 3D-Mogi
Coulomb failure Criterion.
Stress Regimes:
There are three stress regimes
inherent in wellbore; for this research work, the
stress regimes are used to determine the maximum
horizontal stresses while considering the biot’s
constant (as 0.5) at some point.
ISSN 2250-3153
𝜎
𝐻= 𝜎
ℎ+ 𝑘 ∗ (𝜎
𝑣− 𝜎
ℎ)
3.1
Reverse and strike slip faulting regime
𝜎
𝐻= 𝜎
ℎ+
𝜎ℎ𝜎𝑣
∗ (𝜎
𝑣− 𝜎
ℎ)
Cylindrical stress determinations:
𝜎𝑧= 𝜎𝑧′
𝜎𝑟𝜃= (𝜎𝑦′− 𝜎𝑥′)𝑠𝑖𝑛𝜃𝑐𝑜𝑠𝜃 + 𝜎𝑥′𝑦′(𝑐𝑜𝑠2𝜃 − 𝑠𝑖𝑛2𝜃)
𝜎𝑟𝑧= 𝜎𝑥′𝑧′𝑐𝑜𝑠𝜃 + 𝜎𝑦′𝑧′𝑠𝑖𝑛𝜃)
𝜎𝜃𝑧= 𝜎𝑦′𝑧′𝑐𝑜𝑠𝜃 + 𝜎𝑥′𝑧′𝑠𝑖𝑛𝜃)
Virgin stress determinations before excavation:
𝜎𝑥𝑦𝑜 = 0.5(𝜎ℎ− 𝜎𝐻)𝑠𝑖𝑛2𝛼 𝑐𝑜𝑠 𝑖
𝜎𝑦𝑧𝑜 = 0.5(𝜎ℎ− 𝜎𝐻)𝑠𝑖𝑛2𝛼 𝑠𝑖𝑛 𝑖
𝜎𝑥𝑧𝑜 = 0.5(𝜎𝐻𝑐𝑜𝑠2𝛼 + 𝜎ℎ𝑠𝑖𝑛2𝛼 − 𝜎𝑣)𝑠𝑖𝑛2𝑖
Virgin stress determinations after excavation:
𝜎𝑟𝜃= [(
𝜎𝑥𝑜−𝜎𝑦𝑜
2 ) (1 − 3
𝑎4 𝑟2+ 2
𝑎2
𝑟2) 𝑠𝑖𝑛2𝜃] + 𝜎𝑥𝑦𝑜 (1 − 3
𝑎4 𝑟2+
2𝑎2
𝑟2) 𝑐𝑜𝑠2𝜃
𝜎𝜃𝑧= (−𝜎𝑥𝑧𝑜𝑠𝑖𝑛2𝜃 + 𝜎𝑦𝑧𝑜𝑐𝑜𝑠𝜃)(1 +
𝑎2 𝑟2)
𝜎𝑟𝑧= (𝜎𝑥𝑧𝑜𝑐𝑜𝑠2𝜃 + 𝜎𝑦𝑧𝑜𝑠𝑖𝑛𝜃)(1 −
𝑎2 𝑟2)
Stresses around wellbore for a Deviated Well:
𝜎𝜃= 𝜎𝑥𝑜+ 𝜎𝑦𝑜− 2(𝜎𝑥𝑜− 𝜎𝑦𝑜)𝑐𝑜𝑠2𝜃 − 4𝜎𝑥𝑦𝑜 𝑠𝑖𝑛2𝜃 − 𝑃𝑤
𝜎𝑧= 𝜎𝑧𝑜− 𝑣 [2(𝜎𝑥𝑜− 𝜎𝑦𝑜)𝑐𝑜𝑠2𝜃 + 4𝜎𝑥𝑦𝑜 𝑠𝑖𝑛2𝜃]
𝜎𝜃𝑧= 2(−𝜎𝑥𝑧𝑜𝑠𝑖𝑛𝜃 + 𝜎𝑦𝑧𝑜𝑐𝑜𝑠𝜃)
Stresses around wellbore for a Vertical Well:
Deviatoric Stresses
𝑆1=
2𝜎1−𝜎2−𝜎3 3
𝑆
2=
2𝜎2−𝜎1−𝜎33
𝑆
3=
2𝜎3−𝜎1−𝜎2 3Principal Stresses
𝜎1= max (𝜎𝑝1, 𝜎𝑝2, 𝜎𝑟)
𝜎3= min (𝜎𝑝1, 𝜎𝑝2, 𝜎𝑟)
𝜎2=
𝜎1+𝜎3 2
Rock Failure
𝐹 =
𝑎 + 𝑏 (𝜎1+𝜎3
2 ) − 1 3⁄ √(𝜎1− 𝜎2)
2+ (𝜎
2− 𝜎3)2+ (𝜎3− 𝜎1)2
Where;
𝑎 =2√2
3 𝑐 𝑐𝑜𝑠𝜙
𝑏 =2√2
3 𝑠𝑖𝑛𝜙
if
𝑭 ≥
𝟎, 𝒔𝒕𝒂𝒃𝒍𝒆 𝒘𝒆𝒍𝒍 𝒘𝒊𝒕𝒉 𝒍𝒐𝒘 𝒓𝒊𝒔𝒌 𝒐𝒇 𝒔𝒂𝒏𝒅 𝒑𝒓𝒐𝒅𝒖𝒄𝒕𝒊𝒐𝒏
𝑭 <
0, 𝑈𝑛𝑠𝑡𝑎𝑏𝑙𝑒 𝑤𝑒𝑙𝑙 𝑤𝑖𝑡ℎ ℎ𝑖𝑔ℎ 𝑟𝑖𝑠𝑘 𝑜𝑓 𝑠𝑎𝑛𝑑 𝑝𝑟𝑜𝑑𝑢𝑐𝑡𝑖𝑜𝑛
Critical Wellbore Pressure
𝑷𝒄𝒘 =
1.5𝜎𝑥−0.5𝜎𝑦−0.5𝛼𝑃𝑜(1−2𝑣 1−𝑣)−1.732𝜏𝑖 1−0.5𝛼(1−2𝑣
1−𝑣)
𝑤ℎ𝑒𝑟𝑒; 𝜏𝑖=
0.025𝑈𝐶𝑆 106𝐶𝐵
𝑇𝑒𝑛𝑠𝑖𝑙𝑒 =2𝑐 cos 𝜙
1+𝑠𝑖𝑛𝜙
𝑃𝑜 = 𝜎𝑣− [(𝜎𝑣− 𝑃𝐻)(
𝛥𝜏𝑛 𝛥𝜏)
𝑷
𝒄𝒘< 0, 𝑤𝑒𝑙𝑙 𝑖𝑠 𝑛𝑜𝑡 𝑎𝑓𝑓𝑒𝑐𝑡𝑒𝑑 𝑏𝑦 𝑠𝑎𝑛𝑑 𝑝𝑟𝑜𝑑𝑢𝑐𝑡𝑖𝑜𝒏
𝑷
𝒄𝒘≥ 𝟎, 𝑤𝑒𝑙𝑙 𝑤𝑜𝑢𝑙𝑑 𝑏𝑒 𝑎𝑓𝑓𝑒𝑐𝑡𝑒𝑑 𝑏𝑦 𝑠𝑎𝑛𝑑 𝑝𝑟𝑜𝑑𝑢𝑐𝑡𝑖𝒐𝒏
Formation Strength (Rock’s compressive strength)
𝑈𝐶𝑆 = (0.0025 ∗ 𝑠ℎ𝑒𝑎𝑟 𝑠𝑡𝑟𝑒𝑛𝑔𝑡ℎ ∗ 𝑌𝑜𝑢𝑛𝑔𝑀𝑜𝑢𝑑𝑢𝑙𝑢𝑠
𝐶𝐵 ∗ 106
)
∗ 0.08 ∗ 𝑉𝑠ℎ + 0.0045 ∗ (1 − 𝑉𝑠ℎ)
𝑌𝑜𝑢𝑛𝑔𝑀𝑜𝑢𝑑𝑢𝑙𝑢𝑠 (𝐺) =9 ∗ 𝑃𝑏 ∗ 𝑠ℎ𝑒𝑎𝑟𝑀𝑜𝑑𝑢𝑙𝑢𝑠
3𝑃𝑏+ 𝑠ℎ𝑒𝑎𝑟𝑀𝑜𝑑𝑢𝑙𝑢𝑠
𝒔𝒉𝒆𝒂𝒓 𝒔𝒕𝒓𝒆𝒏𝒈𝒕𝒉 = 2𝑐𝑜𝑠𝜙
1−𝑠𝑖𝑛𝜙
𝒔𝒉𝒆𝒂𝒓𝑴𝒐𝒅𝒖𝒍𝒖𝒔 = 𝑃𝑏𝑡𝑠2B.
F 𝒓𝒊𝒄𝒕𝒊𝒐𝒏 𝒂𝒏𝒈𝒍𝒆 (𝝓) = 26.5 − 37.4(1 − 𝑁𝑃𝐻𝐼 − 𝑉𝑠ℎ) +
62.1(1 − 𝑁𝑃𝐻𝐼 − 𝑉𝑠ℎ)2
𝐶𝐵=
1 𝐾𝑏
𝐾𝑏 = 𝑃𝑏(𝑡𝑐2− 3 4⁄ 𝑡𝑠2)
𝑫𝒓𝒂𝒘𝒅𝒐𝒘𝒏 𝒇𝒂𝒊𝒍𝒖𝒓𝒆 = 𝛥𝑃
𝑈𝐶𝑆
𝑐 =𝑈𝐶𝑆(1−𝑠𝑖𝑛𝜙)
2𝑐𝑜𝑠𝜙
𝒊𝒇 𝑫𝒓𝒂𝒘𝒅𝒐𝒘𝒏 𝒇𝒂𝒊𝒍𝒖𝒓𝒆
≥ 𝟏. 𝟕, 𝒘𝒆𝒍𝒍 𝒊𝒔 𝒔𝒖𝒃𝒋𝒆𝒄𝒕 𝒕𝒐 𝒔𝒂𝒏𝒅 𝒑𝒓𝒐𝒅𝒖𝒄𝒕𝒊𝒐𝒏
𝒊𝒇 𝑫𝒓𝒂𝒘𝒅𝒐𝒘𝒏 𝒇𝒂𝒊𝒍𝒖𝒓𝒆
< 1.7, 𝑤𝑒𝑙𝑙 𝑖𝑠 𝑛𝑜𝑡 𝑠𝑢𝑏𝑗𝑒𝑐𝑡 𝑡𝑜 𝑠𝑎𝑛𝑑 𝑝𝑟𝑜𝑑𝑢𝑐𝑡𝑖𝑜𝑛
Analytical Model for Sand Volume Produced
𝑪𝒔𝒏𝒅=
−𝑁 + √𝑁2+ 16𝑃
𝑤𝜎𝐻
8𝜎𝐻
𝑽𝒔𝒏𝒅=
𝑝𝑖 4(
𝟏−𝑪𝒔𝒏𝒅 𝑪𝒔𝒏𝒅 )𝑊𝑟
2
𝒊𝒇 𝑪𝒔𝒏𝒅 𝒂𝒏𝒅 𝑽𝒔𝒏𝒅
> 0 𝑚𝑒𝑎𝑛𝑠 𝑤𝑒𝑙𝑙 𝑖𝑠 𝑠𝑢𝑏𝑗𝑒𝑐𝑡 𝑡𝑜 𝑠𝑎𝑛𝑑 𝑝𝑟𝑜𝑑𝑢𝑐𝑡𝑖𝑜𝑛
𝒊𝒇 𝑪𝒔𝒏𝒅 𝒂𝒏𝒅 𝑽𝒔𝒏𝒅
≤ 𝟎 𝒎𝒆𝒂𝒏𝒔 𝒘𝒆𝒍𝒍 𝒊𝒔 𝒏𝒐𝒕 𝒔𝒖𝒃𝒋𝒆𝒄𝒕 𝒕𝒐 𝒔𝒂𝒏𝒅 𝒑𝒓𝒐𝒅𝒖𝒄𝒕𝒊𝒐
IV. RESULTS ANALYSIS/DISCUSSION
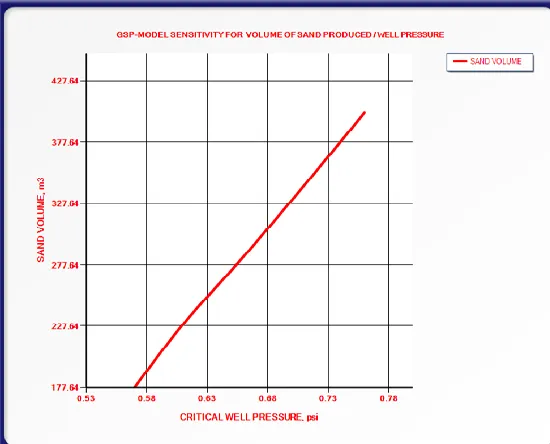
[image:3.612.315.590.285.507.2]The interface below shows the result of the Geomechanical sand prediction (GSP) model for each regressional plots Greater Ughelli and Costal Swamp Depobelt after it has been ran successfully.
Figure 1: Volume of sand plot
ISSN 2250-3153
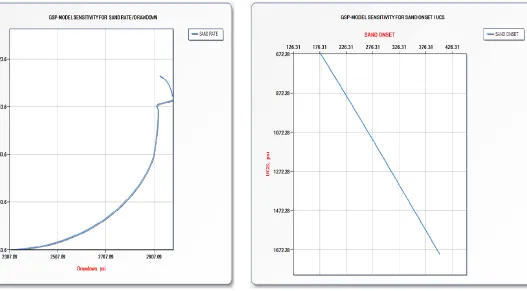
Figure 2: Sand Rate Plot
As expected higher drawdown results in production of higher percentage of sand, this is due to higher drag force separating the fluidized sand from the sand mass leading to sand production. The result on the pressure drawdown shows that for an excavated rock, the rate at which sand would be produced remains relatively constant over a period of time within a certain pressure range and then a considerable higher rate will be experienced when a higher drawdown pressure is applied. From figure 4.2 at a drawdown pressure of 2507psi, the sand production rate was 184.6.
Figure 3: Sand Onset Plot
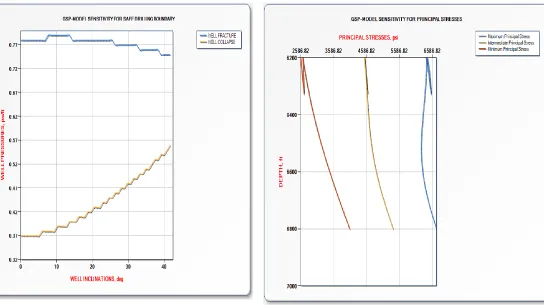
[image:4.612.37.311.57.346.2]Figure 4: Safe Drilling Boundary plot
[image:5.612.37.329.57.352.2]This shows that the required mud weight should be between the collapse pressure (lower bound) and the fracture pressure (upper bound). This is important to ensure a good wellbore stability and a safe drilling process. From figure 4.4 it is seen that at a well inclination of 20 degree, a mud window between 0.42 to 0.77psi/ft. Much work has be done in this area, for further knowledge, refer to Prof Adewale Dosunmu publications on Petroleum Geomechanics and Wellbore Stability.
Figure 5: Principal Stresses Plot
ISSN 2250-3153
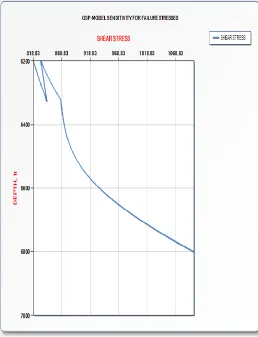
Figure 6: Stress Sensitivity Plot
As we go deeper into the formation, it becomes more compacted and consolidated, hence, requires more pressure/stress before the rock will fail as the grains are more tightly cemented together. From the plot, you will observe that at lower depth, it requires less shear stress for the rock to fail and more at higher depth. For example, at depth 6650ft, the rock gave way when a pressure of 968.83psia was applied whereas at 6800ft, it took a higher pressure of over 1060.83psia to shear the rock.
V. CONCLUSION
Every field, every well and every production plan is different and should be assessed case by case basis.
Integrating solids production assessment in the workflow of field development planning study is a rational safeguard against potential undesirable sand production interruption in the oil and gas industry which requires; geomechanics modeling, rock testing and production planning.
ACKNOWLEDGMENT
To my darling husband, Dr Njoku Chigozie, my rock and backbone. You always encouraged me to see the light at the end of the tunnel. The nights and days you spent alone while I had to travel down to school, your moral, emotional and financial support, as well as taking care of our home alone in my absence will ever be acknowledged. I love you so dearly.
.
REFERENCES
Al-Ajmi AM, Zimmerman RW (2005) Relation between the Mogi and the Coulomb failure criteria. Int J Rock Mech Min Sci 42:431–439.
Osisanya, S.O. 2010. Practical Guidelines for Predicting sand Production. Paper SPE 136980 presented at the 34th Annual SPE International Conference and Exhibition, Tinapa-Calabar, Nigeria. 31 July-7 August.
Nouri, A., Vaziri, H., Belhaj H., and Islam, R. 2004. “Sand Production Prediction: A New Set of Criteria for Modeling Based on Large-Scale Transient Experiments and Numerical Investigation”, Paper SPE 90273, presented at ATCE, Houston
Morita, N. and Boyd, P.A. 1991. Typical Sand Production Problems: Case Studies and Strategies for Sand Control. Paper SPE 22739 presented at the 66th Annual Technical Conference and Exhibition of the Society of Petroleum Engineers, Dallas, Texas. October 6-9.
I. Vardoulakis, E. Papamichos, J. Tronvoll, and A. Skjrstein, “Volumetric sand production model and experiment,” International Journal for Numerical and Analytical Methods in Geomechanics, vol. 25, no. 8, pp. 789–808, 1996. Assef Mohamad-Hussein and Qinglai Ni1 (2018). “Numerical modeling of onset and rate of sand production in perforated well”. Journal of Petroleum Exploration and Production Technology 13202-018-0443-6.
AUTHORS
First Author – Amiebenomo Hauwa Christiana, PhD in view,
University of Port Harcourt and [email protected]
Second Author – Prof Adewale Dosunmu, University of Port Harcourt and [email protected].
Third Author – Prof Joel Ogbonna, University of Port Harcourt and [email protected]
Correspondence Author – Amiebenomo Hauwa Christiana,