The Analysis about Behavior Intention of Customers on
Using Smartphone
Nicky Dian Nabilla Justiti*, Dr. Adhi Prasetyo, S.T., M.M.**
*
Undergraduate of International ICT Business, Telkom University
**
Faculty of Economics and Business, Telkom University
DOI: 10.29322/IJSRP.8.3.2018.p7551
http://dx.doi.org/10.29322/IJSRP.8.3.2018.p7551
Abstract- Smartphone is the telecommunications media that support the changing of technology development and the users growing very rapidly as the number of smartphone companies increasing. The differences on the list of company market leader in Indonesia and in the world shows the different criteria that required by smartphone users in Indonesia and in the world. Since customer’s needs and wants are different and always changing, the smartphone producers have to be sensitive to these changes and due to a very tight competition. The aim of this research is to test the factors inside modified UTAUT2 model; Performance Expectancy, Effort Expectancy, Social Influence, Facilitating Condition, Hedonic Motivation, Price Value, and Habit, that influence the Behavioral Intention and also whether age, gender and income are affecting the factors inside modified UTAUT2 model in the context of Smartphone in Indonesia.
This research is a quantitative with causal study. Likert scale used to measure each item in the questionnaire as main data collection tool. Structural Equation Modeling (SEM) with Partial Least Square (PLS) is the data analysis technic in this research, and SmartPLS 2.0 as the statistic tools.
The result shows that Habit, Performance Expectancy, the factors in modified UTAUT 2 model that influence the Behavioral Intention of customers on using smartphone in Indonesia are Performance Expectancy, Price Value, and Habit. And all moderate variables are proved not influence the construct in this research.
Index Terms- Behavior Intention, Smartphone, Technology Acceptance, modified UTAUT 2
I. INTRODUCTION
Smartphone is a combination cell phone and a handheld computer that created the greatest tech revolution since the Internet. A smartphone can do everything a personal computer can do, and because of its mobility, much more [1]. It contains functions such as instant messaging, downloading applications, utilizing information services such as Wi-Fi and global positioning system (GPS) and entertainment [2].
Smartphone users are currently growing very rapidly. Because of the great need for telecommunication’s devices, the number of companies that sell smartphones increases. This rapid growth of smartphone users is influenced by the increase of internet users. The needs of information, communication, entertainment and also health become the reasons why internet users in the world are increasing. They are competing to lure buyers with features and attractive offers which can meet customer’s requirements that always changing. Because customer needs and wants are always changing, the smartphone producers have to be sensitive to these changes. Not only because customer needs is always changing, but the smartphone producers also must keep sensitive to changes due to a very tight competition. Among the brands of smartphones, Apple and Samsung hold almost 40% of the world market in 2016[3].
Beside the brand of smartphone that become the market leader, the fact that Indonesia is the largest smartphone user in Southeast Asia also became my concern. Indonesia is the largest smartphone user in Southeast Asia, with 65.2 million units [4]. The most favorite brand in
Indonesia is Samsung, and followed by OPPO and ASUS [5]. The preference of Indonesian people in choosing smartphone is not the same as the average world smartphone users. So, Behavior of people on using smartphone in Indonesia is the concern of this study.
Intention is a key predictor of behavior in a wide range of health domains, intention considered as one of the most useful theories to study the cognitive determinants of behavior [6][7]. Measuring behavioral intentions of the customers on using smartphone can be the best way to predict future buying behavior [8].
UTAUT has distilled the critical factors and contingencies related to the prediction of behavioral intention to use a technology and technology used primarily in organizational contexts [9] [10]. UTAUT explained about 70 percent of the variance in behavioral intention to use a technology [10]. To match with the analysis about consumer or individual use of technology, Venkatesh et al. (2012) integrate hedonic motivation, price value, and habit into UTAUT and develop UTAUT2 [10].
Based on the research phenomenon, the research question as follows:
1) How big is the consumer’s assessment of factors based on the modified UTAUT 2 (Performance Expectancy, Effort Expectancy, Social Influence, Facilitating Condition, Hedonic Motivation, Price Value, and Habit) towards Behavior Intention of customers on using Smartphone in Indonesia?
3) Based on the modified UTAUT 2, what are the factors that influencing customer’s Behavior Intention in the context of Smartphone in Indonesia?
4) Do Age, Gender, and Income differences affect the influence of modified UTAUT 2 model factors towards Behavior Intention of customers in the context of Smartphone in Indonesia?
Can this proposed modified UTAUT 2 be used for predicting the Behavior Intention of Smartphone in Indonesia?
II. LITERATURE REVIEW
Marketing is a social process involving the activities necessary to enable individuals and organizations to obtain what they need and want through exchanges with other and to develop ongoing exchange relationship [11]. Basically, the objective of marketing is to get new customers with a promise to give value by creating the satisfaction [12].
Based on several definitions above, we can say that marketing is a searching activity where customer’s needs and wants can be fulfill by consume or use products or services, and the producer get the profit and value from that consuming result. If the marketer understands consumer needs; develops products that provide superior customer value; and prices, distributes, and promotes them effectively, these products will sell easily [12].
The field of customer behavior is the study of individuals, groups, or organization and the processes they use to select, secure, use and dispose of products, services, experiences, or ideas to satisfy needs and the impacts that these processes have an the customer and the society[13]. Consumer behavior is a complex, multidimensional process. Consumer decisions often involve numerous steps and are influenced by a host of factors including demographics, lifestyle, and cultural value [13].
In the Theory of Planned Behaviour of Ajzen in Amireault et al. (2008) [7], considered as one of the most useful theories to study the cognitive determinants of behaviour, intention is a key predictor of behaviour in a wide range of health domains [7]. According to Amireault et al. (2008) [7], Intention was found to be a significant determinant of behavior.
Intention was found to be a significant determinant of behavior [7]. Behavioral intention refers to the degree to which a person has formulated conscious plans to perform or not perform some specified future behavior(s) [14][15]. Many of the prior studies have still proven that the behavioral intention plays a significant role in actual behaviors [15][16].
UTAUT has distilled the critical factors and contingencies related to the prediction of behavioral intention to use a technology [10]. Venkatesh et al. (2012) also stated that, UTAUT explained about 70 percent of the variance in behavioral intention to use a technology [10].
The Unified Theory of Acceptance and Use of Technology (UTAUT) is a technology acceptance model that combines key elements of eight different technologies and behavioral models to evaluate the likelihood of successful integration of technology, the factors that determine the acceptability and appropriate interventions to facilitate better adoption with new initiatives [9]. In UTAUT there are 4 constructs that play a direct role in determining
Behavioral Intention, namely: Performance Expectancy, Effort Expectancy, Social Influence, and Facilitating Conditions [9]. UTAUT has distilled the critical factors and contingencies related to the prediction of behavioral intention to use a technology and technology used primarily in organizational contexts [10].
To match with the analysis about consumer or individual use of technology, Venkatesh et al. (2012) integrate Hedonic Motivation, Price Value, and Habit into UTAUT and develop UTAUT2[10]. UTAUT2 appears to adapt to the acceptance and use of ICT by consumers in a particular market, it integrates three new constructs and new relationships (transforming the seven constructs from a consumer perspective rather than defining from the perspective of employees of an organization) [10].
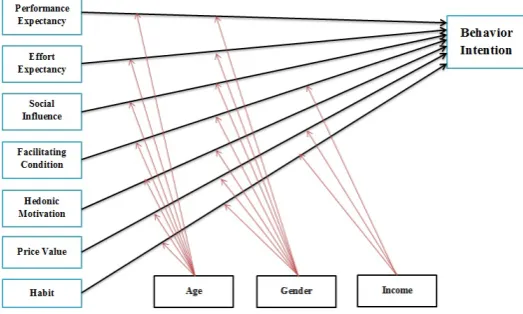
[image:2.595.316.578.410.567.2]The model in this study is adopting modified UTAUT2 model by Indrawati and Haryoto (2015) [17], and modified by author. For the more, author modified this model by eliminating variable Content. The object of study conducted by Indrawati and Haryoto (2015) is TV Streaming [17], while the object of this study is Smartphone. So, the variable Content is not suitable for this study. Author also adding variable Habit that adopting from the original UTAUT2 model proposed by Venkatesh et al. (2012) [10]. Variable Habit added because the population of this study is Indonesian people that already used the smartphone, which mean the population have experience in using smartphone. Habit is a perceptual construct that reflects the results of prior experiences [10], so author would like to add Habit variable to this research framework.
Figure 2.1 Proposed Modified UTAUT2 Model Source: Processed by author
III. METHODOLOGY
Equation Model with Partial Least Square (SEM-PLS) with the help of SmartPLS 2.0 software.
IV. RESULTS AND DISCUSSION
4.1 Descriptive Analysis
[image:3.595.315.560.49.314.2]Descriptive statistics are statistics used to analyze data by way of describing or describing data that has been collected as is without intending to make conclusions that apply to the public or generalization [18]. Descriptive analysis in this study aimed to get the percentage of each variable so that the important variable related to the search problems can be seen. The researcher then develops the assessment criteria for each question and gets the result for continuum as shown by the Figure 4.1.
Figure 4.1 Continuum Line
Descriptive analysis can be described as the respondent’s answers about the variables of the research by conducting the measurement through questionnaires. In the study there are 7 independent variables and 1 dependent variable. Based on the results of the calculations, the results show that three namely variables Performance Expectancy with 87.7%, Effort Expectancy with 87.1%, and Hedonic Motivation with 86.6% are categorized as "Very High" category and five variables namely Facilitating Condition with 82.4%, Habit with 80.8%, Behavior Intention with 80.4%, Social Influence with 78.4%, and Price Value 72.5% are in the "High" category.
4.2 Data Analysis
The data analytical analysis in this study use Structural Equation Model with Partial Least Square approach and the help of software SmartPLS 2.0. PLS-SEM analysis usually consists of two sub models, those are measurement models or often called as outer models and structural models or often called as inner model.
4.2.1 Outer Model
The Outer Model is used to determine the validity and reliability of connecting reflective indicators with latent variables tested using three methods of measurement: convergent validity, discriminant validity and composite reliability conducted on all data from 120 respondents. 1) Convergent Validity
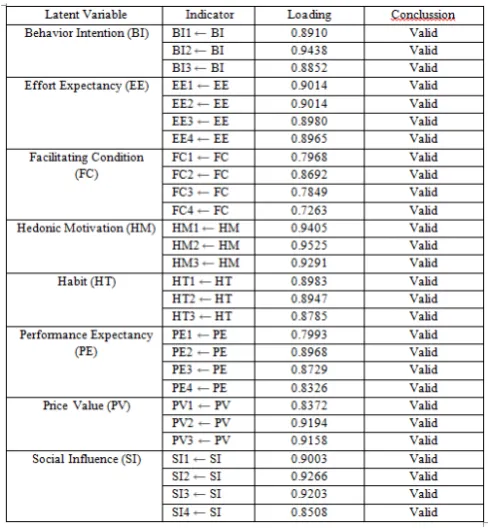
Convergent validity test in this research based on the criteria of factor loading value and Average Variance Extracted (AVE), where value for factor loading > 0.5, and AVE > 0.5. The result of loading factor in convergent validity can be seen in Table 4.1.
Table 4.1 Loading Factor Result
Source: SmartPLS 2.0 Result Processed by the Author Based on Table 4.1 the test results show that the value of all items has a loading factor value greater than 0.5. So it can be concluded that all indicators of the variable constructs are valid.
[image:3.595.58.262.224.270.2]The next test in convergent validity is calculating the AVE value of each latent variable. AVE results on convergent validity can be seen in Table 4.2.
Table 4.2 AVE Result
Source: SmartPLS 2.0 Result Processed by the Author According to Table 4.2, the value of AVE in each latent variable is greater than 0.5, which means it can be declared as valid and meets the criteria of convergent validity.
2) Discriminant Validity
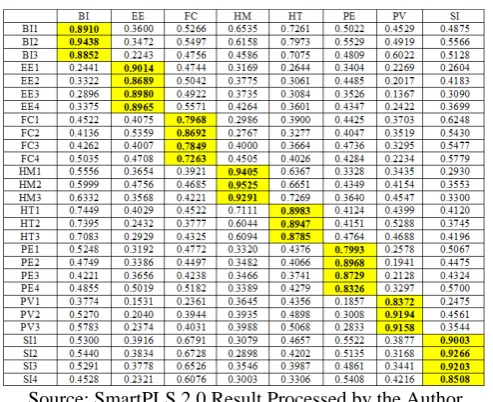
To test whether unrelated constructs do not have a corresponding relationship, then discriminatory validity is done. In this study, discriminant validity is tested using Cross Loading method by using smartPLS 2.0 with the criterion of the correlation value of cross loading factor with its latent variables must be greater than correlation to other latent variables. The result of loading factor in convergent validity can be seen in Table 4.3.
[image:3.595.317.559.442.588.2]Source: SmartPLS 2.0 Result Processed by the Author Based on Table 4.3, it can be seen that the value of cross loading of all indicators on its own construct has a greater value than the loading factor of the indicator in other constructs. So it is concluded that the all unrelated constructs are not related and meet discriminant validity criteria.
3) Composite Reliability
[image:4.595.35.282.46.247.2]Reliability is performed by the composite reliability method seen from Cronbach's Alpha (CA) and Composite Reliability (CR) values with CA> 0.7 and CR> 0.7. Composite Reliability is done with the help of SmartPLS 2.0, and the results can be seen in Table 4.4.
Table 4.4 Composite Reliability Result
Source: SmartPLS 2.0 Result Processed by the Author Based on Table 4.4, the value of Composite Reliability (CR) of each variable is greater than 0.6 and Cronbach’s Alpha (CA) of each variable is greater than 0.7. Thus, it can be concluded that all variables are considered reliable to be included in hypothesis testing.
4.2.2 Inner Model
After testing outer model, next Inner Model testing is done in PLS. The Inner Model defines the specification of the relationship between a latent construct and another latent construct. The model test is done by observing the value of R2 on the variable latent endogen and the significance test of the construct using the path coefficient (t-value) in each path.
1) R-square Test (R2)
R-square test is used to measure the level of variation of dependent variable changes to independent variables. The higher the R-square values are, the better the model can predict the object of research.
From result of data processing using SmartPLS 2.0, the R-Square value in this research is shown in Table 4.5
Table 4.5 R-Square Result
Source: SmartPLS 2.0 Result Processed by the Author Table 4.5 is shown that the R2 value for the dependent variable (endogenous latent variable). The R2 score of Behavioral Intention is 0.7542, which conclude this research model is fall under “Substansial” category. It means that the dependent variable, Behavior Intention, is 75.42% influenced by the independent variables of this research, Performance Expectancy, Effort Expectancy, Social Influence, Facilitating Condition, Hedonic Motivation, Price Value, and Habit, and the rest 24.58%is influenced by other variables that did not examined in this research.
2) T-value Testing
[image:4.595.38.282.445.574.2] [image:4.595.315.562.464.567.2]In this study, author using a right one-tailed test with an error rate of 5%. From statistical Table data known t Table for alfa = 0.05 is 1.65. Based on the research processed model, the result of t-value is summarized in Table 4.6
Table 4.6 Path Coefficient and T-value
Source: SmartPLS 2.0 Result Processed by the Author
Based on Table 4.6, the result can be summarized: a. Performance Expectancy (PE)
Performance Expectancy has a positive influence towards Behavioral Intention of customers on using smartphone in Indonesia and consistent with result of technology adoption research which have been done before by Marhaeni (2014) [19] and Indrawati & Haryoto (2015) [17].
b. Effort Expectancy (EE)
Effort Expectancy has no positive influence towards Behavioral Intention of customers on using smartphone in Indonesia and consistent with result of technology adoption research which have been done before by Marhaeni (2014) [19] and Indrawati & Haryoto (2015)
[17]
.
Social Influence has no positive influence towards Behavioral Intention of customers on using smartphone in Indonesia and consistent with result of technology adoption research which have been done before by Jun et al. (2015) [20].
d. Facilitating Conditions (FC)
Facilitating Conditions has no positive influence towards Behavioral Intention of customers on using smartphone in Indonesia and consistent with result of technology adoption research which have been done before by Venkatesh (2003) [9] and Indrawati & Haryoto (2015) [17].
e. Hedonic Motivation (HM)
Hedonic Motivation has no positive influence towards Behavioral Intention of customers on using smartphone in Indonesia and consistent with result of technology adoption research which have been done before by Harsono & Suryana (2014) [21].
f. Price Value (PV)
Price Value has a positive influence towards Behavioral Intention of customers on using smartphone in Indonesia and consistent with result of technology adoption research which have been done before by Marhaeni (2014) [19], Jun et al. (2015) [20] and Indrawati & Haryoto (2015) [17].
g. Habit (HT)
Habit has a positive influence towards Behavioral Intention of customers on using smartphone in Indonesia and consistent with result of technology adoption research which have been done before by Marhaeni (2014) [19] and Jun et al. (2015) [20].
4.2.3 Moderate Variable Analysis
In this research model there are three moderate variables that influence independent variables to dependent variable that is age, gender, and income. To test the influence of each of the moderate variables on the influence of independent variables to the dependent variable, multigroup analysis is done through the bootstrapping process with the help of SmartPLS and compare using Chin Formula [22].
Where,
Path sample 1 = the path of group 1 Path sample 2 = the path of group 2
SE sample 1 = standard error value of group 1 SE sample 2 = standard error value of group 2
a) Moderated effect of Age
From the test results of each group on the moderate variable "Age", conducted using Chin formula with the results shown in Table 4.7.
Table 4.7 Moderate Variable of Age T-value Result
Source: SmartPLS 2.0 Result Processed by the Author
The results of the moderate variables "Age" hypothesis on the influence between Performance
Expectancy, Price Value, and Habit on Behavioral Intention show a relationship that is not moderated by age
b) Moderated effect of Gender
From the test results of each group on the moderate variable "Gender", conducted Chin formula with the results shown in Table 4.8.
Table 4.8 Moderate Variable of Gender T-value Result
Source: SmartPLS 2.0 Result Processed by the Author
In Table 4.8, the results of the moderate variables "Gender" hypothesis on the influence of Performance Expectancy, Price Value, and Habit on Behavioral Intention show a relationship that is not moderated by gender.
c) Moderated effect of Income
From the test results of each group on the moderate variable "Income", conducted using Chin formula test with the results shown in Table 4.9
Table 4.9 Moderate Variable of Income T-value Result
Source: SmartPLS 2.0 Result Processed by the Author
In Table 4.9, the results of the moderate variables "Income" hypothesis on the influence of Price Value and Habit on Behavioral Intention show a relationship that is not moderated by income.
V. CONCLUSIONS AND SUGESTIONS
5.1 Conclusions
1. Based on modified UTAUT2 model, the variables affecting Behavioral Intention on using Smartphone in Indonesia are Habit, Performance Expectancy, and Price Value (listed from greatest influence).
2. Based on the results of this study, the moderating variables, such as Age, Gender, and Income difference proved to have no moderate effect on all constructs’ influence on Behavioral intention. 3. Factors that influencing the Behavioral Intention on
the customers Behavioral Intention on using smartphone in Indonesia are:
a. Habit with the highest t-value score, 6.9391 b. Performance Expectancy with the t-value score
is 1.8848
c. Price Value with the t-value score is 1.8582 4. Based on the demographic factors, There are no
variables’ influence on Behavior Intention that moderated by the moderating variables.
5.2 Suggestions
5.2.1 Suggestions for Company
1. Based on the effects generated by Habit, the smartphone company should show customers the benefits of smartphone for customer’s daily life by making advertisements that contain of benefits on using smartphone itself.
2. Based on the effects generated by Performance Expectancy, smartphone company should provide features that can increase the users’ productivity. 3. Based on the effects generated by Price Value,
company should conducting product development oriented to customer needs. So, the customers can feel that the money that they spend is equal to the product that they get.
5.2.2 Suggestions for Future Research
1. For further research, it is necessary to explore the continuity of usage (use behavior) of smartphone. 2. This study has proven that Habit, Performance
Expectancy, and Price Value has positive impact on the Behavioral Intentions on using smartphone. The further research is expected to find other variables that might influence the use behavior of smartphone.
3. The result of this study shows that the moderating variables have no influence, so the further research find another moderating variables that might have influence to the study.
4. This study was conducted in Indonesia. So the further research can focus in the areas or cities with the high number of smartphone users.
REFERENCES
[1] pcmag.com. (1981-2016). Encyclopedia. Definition of smartphone. Retrieved march 7, 2017, from www.pcmag.com:
http://www.pcmag.com/encyclopedia/term/51537/s martphone
[2] Ting, D. H., Lim, S. F., Patanmacia, T. S., Low, C. G., & Ker, G. C. (2011). Dependency on Smartphone and the Impact on Purchase Behavior.
Emerald Insight, 193.
[3] IDC.com. (2017, 05). Smartphone Vendor Market Share, 2017 Q1. Retrieved 10 02, 2017, from www.idc.com:
https://www.idc.com/promo/smartphone-market-share/vendor
[4] katadata.co.id. (2016, 08 08). Proyeksi Pengguna Smartphone di Asia Tenggara 2016 - 2019. Retrieved 09 25, 2017, from http://databoks.katadata.co.id:
http://databoks.katadata.co.id/datapublish/2016/08/ 08/proyeksi-pengguna-smartphone-di-asia-tenggara-2016-2019
[5] IDC.com. (2016, 12 16). Samsung Maintains its Market Dominance followed by OPPO and ASUS in Indonesia. Retrieved 09 25, 2017, from www.idc.com:
https://www.idc.com/getdoc.jsp?containerId=prAP 42177316
[6] Ajzen, I. (1991). The Theory of Planned Behavior.
ORGANIZATIONAL BEHAVIOR AND HUMAN DECISION PROCESSES 50, 179-211.
[7] Amireault, S., Godin, G., Vohl, M.-C., & Pérusse, L. (2008). Moderators of the Intention-Behaviour and Perceived Behavioural Control-Behaviour Relationships for Leisure-Time Physical Activity.
International Journal of Behavioral Nutrition and Physical Activity, 2-9
[8] Zeithaml, V. A., Berry, L. L., & Parasuraman, A. (1996). The Behavioral Consequences of Service Quality. ResearchGate, 32.
[9] Venkatesh, V., Moris, M. G., Davis, G. B., & Davis, F. D. (2003). User Acceptance of Information Technology: Toward a Unified View.
MIS quarterly.
[10] Venkatesh, V., Thong, J. Y., & Xu, X. (2012). Consumer Acceptance and Use of Information Technology: Extending the Unified Theory of Acceptance and Use of Technology. MIS Quarterly.
[11] Mullins, J., & Walker, O. C. (2012). Marketing Management: A Strategic Decision-Marketing Approach. McGraw-Hill Education.
[12] Kotler, P., & Armstrong, G. (2014). Principles of Marketing. Pearson Education.
[13] Hawkins, D. I., & Mothersbaugh, D. L. (2013).
Consumer Behavior: Building Marketing Strategy.
McGraw-Hill Irwin.
[14] Aarts, H., Verplanken, B., & Knippenberg, A. V. (1998). Predicting Behavior from Actions in the Past: Repeated Decision Making or a Matter of Habit? of Applied Social Psychology, vol. 28,no. 15, 1355–1374.
[15] Chi, Y. H., & Yu, S. K. (2014). UTAUT2 Based Predictions of Factors Influencing the Technology Acceptance of Phablets by DNP. Hindawi, 1-7. [16] Burke, R. R. (2002). Technology and the Customer
Interface: What Consumers Want in the Physical and Virtual Store. Journal of the Academy of Marketing Science, vol. 30, no. 4, 411–432.
[17] Indrawati, & Haryoto, K. S. (2015). The use of Modified Theory of Acceptance and use of Technology 2 to Predict Prospective Users Intention in Adopting TV Streaming.
[18] Sugiyono. (2014). METODE PENELITIAN KUANTITATIF, KUALITATIF DAN R&D.
Bandung: Alfabeta.
[19] Marhaeni, G. M. (2014). ANALISIS PERILAKU PENGGUNAAN APLIKASI PESAN INSTAN DENGAN MENGGUNAKAN MODEL UNIFIED THEORY OF ACCEPTANCE AND USE OF TECHNOLOGY 2 DI KOTA BANDUNG. e-Proceeding of Management.
[20] Jun, J. H., Voon, H. L., Keng, B. O., & June, W. (2015). What Catalyses Mobile Apps Usage Intention: an Empirical Analysis. Emerald Insight, 1269-1291.
[22] Chin, W. W., (2000). Frequently Asked Questions – Partial Least Squares & PLS-Graph. Home Page.[On-line]. Available: http://disc-nt.cba.uh.edu/chin/plsfaq.htm
AUTHORS
First Author – Nicky Dian Nabilla Justiti, Undergraduate, International ICT Business, Telkom University, Indonesia. Email:[email protected]/nickydiannabillajustiti@stud ent.telkomuniversity.ac.id
SecondAuthor –Dr. Adhi Prasetyo, S.T., M.M. Department
of ICT Business Management, Faculty of Economics and Business, Telkom University, Indonesia
Email: [email protected].
Correspondence Author - Nicky Dian Nabilla Justiti, Undergraduate, International ICT Business, Telkom University, Indonesia.
Email:[email protected]/nickydiannabillajustiti@stud ent.telkomuniversity.ac.id