Chemistry Theses Department of Chemistry
12-14-2016
An Investigation of the DNA Interactions of
Polyamine Anthracene Conjugates under High
Ionic Conditions
Khoa Nguyen
Follow this and additional works at:https://scholarworks.gsu.edu/chemistry_theses
This Thesis is brought to you for free and open access by the Department of Chemistry at ScholarWorks @ Georgia State University. It has been accepted for inclusion in Chemistry Theses by an authorized administrator of ScholarWorks @ Georgia State University. For more information, please [email protected].
Recommended Citation
Nguyen, Khoa, "An Investigation of the DNA Interactions of Polyamine Anthracene Conjugates under High Ionic Conditions." Thesis, Georgia State University, 2016.
CONJUGATES UNDER HIGH IONIC CONDITIONS
by
KHOA T. NGUYEN
Under the Direction of Kathryn B. Grant, Ph.D.
ABSTRACT
Six polyamine anthracene conjugates (Ants) were studied that take advantage of the
polyamine transporter system (PTS) to target specific cancer. The structural features of the Ants
involve planar aromatic anthracene that has highly cytotoxicity properties and a polyamine chain
similar to natural polyamine, which is taken up by eukaryote cells expressing the PTS actively.
Experimental data show that Ants with di-substituted polyamine chains have significantly higher
DNA binding affinities than the mono-substituted anthracene conjugates. The high ionic
conditions (~150 mM NaCl and 260 mM KCl) in the eukaryote cell nucleus extensively impair
the apparent DNA binding of the Ants, but may further reinforce DNA structural stability.
Combining the published cytotoxicity of the PTS data with the DNA interaction data reported
here, the di-substituted polyamine anthracene conjugates have the highest potential to, after
cellular uptake via PTS, bind to DNA.
INDEX WORDS: polyamine anthracene conjugate (Ant), polyamine, polycyclic aromatic
CONJUGATES UNDER HIGH IONIC CONDITIONS
by
KHOA T. NGUYEN
A Thesis Submitted in Partial Fulfillment of the Requirements for the Degree of
Master of Science
in the College of Arts and Sciences
Georgia State University
Copyright by Khoa T. Nguyen
POLYAMINE ANTHRACENE CONJUGATES UNDER HIGH IONIC CONDITIONS
by
KHOA T. NGUYEN
Committee Chair: Kathryn B. Grant
Committee: Dabney Dixon
Donald Hamelberg
Electronic Version Approved:
Office of Graduate Studies
College of Arts and Sciences
Georgia State University
DEDICATION
ACKNOWLEDGEMENTS
The author would like to thank Mr. Kyle Schutner for running the gel shift analysis assay,
our collaborators, Dr. Jennifer Archer and Dr. Otto Phanstiel IV for the synthesis of the
polyamine anthracene conjugates and for providing the cytotoxicity data. The research is
supported by the NSF, the Louis Stokes Alliances for Minority Participation, the GSU Molecular
Basis of Disease Program, and the GSU Netzel Scholarship Program.
To Dr. Grant, thank you for your advice and patience during these long years.
To my lab mates, Andy, Arash, Carla, Christina, Dominique, Kanchan, Kaitlyn, Tayabeh,
Stephen, Sadegh, and Ziyi, thank you for your help and support, as well as advice on cooking.
To Brandford Adobaw, without your advice and the drive to do research, I would have
lost my way.
To my committee members, thank you for your valuable time and advice in attending my
TABLE OF CONTENTS
ACKNOWLEDGEMENTS ... v
LIST OF TABLES ... viii
LIST OF FIGURES ... ix
1 INTRODUCTION... 1
1.1 Polyamines and polycyclic aromatic hydrocarbons ... 1
1.1.1 Cancer ... 1
1.1.2 Polycyclic aromatic hydrocarbons ... 1
1.1.3 Uptake of the polyamine compounds ... 2
1.2 Polyamine anthracene conjugates ... 3
1.2.1 Design rationale ... 3
1.2.2 Polyamine transporter system activity ... 3
1.2.3 Possible intracellular interactions of polyamine anthracene conjugates ... 5
1.2.4 Ions in the eukaryotic nucleus ... 6
1.2.5 Study of the interaction between DNA and polyamine anthracene conjugates under high ionic conditions ... 6
2 EXPERIMENT ... 8
2.1 Materials and instruments ... 8
2.2 Methods ... 8
2.2.2 Circular dichroism ... 9
2.2.3 DNA binding affinity of the ethidium bromide ... 9
2.2.4 Ascertaining DNA binding affinity of Ants via UV-visible titration ... 10
2.2.5 Ethidium bromide displacement via fluorescence microplate assay ... 12
2.2.6 Discerning the effects of the Ants on DNA migration via gel shift assay ... 12
3 RESULTS and DISCUSSION ... 13
3.1 DNA unwinding by polyamine anthracene conjugates ... 13
3.2 DNA binding affinity of ethidium bromide ... 16
3.3 UV-visible spectral analysis and DNA binding constant determination of the Ants ... 18
3.4 Apparent DNA binding affinities of the polyamine anthracene conjugates ... 22
3.5 The effect of Ants on the migration of DNA bands in agarose gels ... 24
4 CONCLUSIONS ... 26
REFERENCES ... 28
APPENDICES ... 31
Appendix A: CD, ICD, and UV-visible spectra ... 31
LIST OF TABLES
Table 1. The cytotoxicity of the polyamine anthracene conjugates in the absence and
presence of the polyamine transporter system (PTS) without and with polyamine
oxidase inhibitor ... 5
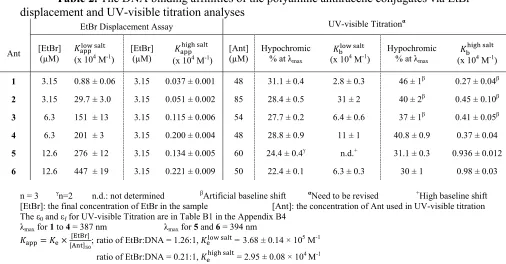
Table 2. The DNA binding affinities of the polyamine anthracene conjugates via EtBr
displacement and UV-visible titration analyses ... 22
LIST OF FIGURES
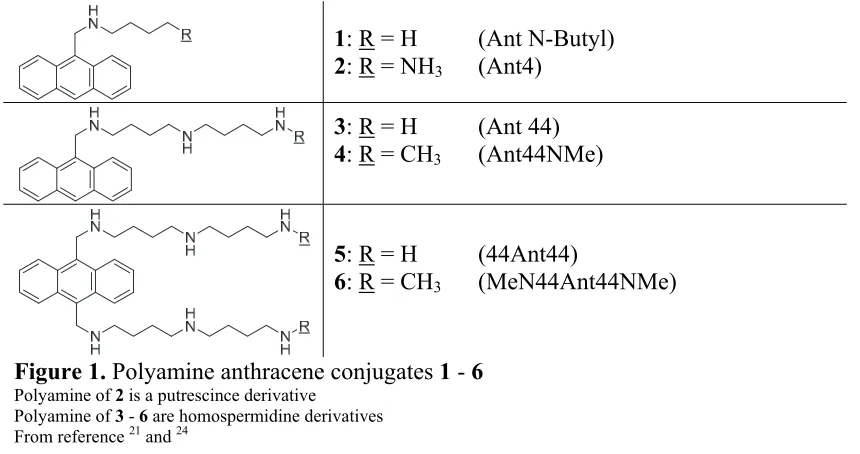
Figure 1. Polyamine anthracene conjugates 1 - 6... 3
Figure 2. CD and ICD spectra of 1-4, 6 ... 15
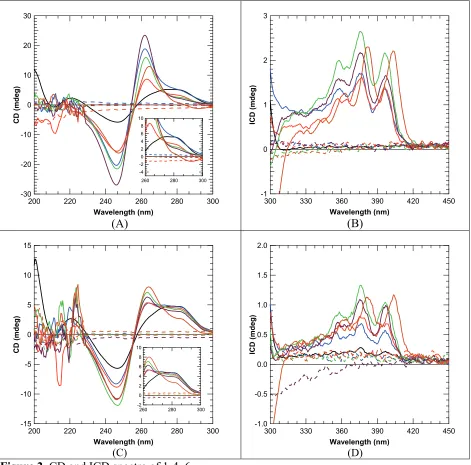
Figure 3. UV-visible titration of EtBr with increasing DNA concentrations ... 16
Figure 4. Xiaogang analysis of DNA binding constant via the UV-visible titration of EtBr with DNA ... 18
Figure 5. Representative UV-visible titration (2) ... 19
Figure 6. The Xiaogang DNA binding constant analysis (2) ... 20
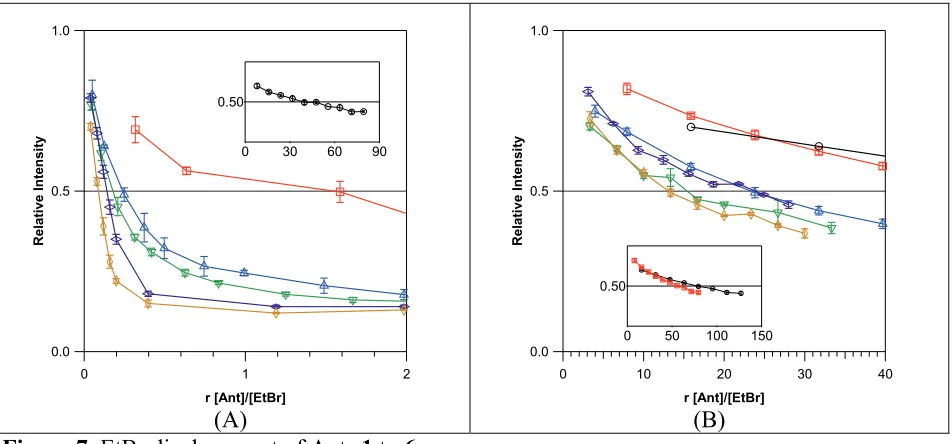
Figure 7. EtBr displacement of Ants 1 to 6 ... 23
Figure 8. Effect of increasing concentrations of 1 and 2 on the relative gel mobilities of DNA ... 25
Figure 9. Effect of increasing concentrations of 3 and 4 on the relative gel mobilities of DNA ... 25
1 INTRODUCTION
1.1 Polyamines and polycyclic aromatic hydrocarbons
1.1.1 Cancer
An uncontrollable growth of defective tumor cells is referred to as cancer. Many
functional receptors, such as the ones responsible for cell growth regulation, are missing; the lack
of these receptors results in the absence of cell apoptosis, or programmed cell death.1 These
cancer cells can inhibit healthy cells and organs from performing their normal functions. If left
untreated, the cells of the growing tumor can detach, spread, and grow in other parts of the body,
which is known as metastasis.1 Treatments are available to combat the growth of cancer cells,
such as surgery, radiation therapy, immunotherapy, and chemotherapy. The approach to
treatment depends on the doctor and patient.1, 2, 3 The uncontrollable growth requires a significant
amount of nutrients for the cancer cells; the design for anti-cancer drugs has taken advantage of
this increased uptake to be included in their drug delivery strategies.
1.1.2 Polycyclic aromatic hydrocarbons
As the name implies, polycyclic aromatic hydrocarbons (PAHs) consist of multiple fused
aromatic hydrocarbon rings. PAHs are byproducts from coal tars, cigarette smoke, car exhaust,
etc. and are considered pollutants.4, 5 Furthermore, PAHs are toxic and a health hazard due to
their carcinogenic, mutagenic, and teratogenic activities even at low levels.5, 6, 7 The earliest
report about the carcinogenic characteristics of PAHs was on chimney sweepers circa 1775,
whose jobs required constant contact with smokes and ashes; they later developed skin and
scrotum cancer.8 PAHs can form DNA adducts by creating a wedge between two DNA base
metabolites, such as the diol-epoxides.10 These diol-epoxide PAHs can covalently bind to the
purine bases, adenine and guanine, to form a stable DNA adduct.11 The structural perturbation of
the DNA helix caused by the DNA adducts can prevent the binding of polymerases, which can
interfere with transcription and replication. Furthermore, PAHs can redox cycle to produce
reactive oxygen species (ROS) that can induce oxidative stress.11 Anthraquinone, an oxidative
derivative of the PAH anthracene, acts as a DNA replication and transcription inhibitor by
binding tightly to the DNA duplex.12, 13 Many PAHs can be derived and utilized in medicinal and
the industrial fields. For example, anthracene and its derivatives are employed as fluorescence
materials,14 precursors for dye,15 and anti-cancer agents.16, 17, 18 An example is mitoxantrone, an
anthraquinone and an FDA-approved anti-cancer drug.19
1.1.3 Uptake of the polyamine compounds
Polyamines are involved in multiple cellular processes, including cell growth and cell
replication. Thus, cells have developed mechanisms to control the uptake of these compounds.20,
21 Polyamines, such as spermine, are protonated under physiological conditions and can
contribute to an active interaction with the negative phosphodiester backbone of DNA. 20, 21, 22
The polyamine transporter system (PTS) has been shown to allow polyamines and compounds
that incorporate polyamines to enter cells.21, 23, 24, 25 The PTS is expressed in high levels in cancer
cells, such as those associated with the lung and the lymph nodes.21, 23, 24, 25 Therefore,
introducing compounds incorporated with polyamine chains might be able to target the cancer
cells that express the PTS. Numerous research studies have attempted to optimize the
composition of polyamines to stimulate cellular uptake; to date, there is no definite correlation
between the polyamine composition and the cellular uptake rates.21, 24, 25 In E. coli, it is found
spermidine. As such, incorporation of these polyamines into the drugs may provide a model of
drug-delivery.26
1.2 Polyamine anthracene conjugates
1.2.1 Design rationale
Polyamine anthracene conjugates, or Ants, are synthesized to be the target-specific agents
of cells expressing a high level of PTS (Figure 1). The Ants have the anthracene core with the
polyamine side chain(s) at the 9 or both the 9 and 10 positions. The design strategy aims to take
advantage of the PTS to deliver the toxin into cells. Many polyamine derivatives with different
PAH cores have been synthesized as molecular probes for DNA, proteins, and the polyamine
transporter system.20, 22, 24, 27 The composition of the polyamine side chain of Ants is based on
putrescince and homospermidine; the design favors uptake via the polyamine transporter system.
1: R = H (Ant N-Butyl)
2: R = NH3 (Ant4)
3: R = H (Ant 44)
4: R = CH3 (Ant44NMe)
5: R = H (44Ant44)
6: R = CH3 (MeN44Ant44NMe)
Figure 1. Polyamine anthracene conjugates 1 - 6 Polyamine of 2 is a putrescince derivative
Polyamine of 3 - 6 are homospermidine derivatives From reference 21 and 24
1.2.2 Polyamine transporter system activity
Dr. Otto Phanstiel and his team at the University of Central Florida are investigating
[image:14.612.65.495.396.623.2]conjugates (Ant). The selective uptake of the Ants by cancer cells would enhance their efficacy
as anti-cancer agents. Cells can uptake Ants via the PTS, passive diffusion, and other alternative
pathways. The Chinese hamster ovary (CHO) cells express a high level of the polyamine
transporter system, similar to the cancer cells of the lung and lymph nodes; this characteristic
makes CHO a good tool to study the delivery efficiency via cytotoxicity studies.28 If the half
maximal inhibitory concentration (IC50) is low, the compound is highly cytotoxic. By comparing
the cytotoxicity levels in a mutated cell line with suppressed PTS genes (CHO-MG) versus the
wild type (CHO-WT), the PTS selectivity of the Ants can be determined. Currently, the
cytotoxicity in the absence and presence of PTS is high for compounds under investigation with
the exception of 6. Compound 6 is not toxic in the absence of the PTS as shown in Table 1;
however, the relatively small IC50 value signifies that the compound is extremely toxic in the
presence of the PTS. The IC50 ratio of 6 is desirable due to the high possibility that the
cytotoxicity is caused by PTS-assisted transport into the cell and subsequently intracellular
interaction with macromolecules, a characteristic of the target-specific anti-cancer agent delivery
design.6 Further investigation by Phanstiel and co-workers suggests that polyamine oxidase is
preventing the uptake of the Ants via PTS.24 Polyamine oxidase metabolizes primary polyamine
derivatives; once oxidized, the polyamine cannot be recognized by the PTS, leading to a similar
cytotoxicity between the two cell lines. When aminoguanidine is used to inhibit the enzymes, the
PTS system does not show selectivity between the two analogs (i.e., 5 and 6) as shown in Table
1. The difference between these two compounds is methylation converts the terminal primary
amine to a secondary amine, which protects the polyamine derivatives against the polyamine
di-substituted Ants 5 and 6 over the mono-substituted Ants in the presence of the inhibitor;
without the inhibitor, the PTS only has high selectivity for the methylated 6.24
Table 1. The cytotoxicity of the polyamine anthracene conjugates in the absence and presence of the polyamine transporter system (PTS) without and with polyamine oxidase inhibitor
Without inhibitor With inhibitor Cmpd IC50 (no PTS)
CHO-MG (µM)
IC50 (PTS)
CHO-WT (µM) Ratio
IC50 (no PTS)
CHO-MG (µM)
IC50 (PTS)
CHO-WT (µM)
Ratio
1 11.2 (± 2.3) 10.5 (± 2.0 ) 1.1 n.d. n.d. n.d.
2 7.6 (± 0.4) 7.7 (± 0.5 ) 1.0 n.d. n.d. n.d.
3 2.2 (± 0.1) 1.5 (± 0.02 ) 1.5 13.7 (± 1.3) 0.32 (± 0.01 ) 43
4 11.3 (± 2.2) 2.1 (± 0.06 ) 5.4 10.7 (± 1.2) 2.8 (± 0.2 ) 3.8
5 8.4 (± 0.7) 4.0 (± 0.03 ) 2.1 > 100 0.028 (± 0.001) > 3571
6 > 100 0.084 (± 0.002) > 1190 > 100 0.083 (± 0.004) > 1204
CHO-MG: Chinese hamster ovary cell line - mutated suppressed PTS genes CHO-WT: Chinese hamster ovary - wild type
n.d.: not determined
IC50: half maximal inhibitory concentration
From reference 21 and 24
Ratio IC CHO˗MG
IC CHO˗WT
1.2.3 Possible intracellular interactions of polyamine anthracene conjugates
There are many intracellular interactions that cause cytotoxicity and cell death, such as
the inhibition of a vital protein, production of cytotoxic metabolites, detrimental mutation, etc.
Proteins and DNA are potential targets for the Ants because the polyamine side chains are
derivatives of natural polyamine, such as putrescine, that has been shown to interact with these
macromoelcules.29 With respect to DNA, the positive charged polyamine side chain(s) can
potentially alter the negatively charged phosphodiester backbone to separate adjacent DNA base
pairs via electrostatic and H-bonding interaction, allowing the planar anthracene core to insert
between the DNA base pairs better.30, 31 The Ants can bind to DNA via either classical
intercalation if Ants is mono-substituted, or in a threading intercalation mode if di-substituted.32,
33 While the Ant can generate singlet oxygen and hydroxyl radicals upon irradiation with the UV
1.2.4 Ions in the eukaryotic nucleus
The nucleus contains various metals, such as Mg2+ and Na+, that perform a variety of
essential functions. 34, 35, 36 The divalent cation, Mg2+, is critical in stabilizing the backbone of
DNA due to its composition of phosphodiester anions.36 The monovalent cations, Na+ and K+,
also participate in the stabilization of DNA.37, 38 Cation concentrations are varied across the
different types of cells and the types of organism; however, in the nucleus, they are typically
between 100 to 300 mM for each monovalent ion (Na+ and K+).39, 35, 40 These monovalent ions
can compete with the positive amine on the polyamine chain of the anthracene for the negative
phosphodiester backbone, thereby decreasing the DNA binding affinity of the Ant.
1.2.5 Study of the interaction between DNA and polyamine anthracene conjugates under
high ionic conditions
The purpose of the research described in this thesis is to determine if DNA is a potential
target of the Ants in cells that express the PTS. The cations of the salts can interact with the
negative phosphodiester backbone to stabilize the DNA structure further, and the chloride anion
can have electrostatic interactions with the positive amino groups on the polyamine chains.
Therefore, it is imperative to determine the interference effects of a high ionic strength
environment on the DNA binding affinity of the Ants. The ionic conditions explored in this study
are 10 mM sodium phosphate buffer (pH 7.0) in the absence (for the low salt environments) and
presence of 150 mM NaCl and 260 mM KCl to represent the high salt condition in the cell
nucleus.30 The polyamine anthracene conjugates, as shown in Figure 1, were studied via
UV-visible spectrophotometry analysis, circular dichroism and induced circular dichroism analysis,
ethidium bromide displacement assay, and agarose gel shift assays to ascertain the degree of
2 EXPERIMENT
2.1 Materials and instruments
Agarose (A9539), sodium chloride (S9888), potassium chloride (P3911), sodium
phosphate monobasic monohydrate (S9638), sodium phosphate dibasic (S5136), dimethyl
sulfoxide (472301), were from Sigma-Aldrich. PUC19 plasmid DNA was cloned and quantified
from XL-1 blue E. coli competent cells (Stratagene). UltraPure™ Calf Thymus DNA (CT-DNA)
Solution, average size < 2000 bp came from Life Technologies. Ethidium bromide (892829) was
from GTI Laboratories Supplies. Polyamine-anthracene conjugates were synthesized by Dr.
Jennifer Archer in the Phanstiel Group at the University of Central Florida, as shown in Figure 1.
A Shimadzu UV-2401 PC spectrophotometer, equipped with UVPC v3.9 software, was
utilized to record UV-visible spectra. A Jasco J-810 Spectropolarimeter, with a J-800 control
driver v1.27.00, was used to obtain circular dichroism (CD) and induced CD (ICD) spectra.
Fluorescence data were acquired via CorningTM polystyrene white 96-well assay microplates and
a FLUOstar 4.31-0 microplate reader.
2.2 Methods
2.2.1 General
One M solutions of dibasic (pH 7.0) and monobasic sodium phosphate were prepared in
ddH2O to make 100 mM sodium phosphate buffer (pH 7.0). The 1 M NaCl and 1 M KCl
solutions were made with ddH2O for the high salt conditions. The calf thymus DNA (CT-DNA)
concentration of the original stock was ascertained again via DNA quantitation by UV-visible
spectrophotometry using an average extinction coefficient of 50 µg/mL. A 10,000 µM bp
buffer (pH = 7.0); a 5,000 µM bp CT-DNA solution was made by diluting of the 10,000 µM
stock with 100 mM sodium phosphate buffer and ddH2O. The final buffer concentration was ~5
mM for 10,000 µM stock and ~25 mM for 5,000 µM stock. All stocks of Ants were made at
high concentration (10 mM) in dehydrated DMSO and were stored at -20oC. The Ants, 4, 5 and
6, were the exceptions due to scarcity; their concentrations in DMSO were 2.10, 3.92 and 2.20
mM, respectively. Before the UV-visible titration, the original stock of Ant was diluted to 500
µM with ddH2O, and the sub-stock was stored in the freezer. For the 5 and 6, the stocks had to be
heated at 37oC for 7 min before diluting with ddH2O to make the sub-stock. A 5.088 mg/mL
ethidium bromide solution was prepared in ddH2O. All experiments were conducted at room
temperature and pH 7.0.
2.2.2 Circular dichroism
Four samples containing10 mM sodium phosphate buffer (pH 7.0), 150 µM bp CT-DNA
in 10 mM sodium phosphate buffer (pH 7.0), 50 µM Ant in 10 mM sodium phosphate buffer (pH
7.0), and 150 µM bp CT-DNA + 50 µM Ant in 10 mM sodium phosphate (pH 7.0), were made
for the low salt CD experiment. For the high salt conditions, 150 mM NaCl and 260 mM KCl
were added to in each sample. The induced CD spectra were obtained from 450 to 300 nm in a 1
cm, 3 mL quartz cuvette. The CD spectra were recorded from 300 to 200 nm in a 0.2 cm, 1 mL
quartz cuvette. The program was set up to run at 100 nm/min with a 2 s response time, a 1 nm
slit, and over 12 acquisitions. The sensitivity was high (5 mdeg) from 450 nm to 300 nm and
standard (100 mdeg) from 300 nm to 200 nm. The experiment was performed once.
2.2.3 DNA binding affinity of the ethidium bromide
The assay employed was adapted from the literature and was done in triplicate.41 A series
increasing per log10 concentration of the CT-DNA in molarity (i.e., log [DNA, M] from 8 to
-3.25). Each stock was divided into three 500 µL aliquots; 1 µL of 5.088 mg/mL was then added
to each aliquot ([EtBr]final = 12.9 µM) for UV-visible spectrophotometry, scanning from 200 nm
to 700 nm. The DNA binding affinity of the ethidium bromide (Ke) was ascertained using the
non-linear least squares method according to the following equations from reference 41:
A 1
1 0 (2)
where A is the absorbance at each DNA concentration, ε0 is the molar extinction
coefficient of the free ligand, the εb is the molar extinction coefficient of the DNA bound ligand,
Ct is the total ligand concentration, Cb is the bound ligand concentration (equation 2 was solved
for Cb by the quadratic formula), Dt is the total DNA concentration, and K is the DNA
association constant.41
Equation 2 was converted to the quadratic formula and incorporated into equation 1; the
completed equation was converted in a readable equation into Igor: Ct is constant1, while K, εb,
and εo are m4, m3, and m2, respectively. The parameter, m2, was locked within 5% error of the
real εo value. The m3 was locked above 1000 M-1 cm-1. The m4 was allowed to float. The
comparison between the predicted εb and εo and the real values is shown in Table B1 in the
Appendix B.
2.2.4 Ascertaining DNA binding affinity of Ants via UV-visible titration
UV-visible titrations were recorded under two different conditions, low salt (10 mM
sodium phosphate buffer, pH 7.0) and high salt (10 mM sodium phosphate with 150 mM NaCl
and 260 mM KCl). The 5,000 µM bp CT-DNA stocks were used for the low salt experiments,
concentration of each conjugate was shown in Table 2. CT-DNA was added to fixed
concentrations of Ants in increments of 0.5 to 2 µL until no changes in absorbance could be
observed, an indication that the Ant was bound entirely to DNA. The spectra were adjusted for
dilution resulting from the DNA addition. The DNA binding constant (Kb) was determined with
the equations 1 and 2 using the absorbance at 387 nm for the mono-substituted Ants (1 - 4) and
394 nm for the di-substituted (5 and 6); the monitored absorbances at these wavelengths
represented the binding of [Ants] to form Ant-DNA complex. The experiment was done in
2.2.5 Ethidium bromide displacement via fluorescence microplate assay
The ethidium bromide (EtBr) and CT-DNA stock solutions with molar ratios of 1.26:1
(63 µM EtBr for 5 and 6, 31.5 µM EtBr for 3 and 4, and 15.75 µM EtBr for 1 and 2) were
prepared and equilibrated for 30 min in the dark for the low salt conditions. For the high salt
experiments, 15.75 µM EtBr and 75 µM bp DNA (0.21:1 ratio) were employed. The set up of the
microplate involved a triplicate of blanks (10 mM sodium phosphate buffer, pH 7.0), a triplicate
of the EtBr + DNA stocks, and a triplicate of samples with increasing concentrations of the Ant
(the range was adjusted based on the preliminary data). A total of 20 µL of the EtBr + CT-DNA
solution was added to all sample wells except for the blank; the final volume of each well was
100 µL. The final concentrations in the low saltexperiment were as followed: a molar ratio of
1.26 EtBr to 1 DNA bp (Table 2), and 10 mM sodium phosphate buffer (pH 7.0); for the high
salt experiments, 3.15 µM EtBr and 15 µM bp CT-DNA were used with 150 mM NaCl and 260
KCl (Table 2). The excitation wavelength was 540 nm, and the emission wavelength was 590
nm. The instrument scans the microplates four times with five flashes per scan per well. The
apparent binding affinity of the Ant was calculated using equation 3:
(3)
where Kapp is the apparent DNA binding affinity, [EtBr] is the concentration of the
ethidium bromide, Ke is DNA binding affinity of EtBr, and [Ant]50 is the concentration of the
Ant at 50% EtBr-DNA fluorescence emission intensity.
2.2.6 Discerning the effects of the Ants on DNA migration via gel shift assay
The 1.5% gel was made with 1.5 g agarose in 100 µL of 1X TAE buffer for a typical
small gel box. The electrophoresis box was filled with 1X TAE buffer. Samples contained 10
volume). After a 30 min equilibrate period, 3 µL of the loading buffer was added to each sample
before loading in the wells of the gel. The gel was run for 1.75 h at 80 V. After the run, the gel
and half the 1X TAE running buffer were transferred to a container. A total of 200 µL of
ethidium bromide dye (5 mg/mL) was then added, and the gel was equilibrated in the EtBr
solution for 30 min.
3 RESULTS and DISCUSSION
The aim of this study was to investigate the structural influence of the number of the
amino groups and the number of polyamine side chains on polyamine anthracene conjugate -
DNA interactions. The Ants have been studied extensively with respect to cytotoxicity,
spectroscopy properties, and DNA interactions.20, 22, 42, 43 The polyamine side chains, owning to
their protonation potential, are expected to further enhance the DNA binding affinity of the
anthracene, a well-known DNA intercalator. The more positive amino groups there are, the
higher the expected DNA binding affinity.
3.1 DNA unwinding by polyamine anthracene conjugates
Compounds that bind to DNA via intercalation unwind the DNA helix. The CD spectra
of the DNA are the same under both low salt and high salt conditions, which indicates that the
high salt conditions do not change the DNA conformation significantly (Figure 2). However,
upon addition of the Ant 1 - 4 and 6, the DNA unwinding by the Ants binding caused a decrease
in the DNA CD signal in the 280 nm - 300 nm region as shown in Figure 2.44 Furthermore, the
apparent degree of unwinding followed the order, 6 > 4 > 3 > 2 > 1, which reflects the number of
positive cations of the ligand. While the DNA unwinding was significantly lower under the high
salt condition, the order of unwinding was the same (Figure 2B). Ant 6 is di-substituted with two
slightly higher DNA unwinding than Ant 3; the data suggest the transformation from a primary
to a secondary amine increases the protonation potential, thereby increasing the DNA unwinding.
An explanation for this occurrence is that a conversion of a primary amine to a secondary amine
via methylation may increase the pKa slightly.45
Although the Ants are not chiral at room temperature, they can form chiral complex with
DNA upon interaction.44 The formation of the chiral complex generates an induced CD (ICD)
signal as shown in Figure 2B and 2D. The pattern of the ICD signals matches the pattern of the
UV-visible absorption spectrum at the DNA saturation point of the Ants (Figure A1 to A5 in
Appendix A). The DNA unwinding and the ICD signal pattern together suggest that the DNA
interaction of Ants involves intercalation.44 The CD and ICD spectra both indicate that the
addition of salts reduces DNA binding affinity of the Ants. The degree of apparent helical
unwinding and the ICD signals are reduced in intensity. Notwithstanding, under the high ionic
strength conditions, compound 6 shows evidence of robust DNA interactions. The cationic
di-substituted Ants with trivalent polyamines can interact with two parts of the anionic
phosphodiester backbone of the nucleic acids.
Regarding the level of electrostatic and intercalation, there may be differences based on
the composition of the polyamine. For Ants, the distance between the anthracene and the
polyamine side chains are short; therefore, the polyamine side chain(s) can surround the
anthracene core. While 1 shows little to no unwinding as shown in Figure 2, the ICD signals
suggest intercalation. Thus, the polyamine plays a small role in the interaction between 1 and
DNA, and the level of intercalation is higher than electrostatic binding. For the di-substituted Ant
6, the trivalent polyamine side chains can inhibit intercalation due to electrostatic repulsion if the
the case of high salt conditions, the trivalent polyamine side chains of 6 are able to overcome the
high ionic strength, relaxing the DNA conformation to allow space for intercalation. Overall, the
relative levels of intercalation and electrostatic are dependent based on the structure of the Ants
and the ionic environment of DNA.
(A) (B)
[image:26.612.72.543.182.647.2](C) (D)
Figure 2. CD and ICD spectra of 1-4, 6
Circular dichroism and induced circular dichroism of 50 µM of Ant and/or 150 µM of CT-DNA in 10 mM sodium phosphate buffer (pH 7.0) in the absence (A and B) and presence (C and D) of 150 mM NaCl and 260 mM KCl. Inset: CD spectra from 260 nm to 300 nm. Appendix A shows CD, ICD, and the matching UV-visible spectra of each Ant.
-30 -20 -10 0 10 20 30 C D (mde g) 300 280 260 240 220 200 Wavelength (nm) 3 2 1 0 -1 IC D (m de g) 450 420 390 360 330 300 Wavelength (nm) -15 -10 -5 0 5 10 15 C D ( m de g) 300 280 260 240 220 200 Wavelength (nm) 2.0 1.5 1.0 0.5 0.0 -0.5 -1.0 IC D (mde g) 450 420 390 360 330 300 Wavelength (nm)
DNA 1 2 3 4 6
1 + DNA 2 + DNA 3 + DNA 4 + DNA 6 + DNA
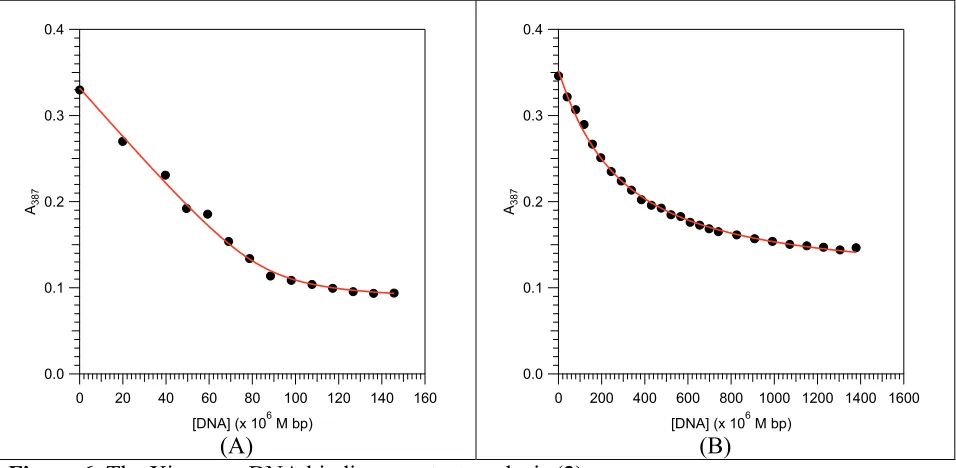
3.2 DNA binding affinity of ethidium bromide
Ethidium bromide is a known intercalator of DNA. To perform an ethidium bromide
displacement assay, it is necessary to study the EtBr-DNA interactions under low salt and high
salt conditions. The UV-visible spectra of the increasing DNA concentrations exhibit a
hypochromicity and red shifting in EtBr absorption (Figure 3). For the low salt experiment, the
515 nm point is pseudo isosbestic, which indicates another product is formed, potentially base
stacking of the ethidium bromide. For the purpose of the analysis, the 515 nm point is assumed
to be isosbestic. The hypochromic shift at 480 nm under the high salt conditions (Figure 3B) has
slower onset compared to the low salt (Figure 3A), which indicates the high salt impedes the
interaction between ethidium bromide and DNA. The absorbance at 480 nm was recorded to
monitor the disappearance of ligand (EtBr) and to calculate the binding constant using equations
1 and 2.
[image:27.612.74.547.403.638.2](A) (B)
Figure 3. UV-visible titration of EtBr with increasing DNA concentrations
12.9 µM of EtBrwas titrated with increasing DNA concentration under 10 mM sodium phosphate buffer (pH 7.0) in the absence (A) and presence (B) of 150 mM NaCl and 260 mM KCl. The spectra exhibit a hypochromicity and red shifting as more DNA is added. The UV-visible spectra have an isosbestic point at 515 nm, which indicates free and DNA bound forms of EtBr.
0.08 0.06 0.04 0.02 0.00 Ab so rb an ce 600 560 520 480 440 400 Wavelength (nm)
[DNA] in M bp 0.0117 0.0235 0.0352 0.0587 0.106 0.176 0.317 0.564 0.998 1.76 3.17 5.61 9.98 17.7 31.6 56.1 99.8 176 317 564 0.08 0.06 0.04 0.02 0.00 Ab so rb an ce 600 560 520 480 440 400 Wavelength (nm)
The spectra in Figure 3 show that the nature of the solution conditions changes the DNA
binding constants. Thus, it is necessary to determine the exact DNA binding affinity of the
ethidium bromide (Ke) under the low salt and the high salt conditions. Furthermore, it is
important to utilize the corrected Ke under different salt conditions for the equation 3 in the
ethidium bromide displacement assays (Figure 4). The was calculated by converting the
equations 1 and 2 into a computing equation in the curve fitting tool of Igor 6.34 (method
section). Determination of the DNA binding constant of ethidium bromide by Garbett and
co-workers showed the Ke equals to 1.23 ± 0.07 × 10⁵ M-1.46 This value was lower compared to the
= 3.68 ± 0.14 × 10⁵ M-1 value obtained using equations 1 and 2 (Figure 4A). The buffer
solution used by Garbett and for this experiment is similar (10 mM sodium phosphate buffer, pH
7.0), except for an additional 100 mM NaCl in the buffer for Garbett's experiments; this suggests
the high salt concentration decreases the DNA affinity of the EtBr. Therefore, the from
the UV-visible titration data (Figure 4A) is within a reasonable range of the reported value. Data
analysis shows is 2.95 ± 0.08 × 10⁴ M-1 under the high salt condition (Figure 4B). The
12-fold decrease in binding constant indicates that increasing the concentration of positive
cations alters the DNA binding constant of EtBr considerably. The ethidium binding constants,
3.68 ± 0.14 × 10⁵ M-1 for the low salt, and 2.95 ± 0.08 × 10⁴ M-1 for the high salt condition
calculated in this work, were utilized for the determination of the apparent binding constant of
Ants via EtBr displacement. The ε0 and εb under low salt condition are 4999 ± 80 and 2226 ± 96
M-1 cm-1; they are 4611 ± 52 and 1983 ± 72 M-1 cm-1 for the high salt conditions, respectively.
These values are lower than the literature values, 5560 ± 81 and 1837 ± 79 M-1 cm-1 (unknown
ionic strength conditions), respectively.41 The differences may be the results of the low and high
[image:29.612.73.546.72.302.2]
(A) (B)
Figure 4. Xiaogang analysis of DNA binding constant via the UV-visible titration of EtBr with DNA
Absorbance at 480 nm of 12.9 µM of EtBrwas titrated against with increasing DNA concentration under 10 mM sodium phosphate buffer (pH 7.0) in the absence (A) and presence (B) of 150 mM NaCl and 260 mM KCl. The model (solid line) is fitted onto the data (diamond) via non-linear least squares method with equation 3. Pearson's R > 0.9700. Inset: absorbance at 480 nm as a function of the log10 [DNA, M] for better visualization.
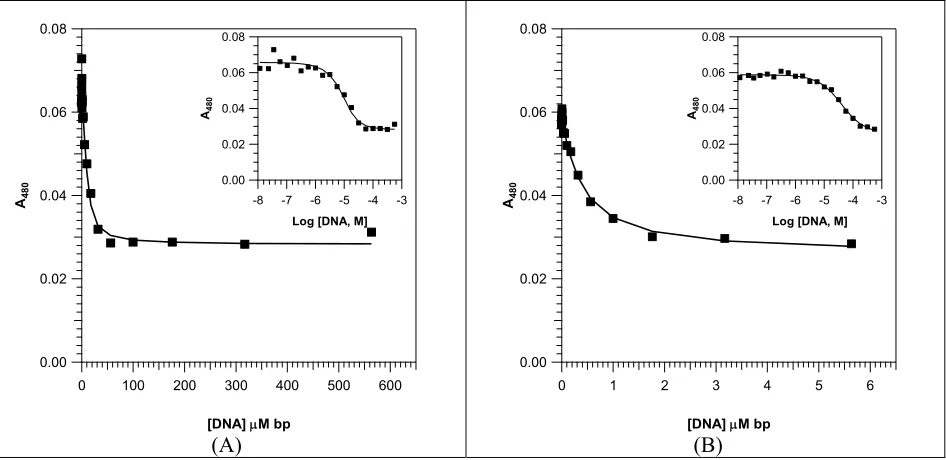
3.3 UV-visible spectral analysis and DNA binding constant determination of the Ants
The spectra of the mono-substituted and the di-substituted Ants have a slight difference:
the peak at 387 nm for the mono shifts to 394 nm for the di-substituted as shown in Figure B1 in
Appendix B2. The second substituted polyamine side chain may have caused the shift. To
determine DNA binding constants, increasing concentration of DNA were added to fixed
concentrations of the Ants and UV-visible spectra were recorded after each DNA addition. As
the concentration of DNA increases, the UV-visible spectra display hypochromic and red
shifting as illustrated in Figure 5. There is an isosbestic point at 392 nm for the mono-substituted
Ants (1 to 4), and at 398 nm for di-substituted 5 and 6. The isosbestic point indicates at least a
free and bound form of the Ants, and the hypochromic and red shifting indicate possible
intercalation. Similar DNA-induced absorbance changes have been observed in other types of
polyamine anthracene conjugates studied by Rodger, Kumar, and Wilson.20, 44, 47 The high salt
0.08
0.06
0.04
0.02
0.00
A48
0
600 500 400 300 200 100 0
[DNA] M bp
0.08
0.06
0.04
0.02
0.00
A48
0
6 5 4 3 2 1 0
[DNA] M bp
0.08
0.06
0.04
0.02
0.00 A48
0
-8 -7 -6 -5 -4 -3 Log [DNA, M] 0.08
0.06
0.04
0.02
0.00 A48
0
titration requires a significantly higher DNA concentrations relative to the low salt conditions;
however, this causes the UV-visible spectral baseline to shift in the 420 nm - 450 nm region
when making the adjustment for sample dilution upon DNA addition (Figure 5). The patterns
described here apply to the other five Ants, with the exception of Ant 5, as shown in Figure B1
in Appendix B2. As mentioned above, the UV-visible spectra of Ant 5 display high baseline
shifts when DNA is added under the low salt condition, which may be caused by aggregation of
Ant (Figure B1).
[image:30.612.71.532.263.494.2](A) (B)
Figure 5. Representative UV-visible titration (2)
85 µM of Ant 2 is titrated with increasing DNA concentrations in 10 mM sodium phosphate buffer (pH 7.0) in the absence (A) and presence (B) of 150 mM NaCl and 260 mM KCl. The spectra exhibit hypochromic and red shifting as more DNA is added. The shift is slower under the high salt condition compared to low salt. The isosbestic point at 392 nm indicates a free and DNA bound form of 2. Adjustment for sample dilution causes artificial baseline shifting in the 420 - 450 nm region under the high salt conditions. Appendix B2 contains the representative UV-visible titration spectra of the other Ants.
Due to light scattering observed for Ant 5 under the low salt condition, the of
Ant 5 was not calculated (Figure B1 in the Appendix). There are also concerns regarding the
final volume being significantly higher than the original 500 μL volume in the cuvette prior to
DNA addition, especially for the weak binding Ants under the high salt conditions (e.g., 625,
and 555 μL for Ant 1 to 3, respectively); when the volume is adjusted for the sample dilution, the
absorbance can shift upward if the dilution ratio is too high, which results in artificial baseline
0.5 0.4 0.3 0.2 0.1 0.0 Ab so rb an ce 450 420 390 360 330 300 Wavelength (nm)
[DNA] in M bp 0 19.9 39.7 49.5 59.3 69.0 78.7 88.4 98.0 108 117 127 136 146 0.5 0.4 0.3 0.2 0.1 0.0 A b so rb an ce 450 420 390 360 330 300 Wavelength (nm)
shift at 420 to 450 nm as shown in Figure 5 and Figure B2. The binding constants under the high
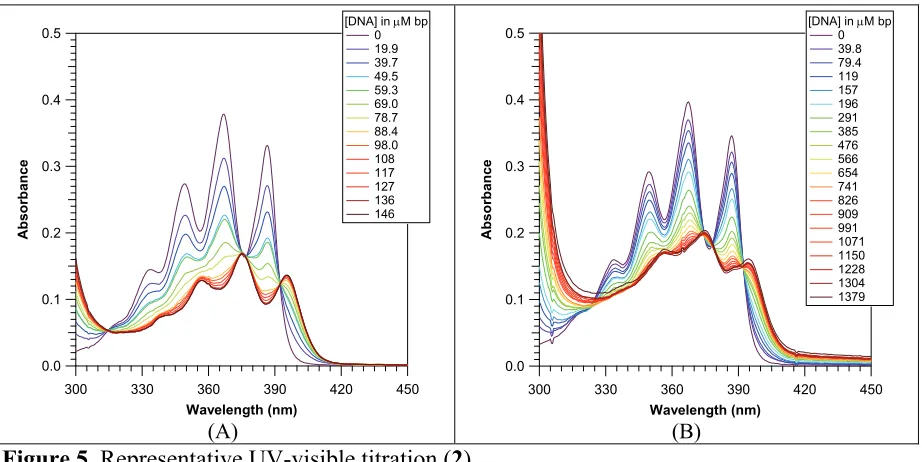
salt conditions may be adversely affected by this adjustment. The were determined for the
absorbance at 387 nm for the mono-substituted and 394 nm for the di-substituted Ants using
equations 1 and 2 to determine binding constants ( ). The was calculated by converting the
equations 1 and 2 into a computing equation in the curve fitting tool of Igor 6.34 (method
section), and manually adjusting the given results for the analysis of variance to produce a
Pearson's R (least square curve fits) value close to 1; an example is Ant 2 as shown in Figure 6.
The plotting for each UV-visible spectra is in Figure B3 and B4 in Appendix B3.
[image:31.612.68.546.294.528.2](A) (B)
Figure 6. The Xiaogang DNA binding constant analysis (2)
Xiaogang analysis of (A) Figure 5A and (B) Figure 5B. The model (solid) is fitted onto the data (circle) via equations 1 and 2 with non-linear curve squared analysis. Pearson's R value: (A) 0.9976, (B) 0.9988. Xiaogang analysis of all of the Ants is in Figure B3 and B4 inAppendix B3
The high salt conditions significantly decrease the ; the two salt conditions result in
different orderings of binding constant. From highest to lowest, the order of is 2 > 4 > 3
≈ 6 > 1, and the is 6 > 5 > 4 ≈ 3 ≈ 2 > 1. Closer analysis of the Xiaogang model reveals
that, while the curve fitting analysis show good to excellent fits (Pearson's R > 0.9700), the
model does not fit all the data point under the low salt and high salt condition for Ants 3 and 4
0.4
0.3
0.2
0.1
0.0
A387
160 140 120 100 80 60 40 20 0
[DNA] (x 106 M bp)
0.4
0.3
0.2
0.1
0.0
A387
1600 1400 1200 1000 800 600 400 200 0
(Figure B3 and B4). The extinction coefficient of the DNA bound (εb) obtained from the
equation 1 does not match with the real value (Table B1 in the Appendix B4). While there is no
correlation between the structure and the binding constant in the UV-visible titration data, the
analysis agrees with the other experiments that the Ant 1 has the weakest DNA interaction
among the six polyamine anthracene conjugates and that Ants are strong DNA binders under
both low and high salt conditions.
An empirical observation of the UV-visible spectra and their hypochromic shift data give
some hints relating to the relative DNA binding affinities of the Ants (Table 2). By comparing
the hypochromic shift of the free Ants to the saturation point where all of the Ants are DNA
bound (Figure B3 and B4), the order of decreasing DNA binding affinities is as follows: 6 > 5 >
4 ≈ 3 ≈ 2 > 1 under low salt conditions, and 6 > 5 > 3 > 4 ≈ 2 > 1 under high salt conditions
(Table 2). These observations are relatively consistent with the data obtained in circular
dichroism experiments. An indirect method, ethidium bromide displacement, was also used to
Table 2. The DNA binding affinities of the polyamine anthracene conjugates via EtBr displacement and UV-visible titration analyses
n = 3 γn=2 n.d.: not determined βArtificial baseline shift αNeed to be revised +High baseline shift
[EtBr]: the final concentration of EtBr in the sample [Ant]: the concentration of Ant used in UV-visible titration The ε0 and εf for UV-visible Titration are in Table B1 in the Appendix B4
λmax for 1 to 4 = 387 nm λmax for 5 and 6 = 394 nm
; ratio of EtBr:DNA = 1.26:1, = 3.68 ± 0.14 × 10⁵ M-1
ratio of EtBr:DNA = 0.21:1, = 2.95 ± 0.08 × 10⁴ M-1
3.4 Apparent DNA binding affinities of the polyamine anthracene conjugates
The ethidium bromide (EtBr) displacement assay can be used to give a good picture
concerning the relative DNA binding affinities of closely related compounds. Because Ants are
intercalators, they can theoretically displace the EtBr from DNA base pairs. The loss of the EtBr
from the DNA helix quenches its fluorescence in the EtBr displacement assays. Increasing
concentration of the Ants were added to solution containing DNA-bound EtBr. All of the Ants
quenched EtBr fluorescence as shown in Figure 7. From the data, the concentration of Ants at
50% fluorescence intensity (C50) was used to calculate the apparent binding constant, , with
equation 3. The low salt titration in Figure 7A shows four compounds (3 to 6) to have a ratio of
Ant to EtBr less than 1, which implies that these Ants have a stronger DNA affinity than EtBr.
However, the high salt conditions significantly impede DNA binding of EtBr, resulting in the
ratio 1.26 EtBr:DNA used in Figure 7A not working well in forming the EtBr-DNA complex.
The ratio 0.21 EtBr to DNA has shown similar fluorescence intensity under high salt when
EtBr Displacement Assay UV-visible Titrationα
Ant [EtBr] (µM)
(x 104 M-1) [EtBr] (µM)
(x 104 M-1)
[Ant] (µM)
Hypochromic
% at λmax (x 104 M-1)
Hypochromic % at λmax
(x 104 M-1)
1 3.15 0.88 ± 0.06 3.15 0.037 ± 0.001 48 31.1 ± 0.4 2.8 ± 0.3 46 ± 1β 0.27 ± 0.04β
2 3.15 29.7 ± 3.0 3.15 0.051 ± 0.002 85 28.4 ± 0.5 31 ± 2 40 ± 2β 0.45 ± 0.10β
3 6.3 151 ± 13 3.15 0.115 ± 0.006 54 27.7 ± 0.2 6.4 ± 0.6 37 ± 1β 0.41 ± 0.05β
4 6.3 201 ± 3 3.15 0.200 ± 0.004 48 28.8 ± 0.9 11 ± 1 40.8 ± 0.9 0.37 ± 0.04
5 12.6 276 ± 12 3.15 0.134 ± 0.005 60 24.4 ± 0.4γ n.d.+ 31.1 ± 0.3 0.936 ± 0.012
compared to the ratio 1.26 under low salt condition, which implies the ratio is applicable for the
EtBr displacement under high salt. Nevertheless, because the DNA concentration is higher than
the concentration of the EtBr in the high ionic strength experiments, Ants can potentially bind to
the DNA first before displacing the EtBr.
[image:34.612.71.547.181.403.2](A) (B)
Figure 7. EtBr displacement of Ants 1 to 6
The [EtBr] (Table 2) is titrated with increasing [Ants] in 10 mM sodium phosphate buffer (pH 7.0) in the absence (A) and presence (B) of 150 mM NaCl and 260 mM KCl. Excitation: 540 nm, emission: 590 nm. As the concentration of Ants increases, the EtBr-DNA emission decreases. Inset: relative fluorescence of 1 under low salt and 1 and 2 under high salt condition.
Although the EtBr displacements in Figure 7B display close associations to each other for
Ant 3 - 6, the determined C50 values and the following calculated value have significant
differences based on the standard deviation (Table 2). The apparent binding constants under the
low salt conditions ( ) have a direct correlation to the number of the amino groups and
the length of the polyamine chain as follows: 6 >> 5 >> 4 >> 3 >> 2 >> 1. In this experiment,
Ant 6 to 3 have a higher apparent DNA binding affinity than the DNA binding affinity of the
EtBr (446.6, 275.5, 200.6, 151.0, and 36.8 × 10⁴ M-1, respectively, Table 2). The apparent
binding constants of 1 and 2 are lower than EtBr under the low salt condition (Table 2).
Furthermore, the of 2 is within range of the (31 v. 29.7 x10⁴ M-1, Table 2). The
1.0
0.5
0.0
Relative In
te
n
si
ty
2 1
0
r [Ant]/[EtBr]
0.50
90 60 30 0
1.0
0.5
0.0
Relative In
te
n
si
ty
40 30
20 10
0
r [Ant]/[EtBr]
0.50
150 100 50 0
comparison between the two binding constants data and the good fit of the Xiaogang model on
the data suggest the of 1 and 2 are reliable. Ants 6 and 5 are stronger DNA binders than
the other Ants most likely because they are di-substituted with trivalent polyamines compared to
the mono-substituted Ants. The binding data suggest that methylation at the terminal amine(s) (3
to 4 and 5 to 6) enhances the DNA binding affinities, possibly due to increasing the protonation
potential of the amino groups.45
As expected, the values were substantially lower compared to the ;
although, the difference between each apparent binding constant was not as significant. The
order of the Ants has slightly changed under the high ionic strength conditions (6 > 4 > 5 > 3 > 2
> 1), and none of the Ants has a higher apparent binding constant than EtBr. The change may be
due to the Ants binding to DNA before displacing the EtBr. Thus, the is treated as a
representative binding constant for comparison between the Ants under low salt and high salt
conditions. Overall, 6 has the strongest apparent DNA binding constant in the Ant series.
3.5 The effect of Ants on the migration of DNA bands in agarose gels
In gel electrophoresis, the DNA bands move from the negative cathode to the positive
anode due to the anionic phosphodiester backbone of the nucleic acid. The rate of migration of
the DNA band is directly correlated to the molecular weight (or size) and the DNA
conformation. Complex formation between DNA and positively charged ligands leads to higher
molecular weights, reduced negative charge, and possible DNA conformational changes that can
change the migration of the DNA bands. As shown in Figure 8, Figure 9, and Figure 10, the
relative mobilities of the complexes formed between plasmid DNA and the Ants ranked, from
slowest to fastest migration under dark conditions, is as follows: 6 > 5 > 4 ≈ 3 > 2 > 1. There is
ratio of Ant to DNA (10:1) as shown in Figure 8. The high salt conditions are not usually used
the gel shift assays because the salts can disperse from the wells of the gel. Therefore, low salt
and high salt conditions produced generally nearly identical results. Overall, the di-substituted
Ant 6 has the strongest ability to alter the mobility of plasmid DNA. The methylation at the
terminal amine of Ant 6 may have contributed to its ability to retard DNA migration more
efficiently compared to Ant 5.
Lane 1 2 3 4 5 6 7
[Ant] (μM) 0 50 150 300 10 50 100
[image:36.612.167.442.234.339.2]Legend DNA 1 2
Figure 8. Effect of increasing concentrations of 1 and 2 on the relative gel mobilities of DNA 30 μM bp of pUC19 DNA is titrated with increasing [Ant] under the low salt (10 mM sodium phosphate buffer, pH 7.0) conditions for 1.75 h at 80 V.
Lane 1 2 3 4 5 6 7
[Ant] (μM) 0 0.5 2.5 5.0 0.5 2.5 5.0
[image:36.612.170.446.392.498.2]Legend DNA 3 4
Figure 9. Effect of increasing concentrations of 3 and 4 on the relative gel mobilities of DNA 30 μM bp of pUC19 DNA is titrated with increasing [Ant] under the low salt (10 mM sodium phosphate buffer, pH 7.0) conditions for 1.75 h at 80 V.
Lane 1 2 3 4 5 6 7
[Ant] (μM) 0 0.5 2.5 5.0 0.5 2.5 5.0
Legend DNA 5 6
[image:36.612.171.445.552.657.2]4 CONCLUSIONS
The polyamine anthracene conjugates described in this thesis incorporated known
polyamines that cells uptake actively via the polyamine transporter system. The composition of
the Ants included structural features that enhance DNA interactions: the polycyclic aromatic
hydrocarbon anthracene core can intercalate between the DNA base pairs, and the cationic
polyamines can interact electrostatically with the anionic phosphodiester backbone of nucleic
acids under physiological conditions. This thesis focuses on investigating the correlation between
the composition of the polyamine side chain(s) and the DNA binding affinities of Ants. The
overwhelming majority of data reported here have pointed to Ant 6, MeN44A44NMe, as having
the strongest DNA binding affinity (Table 3). If the order obtained from the empirical
observation of the hypochromic effect of the UV-visible spectra at the saturation points of the
Ants is considered instead of the DNA binding constant, the ordering would be similar to the
ordering of the other experiments. The high ionic strength conditions significantly hinder the
DNA binding affinity of the Ants, which is expected considering the significant differences
between the concentration of salts (NaCl and KCl) compared to the concentration of the Ants.
There is a general trend in which increasing positive amino groups increase DNA binding as
observed in circular dichroism, EtBr displacement, and gel shift assays. The di-substituted Ants
have relatively higher DNA binding affinities than the mono-substituted Ants. The monovalent
cations Na(I) and K(I) can stabilize the DNA structure, and the chloride ions can interact with
the positive amino groups of the polyamines. Considering the cytotoxicity of the Ants in cell
lines that express the PTS, it is probable that the compounds, or their by-products, have
the Ants studied in this thesis suggests that the di-substituted Ant 6 has the highest potential to
[image:38.612.67.527.134.309.2]interact with DNA after taking advantage of the PTS to enter cells.
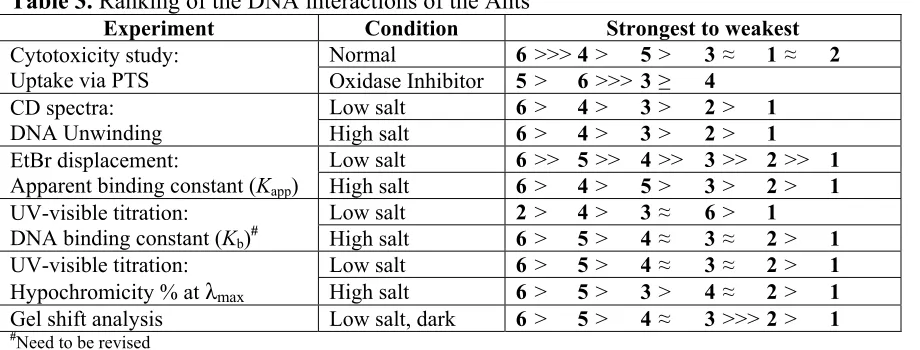
Table 3. Ranking of the DNA interactions of the Ants
Experiment Condition Strongest to weakest
Cytotoxicity study: Uptake via PTS
Normal 6 >>> 4 > 5 > 3 ≈ 1 ≈ 2
Oxidase Inhibitor 5 > 6 >>> 3 ≥ 4
CD spectra: DNA Unwinding
Low salt 6 > 4 > 3 > 2 > 1
High salt 6 > 4 > 3 > 2 > 1
EtBr displacement:
Apparent binding constant (Kapp)
Low salt 6 >> 5 >> 4 >> 3 >> 2 >> 1
High salt 6 > 4 > 5 > 3 > 2 > 1
UV-visible titration: DNA binding constant (Kb)#
Low salt 2 > 4 > 3 ≈ 6 > 1
High salt 6 > 5 > 4 ≈ 3 ≈ 2 > 1
UV-visible titration: Hypochromicity % at λmax
Low salt 6 > 5 > 4 ≈ 3 ≈ 2 > 1
High salt 6 > 5 > 3 > 4 ≈ 2 > 1
Gel shift analysis Low salt, dark 6 > 5 > 4 ≈ 3 >>> 2 > 1
#Need to be revised
REFERENCES
1. Harrington, K. J., Biology of cancer. Medicine 2011, 39 (12), 689-692.
2. Harrington, K.; Jankowska, P.; Hingorani, M., Molecular biology for the radiation oncologist: The 5Rs of radiobiology meet the hallmarks of cancer. Clinical Oncology 2007, 19 (8), 561-571.
3. Bodduluru, L. N.; Kasala, E. R.; Madhana, R. M. R.; Sriram, C. S., Natural killer cells: The journey from puzzles in biology to treatment of cancer. Cancer Letters 2015, 357 (2), 454-467.
4. Culp, S. J.; Gaylor, D. W.; Sheldon, W. G.; Goldstein, L. S.; Beland, F. A., A comparison of the tumors induced by coal tar and benzo[a]pyrene in a 2-year bioassay. Carcinogenesis 1998, 19 (1), 117-124.
5. Boström, C.-E.; Gerde, P.; Hanberg, A.; Jernström, B.; Johansson, C.; Kyrklund, T.; Rannug, A.; Törnqvist, M.; Victorin, K.; Westerholm, R., Cancer risk assessment, indicators, and guidelines for polycyclic aromatic hydrocarbons in the ambient air. Environmental Health
Perspectives 2002, 110 (Suppl 3), 451-488.
6. Mastrangelo, G.; Fadda, E.; Marzia, V., Polycyclic aromatic hydrocarbons and cancer in man. Environmental Health Perspectives 1996, 104 (11), 1166-1170.
7. Talaska, G.; Underwood, P.; Maier, A.; Lewtas, J.; Rothman, N.; Jaeger, M., Polycyclic aromatic hydrocarbons (PAHs), nitro-PAHs and related environmental compounds: Biological markers of exposure and effects. Environmental Health Perspectives 1996, 104, 901-906.
8. Eisler, R., Polycyclic aromatic hydrocarbon hazards to fish, wildlife, and invertebrates: A synoptic review. Contaminant Hazard Reviews 1987, 11.
9. Geacintov, N. E.; Cosman, M.; Hingerty, B. E.; Amin, S.; Broyde, S.; Patel, D. J., NMR solution structures of stereoisomeric covalent polycyclic aromatic carcinogen−DNA adducts: principles, patterns, and diversity. Chemical Research in Toxicology 1997, 10 (2), 111-146. 10. Guengerich, F. P., Metabolism of chemical carcinogens. Carcinogenesis 2000, 21 (3), 345-351.
11. Lin, C. H.; Huang, X. W.; Kolbanovskii, A.; Hingerty, B. E.; Amin, S.; Broyde, S.; Geacintov, N. E.; Patel, D. J., Molecular topology of polycyclic aromatic carcinogens determines DNA adduct conformation: A link to tumorigenic activity. Journal of Molecular Biology 2001, 306 (5), 1059-1080.
12. Alderden, R. A.; Mellor, H. R.; Modok, S.; Hambley, T. W.; Callaghan, R., Cytotoxic efficacy of an anthraquinone linked platinum anticancer drug. Biochemical Pharmacology 2006, 71 (8), 1136-1145.
13. Gibson, D.; Binyamin, I.; Haj, M.; Ringel, I.; Ramu, A.; Katzhendler, J., Anthraquinone intercalators as carrier molecules for second-generation platinum anticancer drugs. European Journal of Medicinal Chemistry 1997, 32 (10), 823-831.
14. Shi, J.; Tang, C. W., Anthracene derivatives for stable blue-emitting organic electroluminescence devices. Applied Physics Letters 2002, 80 (17), 3201-3203.
15. Janossy, I.; Kosa, T., Influence of anthraquinone dyes on optical reorientation of nematic liquid-crystals. Optics Letters 1992, 17 (17), 1183-1185.
17. de Bono, J. S.; Oudard, S.; Ozguroglu, M.; Hansen, S.; Machiels, J. P.; Kocak, I.; Gravis, G.; Bodrogi, I.; Mackenzie, M. J.; Shen, L.; Roessner, M.; Gupta, S.; Sartor, A. O., Prednisone plus cabazitaxel or mitoxantrone for metastatic castration-resistant prostate cancer progressing after docetaxel treatment: a randomised open-label trial. Lancet 2010, 376 (9747), 1147-54. 18. Lown, J. W., Anthracycline and anthraquinone anticancer agents - current status and recent developments. Pharmacology and Therapeutics 1993, 60 (2), 185-214.
19. Parker, C.; Waters, R.; Leighton, C.; Hancock, J.; Sutton, R.; Moorman, A. V.; Ancliff, P.; Morgan, M.; Masurekar, A.; Goulden, N.; Green, N.; Revesz, T.; Darbyshire, P.; Love, S.; Saha, V., Effect of mitoxantrone on outcome of children with first relapse of acute lymphoblastic leukaemia (ALL R3): an open-label randomised trial. Lancet 2010, 376 (9757), 2009-2017. 20. Rodger, A.; Blagbrough, I. S.; Adlam, G.; Carpenter, M. L., DNA-binding of a spermine derivative - spectroscopic study of anthracene-9-carbonyl-N1-spermine with poly d(G-C).(d(G-C) and poly d(A-T).d(A-T). Biopolymers 1994, 34 (12), 1583-1593.
21. Phanstiel, O. I.; Kaur, N.; Delcros, J. G., Structure-activity investigations of polyamine-anthracene conjugates and their uptake via the polyamine transporter. Amino Acids 2007, 33 (2), 305-313.
22. Rodger, A.; Taylor, S.; Adlam, G.; Blagbrough, I. S.; Haworth, I. S., Multiple DNA-binding modes of anthracene-9-carbonyl-N1-spermine. Bioorganic & Medicinal Chemistry 1995, 3 (6), 861-872.
23. Sugiyama, S.; Vassylyev, D. G.; Matsushima, M.; Kashiwagi, K.; Igarashi, K.;
Morikawa, K., Crystal structure of PotD, the primary receptor of the polyamine transport system in Escherichia coli. Journal of Biological Chemistry 1996, 271 (16), 9519-9525.
24. Muth, A.; Kamel, J.; Kaur, N.; Shicora, A. C.; Ayene, I. S.; Gilmour, S. K.; Phanstiel, O., Development of polyamine transport ligands with improved metabolic stability and selectivity against specific human cancers. Journal of Medicinal Chemistry 2013, 56 (14), 5819-5828. 25. Porter, C. W.; Miller, J.; Bergeron, R. J., Aliphatic chain length specificity of the poly amine transport system in ascites l-1210 leukemia cells. Cancer Research 1984, 44 (1), 126-128. 26. Igarashi, K.; Kashiwagi, K., Characteristics of cellular polyamine transport in
prokaryotes and eukaryotes. Plant Physiology and Biochemistry 2010, 48 (7), 506-512. 27. Cullis, P. M.; Green, R. E.; Merson-Davies, L.; Travis, N., Probing the mechanism of transport and compartmentalisation of polyamines in mammalian cells. Chemistry & Biology 1999, 6 (10), 717-729.
28. Phanstiel, O. t.; Kaur, N.; Delcros, J. G., Structure-activity investigations of polyamine-anthracene conjugates and their uptake via the polyamine transporter. Amino Acids 2007, 33 (2), 305-13.
29. Bachrach, U., Naturally occurring polyamines: interaction with macromolecules [abstract]. Current Protein & Peptide Science 2005, 6 (6), 559-66.
30. Terry, C. A.; Fernandez, M. J.; Gude, L.; Lorente, A.; Grant, K. B., Physiologically relevant concentrations of NaCl and KCl increase DNA photocleavage by an N-substituted 9-aminomethylanthracene dye. Biochemistry 2011, 50 (47), 10375-10389.
31. Armitage, B. A., Cyanine dye-DNA interactions: Intercalation, groove binding, and aggregation. In DNA Binders and Related Subjects, Waring, M. J.; Chaires, J. B., Eds. Springer-Verlag Berlin: Berlin, 2005; Vol. 253, pp 55-76.
33. Panagiotidis, C. A.; Artandi, S.; Calame, K.; Silverstein, S. J., Polyamines alter sequence-specific DNA-Protein interactions. Nucleic Acids Research 1995, 23 (10), 1800-1809.
34. Hooper, G.; Dick, D. A., Nonuniform distribution of sodium in the rat hepatocyte. The Journal of General Physiology 1976, 67 (4), 469-74.
35. Moore, R. D.; Morrill, G. A., A possible mechanism for concentrating sodium and potassium in the cell nucleus. Biophysical Journal 1976, 16 (5), 527-33.
36. Naora, H.; Naora, H.; Mirsky, A. E.; Allfrey, V. G., Magnesium and calcium in isolated cell nuclei. The Journal of General Physiology 1961, 44 (4), 713-742.
37. Williamson, J. R.; Raghuraman, M. K.; Cech, T. R., Monovalent cation-induced structure of telomeric DNA the g-quartet model. Cell 1989, 59 (5), 871-880.
38. McFail-Isom, L.; Sines, C. C.; Williams, L. D., DNA structure: cations in charge? Current Opinion in Structural Biology 1999, 9 (3), 298-304.
39. Hooper, G.; Dick, D. A., Nonuniform distribution of sodium in the rat hepatocyte. The Journal of general physiology 1976, 67 (4), 469-74.
40. Dick, D. A., The distribution of sodium, potassium and chloride in the nucleus and cytoplasm of Bufo bufo oocytes measured by electron microprobe analysis. The Journal of Physiology 1978, 284, 37-53.
41. Qu, X. G.; Chaires, J. B., Analysis of drug-DNA binding data. Numerical Computer Methods, Part C 2000, 321, 353-369.
42. Cain, B. F.; Baguley, B. C.; Denny, W. A., Potential antitumor agents. 28.
Deoxyribonucleic acid polyintercalating agents. Journal of Medicinal Chemistry 1978, 21 (7), 658-68.
43. Tan, W. B.; Bhambhani, A.; Duff, M. R.; Rodger, A.; Kumar, C. V., Spectroscopic identification of binding modes of anthracene probes and DNA sequence recognition. Photochemistry and Photobiology 2006, 82 (1), 20-30.
44. Duff, M. R.; Mudhivarthi, V. K.; Kumar, C. V., Rational design of anthracene-based DNA binders. Journal of Physical Chemistry B 2009, 113 (6), 1710-1721.
45. Hall, H. K., Correlation of the base strengths of amines1. Journal of the American Chemical Society 1957, 79 (20), 5441-5444.
46. Garbett, N. C.; Hammond, N. B.; Graves, D. E., Influence of the amino substituents in the interaction of ethidium bromide with DNA. Biophysical Journal 2004, 87 (6), 3974-3981. 47. Wilson, W. D.; Wang, Y.-H.; Kusuma, S.; Chandrasekaran, S.; Boykin, D. W., The effect of intercalator structure on binding strength and base-pair specificity in DNA interactions.
APPENDICES
Appendix A: CD, ICD, and UV-visible spectra
CD Spectra
ICD Spectra
[image:42.612.70.548.126.571.2]UV-visible Spectra
Figure A1. CD, ICD, UV-visible Spectra of 1 under low salt (10 mM sodium phosphate buffer) and high salt condition (10 mM sodium phosphate buffer, 150 mM NaCl, and 260 mM KCl)
CD and ICD: Ratio of [Ant]/[DNA] = 0.3
UV-visible Spectra: the 1 + DNA is at saturation for low salt or at similar ratio 0.3 for +Salt
CD Spectra
ICD Spectra
[image:43.612.69.548.70.506.2]UV-visible Spectra
Figure A2. CD, ICD, UV-visible Spectra of 2 under low salt (10 mM sodium phosphate buffer) and high salt condition (10 mM sodium phosphate buffer, 150 mM NaCl, and 260 mM KCl)
CD and ICD: Ratio of [Ant]/[DNA] = 0.3
UV-visible Spectra: the 2 + DNA is at saturation for low salt or at similar ratio 0.3 for +Salt
CD Spectra
ICD Spectra
[image:44.612.68.547.69.509.2]UV-visible Spectra
Figure A3. CD, ICD, UV-visible Spectra of 3 under low salt (10 mM sodium phosphate buffer) and high salt condition (10 mM sodium phosphate buffer, 150 mM NaCl, and 260 mM KCl)
CD and ICD: Ratio of [Ant]/[DNA] = 0.3
UV-visible Spectra: the 3 + DNA is at saturation for low salt or at similar ratio 0.3 for +Salt
CD Spectra
ICD Spectra
[image:45.612.69.548.70.506.2]UV-visible Spectra
Figure A4. CD, ICD, UV-visible Spectra of 4 under low salt (10 mM sodium phosphate buffer) and high salt condition (10 mM sodium phosphate buffer, 150 mM NaCl, and 260 mM KCl)
CD and ICD: Ratio of [Ant]/[DNA] = 0.3
UV-visible Spectra: the 4 + DNA is at saturation for low salt or at similar ratio 0.3 for +Salt
CD Spectra
ICD Spectra
[image:46.612.68.548.69.508.2]UV-visible Spectra
Figure A5. CD, ICD, UV-visible Spectra of 6 under low salt (10 mM sodium phosphate buffer) and high salt condition (10 mM sodium phosphate buffer, 150 mM NaCl, and 260 mM KCl)
CD and ICD: Ratio of [Ant]/[DNA] = 0.3
UV-visible Spectra: the 6 + DNA is at saturation for low salt or at similar ratio 0.3 for +Salt
Appendix B: UV-visible titration spectra and Xiaogang DNA binding constant analysis
Appendix B1. Equations
Pearson's R (least square curve fit)
∑ ̅
∑ ̅ ∑ ;
x: model
y: experimental data i: number of ith data
Xiaogang
A (1)
1 0 (2)
A is the absorbance at each DNA concentration ε0 is the molar extinction coefficient of the free ligand
εb is the molar extinction coefficient of the DNA bound ligand Ct is the total ligand concentration
Cb is the bound ligand concentration (equation 2 was solved for Cb by the quadratic formula) Dt is the total DNA concentration, K is the DNA association constant
![Figure 8. Effect of increasing concentrations of 1 and 2 on the relative gel mobilities of DNA 30 μM bp of pUC19 DNA is titrated with increasing [Ant] under the low salt (10 mM sodium phosphate buffer, pH 7.0) conditions for 1.75 h at 80 V](https://thumb-us.123doks.com/thumbv2/123dok_us/9113037.984881/36.612.171.445.552.657/increasing-concentrations-relative-mobilities-titrated-increasing-phosphate-conditions.webp)