Munich Personal RePEc Archive
Managing risks: what Russian
households do to smooth consumption?
Notten, Geranda and Neubourg, Chris de
Maastricht Graduate School of Governance, Maastricht University
August 2007
Managing risks: what Russian households do
to smooth consumption
Geranda Notten
10 August 2007
Department of Economics / Maastricht Graduate School of Governance Maastricht University
MGSoG TS 49 P.O. Box 616
6200 MD Maastricht The Netherlands
Managing risks: what Russian households do to smooth consumption
Abstract
The increasing availability of rich (panel) data provides many opportunities to test
theories on consumption smoothing behaviour. At the same time, the informational
requirements in terms of data and modelling are high and very context specific, thus
requiring a filtering of essential explanatory ingredients. In this paper we show how
conceptual and exploratory empirical analysis can contribute to this filtering process. We
develop a conceptual framework to analyze possible smoothing arrangements of
households distinguishing between various smoothing mechanisms, institutional
smoothing partners and required assets. Subsequently, we apply this framework to
Russian survey data to explore how Russian households may smooth consumption. We
select and analyze a broad set of indicators from household survey data to study what
actions Russian households take and how these actions reflect the existence and
prevalence of particular smoothing channels. The results can be used to formulate
hypotheses on household smoothing behaviour and to delineate the features of a more
rigorous analysis. The picture that emerges is one in which financial markets play a
limited role as a smoothing channel in Russia, regardless of the smoothing mechanism
used (saving, lending, insurance). Instead, households seem to use internal strategies,
their family, social networks and the state to smooth consumption through capital
accumulation, gift giving, the provision of loans and (pension) benefits. Furthermore, we
find some evidence that old age pensions may be used for intergenerational risk-sharing
within families while other findings point towards the use of household food production
as an income smoothing strategy as opposed to a shock-response strategy.
Keywords: consumption smoothing, poverty, social risk management, Russia
1. Introduction
Households face the risk that they are not able to fulfil the (basic) needs of their
members, today as well as tomorrow. To prevent this risk from materializing, households
set aside part of their current resources to finance future consumption in the form of
savings or insurance. Additionally, when it becomes clear that income will not suffice,
households can seek alternative funding. When these measures are effective, households
are able to maintain a particular welfare level, even when (expected) income falls short.
The ability of households to smooth consumption over time thus reflects a key dimension
of well being. Although the underlying smoothing mechanisms are similar, the ways in
which households smooth consumption are highly context dependent, i.e. on the
particular institutional, social and economic context they live in.
Households in transition economies face a wide range of risks and shocks similar to those
experienced by households all over the world.1 At the same time, the drastic structural
changes taking place in transition economies form an additional source of risk; the
transition from a centrally planned to a market economy has been accompanied by
macro-economic instability such as high inflation, real wage declines, unemployment,
financial and economic crises thereby shaping a highly uncertain environment for
households in transition economies. In spite of this, Russian households are able to
partially smooth consumption when they are hit by such shocks (Notten & Crombrugghe
de, 2006; Skoufias, 2003). But how do these households smooth consumption? Strategies
that worked during Soviet times may or may not work anymore while the changing
structures in the economy may provide new, perhaps market-based, smoothing
opportunities. In this paper, we want to explore how Russian households smooth
consumption.
To guide our analysis we propose a conceptual framework to analyze households’
consumption smoothing strategies. Central in this framework is a typology of
consumption smoothing strategies which is based on what actions households may take to
1
smooth consumption. Then, we relate these smoothing strategies to possible institutional
smoothing partners and the assets that may be required to follow a particular smoothing
strategy. We apply this framework to Russia and empirically explore rich survey data to
find out what Russian household do at a given point in time and how these actions may
contribute to consumption smoothing. We focus on the 2003 survey to analyze a broad
range of indicators on smoothing actions. We also investigate whether the observed
patterns differ by levels of wealth and rural or urban areas.
By focusing on the household as the central institution to manage risks, the conceptual
framework offers an alternative way to analyze and interpret existing survey data without
a priori restricting the scope of the analysis to a particular smoothing mechanism or
smoothing channel. The results can be used to formulate hypotheses on household
smoothing behaviour and to delineate the features of an analysis beyond the exploration
offered in this paper; it provides information about which smoothing channels are worth
further investigating and which linkages have to be taken into account in a
country/community (or not). Moreover, the conceptual framework guides thinking about
the role, scope and type of government interventions and possible feedback effects to
other smoothing channels.
This paper is structured as follows; in section 0 we set out our conceptual framework and
in section 0 we explain the selection and characteristics of the household sample from the
Russia Longitudinal Monitoring Survey (RLMS) and point out in what way the range of
selected smoothing indicators are linked to the conceptual framework. Section 0 analyses
the smoothing indicators; it sketches a picture of how Russian households smooth
consumption, using which smoothing channels. Section 0 concludes with a summary of
the main findings and hypotheses and discusses the relevance of followed research
2. Conceptual framework
Being able to smooth consumption reflects an important dimension of well-being as it
reflects people’s capacity to satisfy their (basic) needs today as well as tomorrow, despite
the existence of risks and the occurrence of shocks. Studies analyzing the relation
between income and consumption show that, over time, household consumption is
considerably smoother than income; a reduction (increase) in household income is not
accompanied by a similarly large decline (increase) in consumption. Although there is
considerable evidence that consumption smoothing takes place in both developed and
developing countries, the economic literature also shows that the actual smoothing
mechanisms employed can be very context specific, especially in developing economies.2
Mechanisms that work for one group, country or region do not work for others or are not
accessible. Moreover, households may use various smoothing mechanisms that
complement each other. It is important to better understand how households smooth
consumption, not only for academic purposes but also for governments that wish to
improve the capacities of their citizens to manage risks.
In this section we develop a conceptual framework which guides the exploration of
potential smoothing mechanisms but that does not restrict the particular forms they may
take in various environments. Central in the framework is a typology of consumption
smoothing strategies, with each strategy depicting a different smoothing mechanism.
Subsequently, we define a range of institutional counterparts and assets that can be used
to follow a particular smoothing strategy. The combination of a smoothing strategy,
institutional counterpart and required assets reflects a specific smoothing channel. We
take the perspective of the household as point of departure as the household reflects the
first risk sharing level for individuals in many societies, including our case-study Russia.
2
Table 1: Typology of consumption smoothing strategies
Strategies Consumption smoothing mechanism
Ex ante – create alternative funding sources in case future income falls short (mitigating strategies)
Accumulation of financial capital
Financial savings finance future consumption.
Accumulation of physical capital
Physical assets can be sold to finance consumption but they also
contribute current consumption and/or can be used as physical collateral for a loan or credit.
Seek insurance Insurance mitigates the impact of shocks by providing resources to finance consumption when a particular contingency occurs.
Ex post – create alternative funding sources when current income is insufficient (coping strategies)
Adjust income generating activities
Generate additional income to finance consumption
Seek loans or credit Loans or credits finance consumption.
Seek transfers Transfers finance consumption.
The analysis assumes a one generation – one period world. In this world, wealth is not
accumulated across generations; any existing wealth has been accumulated by the
household itself. Each household has to produce for itself, exchange its home production
for goods (or money) or sell its labour on a labour market (or a combination of all of
this). In this world, households face the risk of not being able to cover their basic needs.
In order to reduce the impact of this risk, households may follow a combination of
different consumption smoothing strategies (Table 1). We distinguish six strategies or
actions that can be grouped under two broader categories; ex ante strategies and ex post
strategies. Each strategy reflects a distinct smoothing mechanism. The ex ante or
mitigating strategies create alternative funding sources in case future income falls short of
what is expected. These strategies imply that part of current income is reserved for future
contingencies. We distinguish between financial and physical capital accumulation
because physical capital may additionally contribute to current consumption (if durable)
and can also function as collateral for using other smoothing mechanisms (i.e. getting a
loan). Insurance, on the other hand, only provides funding when a particular contingency
materializes. The ex post or coping strategies are employed to create alternative funding
We distinguish three different mechanisms; additional income generating activities (i.e.
increase labour supply, home production or the selling of home produced goods), seeking
credit/loans or seeking transfers.
To follow a particular consumption smoothing strategy, households may use different
institutions. Take for instance the borrowing strategy; households can borrow funds from
financials institutions, informal money lenders, family and friends or by buying products
on credit. A particularly useful concept for thinking about consumption smoothing
strategies and the possible smoothing partners of households is the Welfare Pentagon (C.
Neubourg de, 2002). The Welfare Pentagon represents the five core institutions that
households may use to satisfy current and future needs in a given society: family,
markets, social networks, membership institutions and public authorities (Figure 1).3
Even though historical and geographical appearances differ, these institutions are found
in all societies across time and locations. The relevance of each institution and the
exchange relations between households and these institutions may differ by society.
Households use these institutions to generate income but also to smooth consumption;
labour markets, product markets and capital markets allow households to trade and
exchange in order to secure resources to satisfy the main needs at a certain moment. On
the labour market households exchange effort against a (future) wage; on product markets
households trade effort against a (future) profit; on the capital market households trade
income against future income by investments, savings, insurances, borrowings and the
like. Families, social networks and membership institutions address the risk of not being
able to satisfy basic needs by means of various (and different) mechanisms of solidarity.
Membership institutions are institutions of which individuals can become a member and
from which they can resign. Examples of such institutions are unions, mutual insurance
companies, co-operatives, neighbourhood associations or saving and credit societies.
3
Public authorities can assist households directly by means of public social protection
(pension schemes, child benefits, unemployment insurance) but also indirectly by
enforcing contracts through a judicial system, introducing legislation aimed at correcting
market failures (such as minimum reserve requirements for banks). However, the
household can also internalize income generating activities and consumption smoothing
[image:9.612.122.482.241.500.2]by self-sufficient home production, accumulating physical assets or holding cash savings.
Figure 1: Welfare Pentagon
Source: (C. Neubourg de, 2002)
In addition to time or effort, following a specific consumption smoothing strategy
typically also requires some kind of asset. Assets can be financial (cash, money on a bank
account, stocks), physical (land, house, machines, jewellery), human (education, skills),
social (family ties, acquaintances) or collective (citizenship, contribution record).
Combining the typology of consumption smoothing strategies in Table 1 with the
institutions in the Welfare pentagon and the notion that each consumption-smoothing
channel requires some kind of input or investment, we obtain the possible consumption
Table 2. For instance, households can buy an insurance against certain risks on financial
markets using part of their financial assets to pay the insurance premium. Alternatively,
households can be insured for certain risks by public authorities through paying taxes or
social insurance contributions or simply because they are a citizen. On the other hand,
they can rely on social networks or family to compensate them after a shock occurs.
Depending on the characteristics of these arrangements a social input is required (promise
of reciprocity, ‘good’ reputation or family relation). Alternatively, households can also
adjust their income generating activities i.e. supply more labour, sell more home
produced goods and increase home production.
We further assume that households differ in their capacities to produce wealth, in their
exposure to risks which endanger the production of wealth and in their degree of risk
aversion. Together with the initial wealth distribution, these factors result in households
adopting different income generating and consumption smoothing strategies. The
differences in the economic activities of households lead to an income distribution and a
corresponding consumption distribution. In that distribution, some households are poor in
the sense that they have not enough wealth to satisfy their basic needs (according to a
pre-set poverty definition). More importantly, differences in the place households take in
the income distribution will lead to behavioural differences in terms of consumption
smoothing strategies. This will change their place in the income distribution, or
alternatively, reinforce it.
Depending on the community or country, some smoothing channels may be more
prevalent than others. It is also possible that several institutions are active in providing
assistance with the same type of consumption smoothing. This may be because a part of
the population does not have access to a particular consumption smoothing channel
because it lacks the required assets to establish an exchange relationship with an
Table 2: Consumption smoothing channels
Strategies/Actions Institutional counterpart
Assets needed by household
Ex ante – create alternative source of funding in case future income falls short (mitigating strategies)
Accumulation of financial capital
Market (financial)
Household
Membership institution
Financial assets (liquid assets)
Accumulation of physical capital
Market (financial)
Household
Financial assets (liquid assets)
Seek insurance Market (financial)
Social networks / Family Public authorities (social protection policies) Membership institution
Financial assets (insurance policy), social assets (reputation, relations), collective assets (citizenship, contribution history / rights) or membership (i.e. trade union)
Ex post – create alternative funding sources when current income is insufficient (coping strategies)
Adjust income generating activities
Market (goods – labour)
Household
Labour, productive assets, financial assets (working capital)
Seek loans or credit Market (financial)
Social networks / Family
Market (goods)
Membership institution
Physical assets (collateral), social assets (reputation, relations)
Seek transfers Social networks / Family
Public authorities (social protection policies)
Social assets (reputation, relations), collective assets (citizenship, rights)
wealth entrepreneurs to obtain credits from formal financial markets is partly explained
Instead, this person may obtain a loan through his social network where reputation,
kinship or social pressure may function as some kind of ‘social’ collateral.
The above framework helps to analyze consumption smoothing behaviour because it
provides a general framework of thought which encompasses most, if not all, potential
consumption smoothing strategies of households in a society. In the next part, we use this
framework to formulate and classify a wide range of indicators of consumption
smoothing channels in Russia. There are, however, a number of aspects that the
conceptual framework does not directly address. Firstly, by taking the household level as
the unit of analysis and a one period analysis, we abstract from household formation as
the ultimate consumption smoothing strategy of individuals but it also implies that we do
not analyze the role of human capital investment.4
Secondly, the framework categorizes a range of actions as potential consumption
smoothing strategies but it does not indicate which strategy would be preferable on what
grounds. One concern in the development literature is that some households smooth
consumption using less efficient and effective channels and are thereby unable to
improve their lives (Dercon, 1998; Eswaran & Kotwal, 1989; Rosenzweig, 1988;
Rosenzweig & Wolpin, 1993; Zimmerman & Carter, 2003). Due to a combination of risk
aversion and low wealth, households are not willing to take actions which increase the
probability that their consumption will ever fall below a certain minimum level. This
‘disaster management’ leads to different asset accumulation strategies for low and high
wealth households, where the latter group is more successful in improving their welfare
in the long term. Lack of access or failure of certain consumption smoothing channels,
are additional reasons for the existence of a poverty trap. Whether a particular smoothing
channel is welfare improving or not, is highly context dependent. In Western Tanzania
high wealth farmers accumulate cattle while low wealth farmers engage in low risk-return
off farm activities (Dercon, 1998) while in Georgia non-farm activities are seen as a way
out of poverty (Kobaladze, November 2002). Alternatively, in Burkina Faso low wealth
4
individuals invest relative more in buffer assets (grain) than in productive assets
(land)(Zimmerman & Carter, 2003). While the farmers in Tanzania and Burkina Faso can
choose to follow either strategy, the rural inhabitants of Georgia indicate that there is no
opportunity to engage in non-farm activities. Given this context specificity, we do not
attempt to specify a priori a preference ranking of smoothing strategies or channels.5
Finally, certain smoothing channels may be more suited to help manage particular types
of shocks or risks than other channels. Some consumption smoothing channels are
relatively successful to deal with shocks arising from idiosyncratic risks, but fail when
there is an aggregate or covariant shock such as an economic crisis or a natural disaster
(Hoogeveen, 2001; McKenzie, 2003; Skoufias, 2003; Udry, 1994). Moreover, if a
household perceives that it is vulnerable to a particular kind of risk, it will adjust its
consumption smoothing strategies accordingly. For instance, Indian households with a
higher risk of illness or bad health choose to accumulate more liquid and fewer
productive assets (Kochar, 2004) and wage arrears induce Russian households who are
more vulnerable to that risk to save more (Guariglia & Kim, 2003). A possible extension
of the framework could encompass the inclusion of various types of risks.
3. Data and methodology
Previous research has shown that Russian households have been capable of partially
smoothing their consumption despite suffering from many income shocks during the
transition period (Notten & Crombrugghe de, 2006; Skoufias, 2003). The objective of our
empirical analysis is to get an impression of how Russian households currently smooth
consumption after more than a decade of structural change. We use the conceptual
framework developed in the previous section to select indicators of possible smoothing
channels from rich survey data. Subsequently, we explore the prevalence and differential
use of consumption smoothing channels by Russian households at a given point in time
5
(2003).6 We restrict our focus to a single year because we want to study indicators for a wide range of smoothing channels. The resulting analysis is interesting because the
conceptual framework guides the use of typical household survey data to create a broad
and novel household perspective on the use of consumption smoothing channels. This
broad perspective is important because a household most likely uses a range of smoothing
channels at the same time and the use of smoothing channels can differ with household
characteristics. The results can be used to formulate hypotheses about consumption
smoothing behaviour and to indicate areas (or institutions) in which government
intervention is needed to enhance households' risk management. However, more rigorous
analysis is needed to prove whether the identified channels indeed have a smoothing
function, to what extent and how they help households to smooth consumption, and how
government intervention can enhance the functioning of a given channel.7
We use the Russian Longitudinal Monitoring Survey (RLMS) to analyze the prevalence
of consumption smoothing channels used by Russian households.8 The sample includes
all households that have been observed annually in the RLMS from 2000 to 2003; this
balanced panel consists of about 2,700 households. We selected a panel, because we also
want to study differences in the use of smoothing channels for different levels of wealth.9
10
As explained before, depending on the level of wealth, households may follow
different smoothing strategies using different channels. To approximate the wealth of a
6
After the 1998 financial and economic crisis Russia experienced a period of sustained economic recovery combined with ongoing structural reforms. Smoothing behaviour of households in times of large aggregate shocks (and the outcome in terms of consumption smoothness) can be very different from behaviour in more stable periods (Hoogeveen, 2001; McKenzie, 2003; Skoufias, 2003; Udry, 1994).
7
Such analysis is beyond the scope of this paper.
8
Detailed information on the RLMS project is provided on the following website:
http://www.cpc.unc.edu/projects/rlms/home.html.
9
The RLMS does not have post-stratification weights for its panel dimension. In Gassmann and Notten (2006) we compare the characteristics of the cross-sections with the five year balanced panel (2000-2004) and find a number of differences. Urban households (especially from Moscow and St Petersburg), are underrepresented in the panel. Households with children are somewhat overrepresented while there are fewer single person households in the panel sample. Average income and expenditures are somewhat lower in the panel. Despite the level effects (i.e. poverty rates are somewhat higher in the panel) we find that both samples reflect the same trends (time) and similar differences between subgroups of the population (rural-urban and by expenditures). This is in line with the findings of an earlier attrition study of the RLMS by Heeringa (1997).
10
household we average annual equivalent household expenditures over the period 2000 to
2003 and divide the resulting distribution in quintiles. Equivalent expenditures are
obtained by dividing household's expenditures by its household specific poverty line.11
The resulting values thus reflect the average distance of a household’s living standard
relative to its absolute poverty line; a value below 1 indicates that a household, on
average, lived in poverty during the period 2000-2003 and vice versa for an average
[image:15.612.92.528.232.410.2]above 1.
Table 3: Average equivalent expenditure distribution (2000-2003)1
Characteristics Equivalent expenditures (relative to poverty line)
Average 2.93
Median 2.35
Ratio at 5% of distribution 0.83 Ratio at 95% of distribution 6.80
Standard deviation 2.44
Average by quintile
1 1.01
2 1.71
3 2.37
4 3.25
5 6.32
Note: 1 We obtained the distribution as follows. First, we divided households' annual expenditures by its household specific poverty line to adjust for demographic differences between households and differences between regional price levels. Subsequently, we averaged households' equivalent annual expenditures over the period 2000-2003. Finally, we divided the resulting household distribution in 5 equally sized quantiles. Source: Own calculations RLMS
Table 3 lists some characteristics of this distribution. Clearly, the distribution is very
dense at low expenditure levels; only the fifth quintile has considerably higher
expenditures (on average more than six times the value of the poverty line). Quite a
number of households were living in the vicinity of the absolute poverty line from
2000-2003; average expenditures in the lowest quintile are about 1 and that of the second
quintile is 1.7.12 The group of households in the lowest quintile can be considered as
chronically poor according to a common definition of chronic poverty (having average
11
We use the absolute poverty lines provided in the RLMS data. These household specific poverty lines are adjusted for the size and composition of the household and valued at regional price levels. We further use the expenditure and income variables as constructed by the RLMS which include the value of home produced (and consumed) goods (http://www.cpc.unc.edu/projects/rlms/home.html).
12
expenditures below the poverty line over a given period). But with a somewhat higher
subsistence level, that label could even be applied to many households in the second
quintile. Table 4 further summarizes characteristics of the households for the whole
sample, by rural13 and urban settlement area and by average expenditure quintiles. A
large part of Russian households live in urban areas (62%) and those households are more
likely to be found in the higher regions of the average expenditure distribution.
[image:16.612.91.526.221.532.2]
Table 4: Characteristics of household panel (2000-2003) in 2003
Even though the multi-purpose RLMS survey contains a wealth of information, it is not
designed or structured specifically to analyze consumption smoothing behaviour and thus
only allows us to analyze a limited part of the puzzle. On the other hand, it also allows us
to identify which pieces of the puzzle are missing. Using the conceptual framework as a
guide, we selected a range of smoothing indicators from the 2003 RLMS questionnaires
(Table 5). Some of the selected variables function as indicators for a particular
13
We included households living in semi-urban settlement areas in the rural group because this group is too small too analyze separately and appears to be more similar to rural households.
Average expenditure quintiles Total Urban Rural 1 2 3 4 5 # of observations 2,718 1,690 1,028 544 544 543 544 544 Share population (%) 100 62.3 37.8 20.0 20.0 20.0 20.0 20.0 Urban area (%) 62.3 100 0 51.1 57.4 64.8 69.7 67.8 Household size (%)
1 19.9 21.3 17.5 15.6 18.0 16.9 23.4 25.4 2 28.7 30.2 26.2 24.8 22.1 30.9 32.0 33.7 3 24.3 26.0 21.5 26.8 26.1 24.5 21.7 22.5 4 16.7 15.8 18.2 16.5 22.1 17.3 14.9 12.7 >4 10.4 6.4 16.6 16.2 11.7 10.3 8.1 5.7 Household types (%)
Single adult 3.6 4.1 2.8 5.0 2.9 2.0 3.5 4.8 Single elderly 16.2 17.1 14.7 10.7 14.9 14.9 19.9 20.6 Adult couple 7.8 8.2 7.0 8.5 5.0 9.6 6.4 9.4 Elderly couple 9.9 10.0 9.8 4.4 7.2 9.0 14.2 14.9 Single caretaker with children 4.6 5.4 3.4 6.6 4.0 5.3 3.5 3.7 Adults with children 21.1 22.0 19.7 20.8 24.1 19.7 20.0 20.8 Extended family 9.0 7.3 11.9 10.7 12.1 9.0 7.2 6.1 Elderly and adults, no
children
11.7 10.9 13.0 12.9 12.0 12.9 12.5 8.3
Other households 16.0 15.0 17.7 20.6 17.8 17.5 12.9 11.4 Average income1 7,465 7,868 6,801 4,406 5,920 7,425 7,900 11,682 Average expenditures1 8,711 9,098 8,074 3,390 5,383 7,188 8,981 18,626
consumption smoothing strategy that is followed, but do not provide sufficient
information about the institutional counterpart or the required assets. For instance, as
indicators for the ‘seek loans or credit’ strategy we use a set of variables indicating
whether a household has debt and whether it made loan repayments but we do not know
which institution provided the loan. Similarly, we know about a range of physical assets
owned by a household but we do not know whether any of these were used as collateral
for obtaining the loan. However, for many indicators we can identify the institutional
counterpart or at least argue which institution is the most likely the counterpart. When a
household mentions it provided a loan or reported having received repayments from
loans, we know that this household is involved in the provision of loans, most likely to
other households. Or alternatively, if a household reported having saved money for
interest it is likely to have saved using a financial market institution. Finally, the RLMS
contains quite a lot of information on the giving and receipt of gifts but the information is
insufficient to classify particular gifts either as insurance or transfer seeking strategies. As
can be seen in Table 5, there are indicators for every smoothing strategy and in many
cases part of the consumption smoothing channel can also be identified. We also included
an indicator for the consumption smoothing ability of households indicating the
self-estimated survival period of the household in case it would lose all sources of income.
In our conceptual framework we distinguish between income generating activities and
consumption smoothing activities but we also include the adjustment of income
generating activities as one of the ex post coping strategies. The 2003 RLMS
questionnaires did not include any specific shock response questions, which makes it
difficult to distinguish between normal income generating activities and post shock
adjustments in those activities. Given this difficulty, we also included a range of
indicators on income generating activities (Table6) in addition to the shock adjustment
Table 5: Indicators of consumption smoothing channels in the RLMS
Institution Indicator Accumulation of financial capital
- Having saved (last month)
Financial market - Has saving on interest bearing account
- Has bought (or derived income from) stocks and/or bonds (last month)
Accumulation of physical capital
Household - Asset ownership: owns house, land, durables
- Income from (sale of) assets: rents property, sold property, sold jewellery, currency or depleting savings (last month)
Seek insurance
Financial market - Income from insurance payments (last month) - Expenditures on premiums (last month) Public authorities (social
security)
- Incidence of social security type and income share of benefits such as pensions and unemployment benefits
- Pension rights (private and/or federal fund)
Social networks / family - Gift giving/receiving (yes/no, amounts, income share and to/from who(m)) (last month)
Adjust income generating activities Labour market / goods
market
- Having a 2nd or 3rd job - Having an informal job Seek loans or credit
- Has debt (yes/no, expenditure share) - Made loan repayments (last month)
Social networks / family - Loans provided by households (last month) - Net lending (last month)
Labour market - Access to loans from employer (yes/no) Goods market - Has unpaid utility bills (yes/no, real value) Seek transfers
Public authorities (social assistance)
- Incidence of social assistance type and income share of benefits such as child benefits and housing benefits
Social networks / family - Gift giving/receiving (yes/no, amounts, income share and to/from who(m)) (last month)
Overall ability of consumption smoothing
Household - self-reported survival time in case a household looses all income sources
Note: All indicators are analyzed at a household level. Those indicators originating from individual
questionnaires have been summarized at the household level. For instance, if an adult mentioned he/she had a second job, a household level variable was created indicating that at least one household member had a second job.
indicating whether at least one household member had a second or third job and similarly
for having an informal job. These variables can be interpreted as second-best responses to
unemployment, underemployment and other problems with income generating activities
(wage arrears, forced leave, non-cash wage payments, unsuccessful home production
services, selling home produced foodstuffs) the institutional counterparts can be labour
and goods markets. Table6 displays a range of income generating activities
distinguishing between home production, labour supply and entrepreneurial activities. We
[image:19.612.84.531.194.388.2]further discuss the interpretation and limitations of the indicators in the next section.
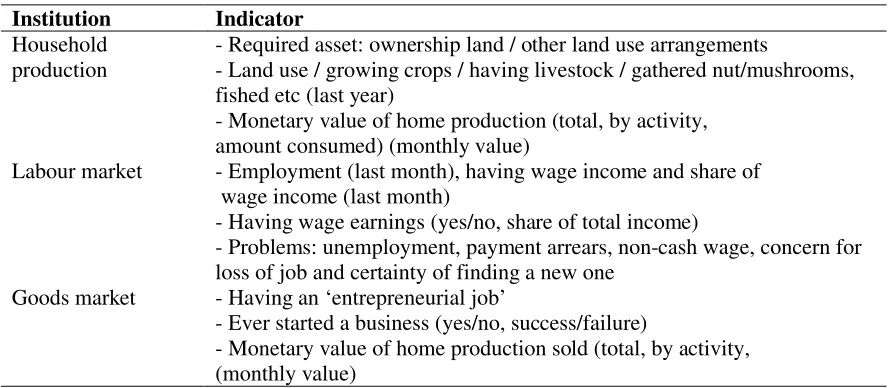
Table 6: Indicators of income generating activities in the RLMS
Institution Indicator Household
production
- Required asset: ownership land / other land use arrangements
- Land use / growing crops / having livestock / gathered nut/mushrooms, fished etc (last year)
- Monetary value of home production (total, by activity, amount consumed) (monthly value)
Labour market - Employment (last month), having wage income and share of wage income (last month)
- Having wage earnings (yes/no, share of total income)
- Problems: unemployment, payment arrears, non-cash wage, concern for loss of job and certainty of finding a new one
Goods market - Having an ‘entrepreneurial job’
- Ever started a business (yes/no, success/failure)
- Monetary value of home production sold (total, by activity, (monthly value)
Note: All indicators are analyzed at a household level. Those indicators originating from individual
questionnaires have been summarized at the household level. For instance, if an adult mentioned he/she had a second job, a household level variable was created indicating that at least one household member had a second job.
4. Consumption smoothing in Russia: what do Russian households do?
What do households in Russia do to ensure that they have sufficient resources to finance
their (basic) needs today as well as tomorrow? The conceptual framework developed in
this paper identifies a wide range of possible strategies, institutional counterparts and
required assets and we have selected a considerable group of indicators for some of these
possibilities. We now analyze and interpret the descriptive results and simple significance
tests with the aim to sketch a picture of which consumption smoothing channels Russian
households may use or not. We also briefly analyze indicators of household's income
smoothing activities because we the adjustment of income generating activities is also
included as a consumption smoothing strategy. This resulting picture is not complete (by
far) and alternative interpretations that are also consistent with the observed results can
gives an indication of the prevalence of certain consumption smoothing channels as well
as the differential use of these channels by various groups of households (we distinguish
between wealth quintiles and rural/urban settlement area). A particular interest for the
context of Russia is to explore the extent to which households use markets to smooth
consumption. Thus, the output of this paper does not consist of proving the existence,
functioning and motivations for these consumption smoothing channels but it yields
interesting and relevant hypotheses on how households smooth consumption in Russia.
Testing these hypotheses requires more theoretical and empirical work and we discuss
some of these options for further research.
This section first discusses households' perceptions on their smoothing abilities, followed
by the analysis of the indicators for ex ante and ex post consumption smoothing
strategies, and is concluded by viewing some indicators on income generating activities.
4.1 Perceived ability of consumption smoothing
We start with an impression of households’ self-estimated consumption smoothing
abilities (Table 7). The respondent of the household questionnaire was asked to estimate
the period that the household could survive without income; 83% of the Russian
households expect they could only survive less than a month if they would lose all
income sources. The results of the Wald test suggest that households in rural areas and
households in higher average expenditure quintiles estimate having longer periods of
survival without income. We will discuss below that these two groups of households are
likely to use different smoothing mechanisms and channels. The case that was sketched
to the respondents is extreme but it nevertheless shows that, unless alternative income
sources are found, the time horizon of consumption smoothing opportunities for Russian
households is limited to months rather than years.14
14
4.2 Ex ante consumption smoothing strategies: asset accumulation and insurance
After a decade of severe macro-economic instability, the new millennium brought Russia
a period of stable growth which was also transmitted into sustained improvements in
living standards. The poverty rate, peaking at 34% in 1998, declined strongly to 12% in
2003 (Notten & Crombrugghe de, 2006). As noted in Table 4, household income and
consumption increased considerably during this period. In such good times, it makes
sense to use part of this extra income to re-build capital stocks or to arrange insurance.
We look for evidence of these strategies and their corresponding channels using a
snapshot of this period (4th quarter 2003). Table 8 to Table 12 display the results for the indicators of ex ante smoothing channels.
Surprisingly however, only 13% of Russian households reported to have saved any
money in the month prior to the survey (Table 8). There is virtually no investment in
more sophisticated financial products such as stocks and shares; few households report
buying such products or receive income from them. The percentage of saving households
is higher in urban areas and increases as average expenditures increase; 4% of the
households in the lowest quintile save as compared to 18% in the 4th and 5th quintiles. Unfortunately, the information on savings does not unambiguously reveal whether
households save using financial markets or store cash in their homes. However, few
households get interest payments for their savings (less than 3%) which suggests that still
a large part of household savings are in cash and may be deposited under the mattress
instead of on a bank account. Buying an insurance product from a financial market
Table 7: Self-perceived ability of consumption smoothing
All Urban Rural Test1 Average expenditure quintiles Test
% of households Obs.2 1 2 3 4 5
How long can the household survive if all income is lost?
More than 6 months 4.2 2.6 6.9 2.0 2.7 2.5 4.4 9.4
A few months 13.2 11.7 15.7 8.5 10.4 14.9 15.3 16.9
Less than a month 27.2 25.6 29.9 21.3 30.5 28.4 27.1 28.4 Less than 2 weeks 12.8 13.7 11.3 11.9 11.3 15.4 13.0 12.5 Less than 1 week 26.5 28.8 22.5 31.4 29.9 24.9 24.4 21.9 Not even 1 day
2,581
16.1 17.6 13.6
.05
24.9 15.2 13.9 15.8 10.9
.01
Note: 1 Wald test on difference means urban-rural and average expenditure quintiles (controlling for clustering effects): not significant (ns), significant at 10% (.1), significant at 5% (.05) and significant at 1% (.01). 2 The full sample consists of 2,718 households. The number of observations in this column can be different due to missing information in the questionnaire and / or because the information is only applicable to a sub-sample of the households.
[image:22.792.68.727.293.384.2]Source: Own calculations RLMS
Table 8: Accumulation of financial capital – Financial market / Household
All Urban Rural Test1 Average expenditure quintiles Test
% of households Obs.2 1 2 3 4 5
Has savings 2,718 12.6 14.1.1 10.1 .1 4.2.01 9.6 12.9 18.2 18.2 .01 - with interest payments 1,914 2.8 3.5 1.9 ns 0.7 3.1 3.0 2.3 3.3 ns
Bought bonds/shares 2,718 0.1 0.2 0 ns 0 0 0 0.6 0 ns
Received payments from bonds/shares
2,718 1.1 1.4 0.6 ns 0.6.1 0.7 0.4 1.5 2.2 .1
Note: 1 Wald test on difference means urban-rural and average expenditure quintiles (controlling for clustering effects): not significant (ns), significant at 10% (.1), significant at 5% (.05) and significant at 1% (.01). 2 The full sample consists of 2,718 households. The number of observations in this column can be different due to missing information in the questionnaire and / or because the information is only applicable to a sub-sample of the households.
Table 9: Accumulation of physical capital - Household
All Urban Rural Test1 Average expenditure quintiles Test
% of households Obs.2 1 2 3 4 5
Household derives income from physical assets
Property sales 2,713 1.8 1.0 3.1 ns 2.2 1.5 2.0 1.1 2.0 ns Renting property 2,713 1.1 1.5 0.5 .05 0.6 0.9 1.5 1.7 0.9 ns Sold jewellery or currency or
depleted savings
2,708 5.4 5.8 4.7 ns 1.3 3.0 5.0 5.7 12.0 .01
Housing 2,710
Own residence 2,533 93.5 94.1 92.5 89.3. 91.3 94.5 94.3 98.0 Rented residence 94 3.5 1.6 6.5 6.5 4.8 2.0 2.8 1.3
Dormitory 83 3.1 4.3 1.0 4.2 3.9 3.5 3.0 0.7
Owns land3 1,687 74.5 77.5 71.8
ns
70.5 71.1 76.5 76.8 77.7
.01
Owns durables
Black & white TV 2,718 18.2 15.6 22.4 .05 23.7 18.9 17.3 17.7 13.3 .01 Colour TV 2,718 85.0 90.4 76.1 .01 70.6 83.5 90.1 88.8 91.9 .01 VCR 2,718 41.1 45.5 33.9 .01 25.4 38.1 44.2 45.4 52.5 .01 Computer 2,718 9.5 13.4 3.0 .01 3.3 6.3 8.5 12.5 16.8 .01 Car 2,718 29.2 28.9 29.6 ns 12.3 25.7 29.8 34.6 43.5 .01 Fridge 2,718 94.4 97.6 89.2 .01 84.6 93.8 97.6 97.6 98.7 .01 Washing machine 2,718 81.8 83.7 78.6 ns 71.7 82.4 86.9 84.6 83.4 .01 Dacha4 1,880 28.6 30.2 14.2 .01 15.5 21.2 31.8 33.2 37.0 .01
Note: 1 Wald test on difference means urban-rural and average expenditure quintiles (controlling for clustering effects): not significant (ns), significant at 10% (.1), significant at 5% (.05) and significant at 1% (.01). 2 The full sample consists of 2,718 households. The number of observations in this column can be different due to missing information in the questionnaire and / or because the information is only applicable to a sub-sample of the households. 3 Land owned by family. 4 Only urban and semi-urban settlement areas (semi-urban is categorized under rural).
money on insurance premiums (Table 10).15 These explorations suggest that financial markets play only a very limited role in households’ smoothing strategies. One
explanatory factor for this finding may be that households’ confidence in Russia’s
financial institutions has not yet been restored, despite the reforms in this sector after the
1998 banking crisis.16 During this crisis, many households lost their savings as a result of
the bankruptcies.17
If this explanation holds true than it would make sense that households prefer to
accumulate physical assets by, for instance, buying durables.18 In 2003, expenditures on
durables were restored to their mid-ninety levels but Mroz et al (April 2004) report that
such expenditures are mainly made by higher income groups. Table 9 shows that many
households own durable goods such as a TV, fridge and washing machine but that lower
wealth households and rural households own fewer durables.19 We have little information
on whether these assets are sold when other income sources fall short. Using a set of
questions only asked in the 1998 RLMS survey, Lokshin and Yemtsov (February 2001)
report that only 4% of Russian households reported to have sold belongings in order to
cope with the impact of the 1998 crisis. The only indicator available is a grouping of
strategies including that of selling jewellery; about 5% of the household reports to have
sold jewellery, currency or depleted savings in 2003.20 Especially the wealthiest
households sold such assets or depleted savings (12%).
15
There is no information available on the type of insurance products bought.
16
Although reforms have been taking place since 1998, a series of World Bank and OECD reports from 2001 and 2002 opines that reforms have been very slow and insufficient (Fuchs, 2002; OECD, 2001a, 2001b, 2002; World Bank, 2003). Comparison with other countries shows that the Russian banking system is small by regional standards and underdeveloped compared to countries with similar per capita income. The lack of credit and deposit insurance has the consequence that banks are hesitant to provide credits to a wide variety of enterprises while households do not trust banks to manage their savings appropriately.
17
Using the cross-section of round 8 (1998) of RLMS we find that about 10% of the household reported to have lost a large part (on average 82%) of their savings.
18
Guariglia and Kim (2003) and Foley and Pyle (September 2005) analyze household savings in Russia incorporating expenditures on durable goods as savings.
19
These durable goods are typically rather old; the average age of a car, fridge, freezer, washing machine is above 10 years old.
20
Physical assets such as a house or land may be used as physical collateral or as a source
of income (rent). The majority of households own their residence but low wealth
households are somewhat more likely to rent a residence as opposed to owning it (Table
9). However, even when real estate is privately owned it may be difficult to use a house
or apartment as financial collateral for a loan; a World Bank study (October 2003) on the
mortgage and the housing market in Russia reports that there are information problems
regarding the assessment of the market value of housing and that it is extremely difficult
to expropriate a house from its defaulting owner. Land ownership, on the other hand, is
high; three quarters of the households own a piece of land. As we will see below, most
households use land to produce foodstuffs (including those living in urban areas).
To sum up, most households own a stock of physical assets and expenditures on durable
goods have picked up again signalling increased accumulation. However, few households
report income from the sale or renting of assets and information problems severely
restrict the selling property or the use of it as physical collateral. The information
discussed above suggests that there is little evidence that these assets are used as
buffer-stock strategy or as a means to generate (cash) income. It seems that Russian households
Table 10: Seek insurance – Financial market
All Urban Rural Test1 Average expenditure quintiles Test
% of households Obs.2 1 2 3 4 5
Insurance payout 2,718 0.2 0.2.05 0 .05 0 0.2 0.2 0.2 0.2 ns Premium paid 2,718 4.6 4.3 5.3 ns 2.0.01 3.1 3.3 5.2 9.6 .01
Note: 1 Wald test on difference means urban-rural and average expenditure quintiles (controlling for clustering effects): not significant (ns), significant at 10% (.1), significant at 5% (.05) and significant at 1% (.01). 2 The full sample consists of 2,718 households. The number of observations in this column can be different due to missing information in the questionnaire and / or because the information is only applicable to a sub-sample of the households.
Source: Own calculations RLMS
Table 11: Seek insurance – Public authorities (social security)
All Urban Rural Test1 Average expenditure quintiles Test
% of households Obs.2 1 2 3 4 5
Pensions
Receipt pension, of which 2,718 58.5 57.3 60.5 ns 52.0 55.3 59.5 63.6 62.1 .1 - Old age 1,590 81.7 82.0 81.2 ns 74.9 81.7 80.8 85.3 84.6 .01 - Disability 1,590 17.3 16.4 18.7 ns 24.0 19.3 18.3 13.3 13.1 .01 - Survivor 1,590 5.0 3.9.1 6.8 ns 8.5 3.7 4.3 5.5 3.6 ns - Military 1,590 4.8 5.7.1 3.4 ns 2.1 3.0 4.6 8.1 5.3 .05 - Social security 1,590 1.1 0.5 2.1 .05 0.4 2.0 1.9 0.6 0.9 ns
- Other 1,590 5.1 5.0 5.3 ns 6.7 3.7 4.4 3.8 7.1 ns
Income share of pensions 1,588 0.5 0.5 0.5 ns 0.6 0.6 0.5 0.6 0.5 .05 Building up pension rights
Private fund 1,782 16.5 21.4 9.1 .01 12.1 15.6 18.2 19.4 18.5 ns Federal fund 1,855 97.8 97.7 97.9 ns 98.1 98.8 98.4 99.1 94.1 .05 Unemployment benefits
Receipt benefit 2,718 1.4 1.4 1.5 ns 1.7 1.7 0.9 2.0 0.7 .1 Income share of benefit 38 0.1 0.2 0.1 ns 0.1 0.1 0.1 0.2 0.0 .05
Note: 1 Wald test on difference means urban-rural and average expenditure quintiles (controlling for clustering effects): not significant (ns), significant at 10% (.1), significant at 5% (.05) and significant at 1% (.01). 2 The full sample consists of 2,718 households. The number of observations in this column can be different due to missing information in the questionnaire and / or because the information is only applicable to a sub-sample of the households.
[image:26.792.70.727.247.468.2]Table 12: Seek insurance / Seek transfers – Family / Social network
All Urban Rural Test1 Average expenditure quintiles Test
% of households Obs.2 1 2 3 4 5
Gives and/or receives gifts 2,717 47.1 50.2 41.9 .05 36.6 39.9 47.3 54.2 57.3 Net giving:
Giver only 535 41.8 40.2 45.0 23.6 35.9 44.0 47.5 50.5
Net gift giver 95 7.4 7.3 7.7 5.5 6.5 9.3 7.5 7.7
Net gift receiver 123 9.6 10.0 8.8 9.1 9.2 9.3 10.9 9.3 Receiver only 526 41.1 42.5 38.5
ns
61.8 48.4 37.4 34.2 32.5
ns
Given gifts 2,717 28.3 29.5 26.4 ns 14.3 21.0 30.3 36.4 39.8 .01 Income share of gifts given 769 0.24 0.19 0.35 .05 0.23 0.21 0.14 0.31 0.29 .01 Given to:
Parents 768 15.8 16.5 14.4 ns 7.8 11.4 19.5 14.1 19.5 .01 Children 769 49.9 45.4 58.3 .05 57.7 50.9 50.6 50.5 45.6 ns
Grandparents 767 1.3 1.8 0.4 .1 1.3 0.9 1.2 1.0 1.9 ns
Grandchildren 768 31.1 29.4 34.3 ns 28.2 30.7 32.3 36.9 26.2 ns Other people 768 31.0 35. 23.3 .05 24.4 28.1 30.1 28.3 38.1 .1 Gifts received 2,714 28.0 30.7 23.7 .05 28.3 26.0 27.1 29.2 29.5 ns Income share of gifts received 761 0.22 0.22 0.22 ns 0.23 0.21 0.19 0.20 0.25 ns Received from:
Parents 756 47.4 46.0 50.2 ns 49.7 55.0 46.3 46.2 40.5 ns Children 759 27.3 25.0 32.1 ns 23.4 22.1 26.5 29.8 33.8 ns
Grandparents 757 5.0 5.1 4.9 ns 7.8 3.6 4.1 5.7 3.8 ns
Grandchildren 756 1.7 2.0 1.2 ns 1.3 2.9 2.1 1.3 1.3 ns
Other relatives 758 19.3 20.4 16.9 ns 18.8 22.1 22.5 14.6 18.9 ns Friends 759 12.5 13.2 11.1 ns 13.0 10.6 12.2 8.2 18.2 .1 Former employer 759 6.9 8.3.1 3.7 .1 5.2 7.8 7.5 6.3 7.6 ns Social state organs 759 4.6 4.8 4.1 ns 5.8 3.6 3.4 5.1 5.0 ns
Other 759 3.3 4.3 1.2 .05 4.6 2.1 2.0 4.4 3.1 ns
Note: 1 Wald test on difference means urban-rural and average expenditure quintiles (controlling for clustering effects): not significant (ns), significant at 10% (.1), significant at 5% (.05) and significant at 1% (.01). 2 The full sample consists of 2,718 households. The number of observations in this column can be different due to missing information in the questionnaire and / or because the information is only applicable to a sub-sample of the households.
In their role as a provider (or legislator) of social security programmes, public authorities
provide insurance against the impact of risks such as (insufficient income at) old age,
unemployment or disability. The eligibility and benefit levels of such programmes are
contingent on citizenship and/or contributions history. Social security in Russia means
first and foremost pensions; 59% of the households receive some kind of pension and, in
recipient households, pensions make up on average half of total household income (Table
11).21 Receipt of an old age pension22 is most prevalent, followed by a disability pension. Interestingly, the incidence of pensions does not differ much across the population,
except for the lowest wealth quintile; this group of households is less likely to receive an
old age pension but considerably more likely to receive a disability pension (24% as
compared to a population average of 17%). The receipt of unemployment benefits and its
contribution to total income is very low.
Coverage of the (old age) pension system is very high; nearly every household has adults
reporting that they are building up (or built up) pension rights at the Federal fund. About
17% of the households have adult members that are also contributing to a private pension
fund23. However, these percentages a much lower for households in rural areas and in
lower wealth quintiles. Thus, the old age pension system in Russia plays an important
role in terms of benefit incidence (many households benefit), size of benefit (benefit is
high share of income) and coverage (virtually all citizens are insured). As for the
adequacy of pensions, the benefit does not guarantee a living standard above the poverty
line24 but pensioners and households with pensioners are considerably less likely to be
poor as compared to the rest of the population (MGSoG, 2006). Together, with the results
discussed in Table 12 and Table 13, we hypothesize that these relatively generous old age
21
The share of pension income may be overestimated because other income sources are more likely to be underreported (MGSoG, 2006).
22
In Russia, men above the age of 60 are entitled to an old age pension (for women above age 55). In addition in certain professions (military, mining) workers can retire at the age of 45 or after had a particular length of service (IAAC, October 2006; MGSoG, 2006).
23
Since 1998, workers can also contribute to a Private Fund by means of a notional individual account system (Kazianga, 2006).
24
pensions induce a specific inter-generational consumption smoothing channel whereby
elderly family members assist their offspring.
4.3 Ex post consumption smoothing strategies: transfers, credit and adjustment in income generating activities
In times of trouble, households can also rely on their family and (broader) social
networks such as relatives, friends or others. Depending on the motives and nature of
such exchanges, they could be labelled as insurance or transfer smoothing mechanisms.
When arrangements are reciprocal or involve risk-sharing they can be classified as
insurance. Arrangements based on altruistic motives may be characterized as transfers.
The RLMS does not provide much insight into the nature of such arrangements but it
includes a range of variables on gifts received and given by households. We use these
indicators to explore the existence of such solidarity based networks, including indicators
for the direction of gift giving/receiving and its relative importance (Table 12).25
A first observation is that the exchange of gifts is rather popular in Russia; 47% of the
households give gifts or receive them. What is very interesting is that households are
generally either receiving gifts or giving them to others. This observation supports the
interpretation of gifts as a consumption smoothing mechanism between households.26
Also in favour of this hypothesis is the proportionality in incidence rates of giving /
receiving as well as in the relative magnitude of the gifts; 28% of the households reported
giving gifts while 28% reported receiving them. The average value of the given gifts is
24% of total household income while the income share of a received gift represents on
average 22%. Thus, at a given point in time, Russian households are either giving or
receiving considerable gifts on a regular basis. Furthermore, most gifts occur within
family relations and the direction of flows goes from older generations to younger ones.
25
Households were asked to indicate if they have gratuitous received and given money / goods in the past month (to / from others that are not part of their household). If yes, the respondent estimated the monetary value of the gift. It is not clear what share has been given / received in cash and what in kind. Only for home produced food it would be possible to construct an estimate for the value of goods given to others.
26
Additionally, 31% of the gifts are given to other people while 13% of the received gifts
come from friends and 7% from former employers. The exchange of gifts seems to be a
relevant and popular smoothing strategy in Russia, especially within families.
There are however some differences between population groups suggesting that not
everyone is equally likely to make use of this smoothing mechanism. Urban households
are more likely to be involved in exchanging gifts (both giving and receiving), suggesting
that this smoothing channel is more important for urban areas. Nevertheless, when rural
households give, the value of this gift constitutes a higher share of income. Higher wealth
households give more often gifts but they are equally likely to receive them. But, even
though lower wealth households give less often gifts, those in the lowest wealth quintile
are not more likely to receive gifts. Moreover, the income shares of received gifts are
similar for all subgroups implying that the absolute value of the gift increases with
wealth. Gifts do not go more often towards those who are (supposedly) more in need.27
Explanations could be that lower wealth households have fewer social assets which
prevent them to use family and social networks to smooth consumption, or alternatively,
the smoothing counterparts of such households themselves have fewer means to assist
those households (or a combination thereof).
27
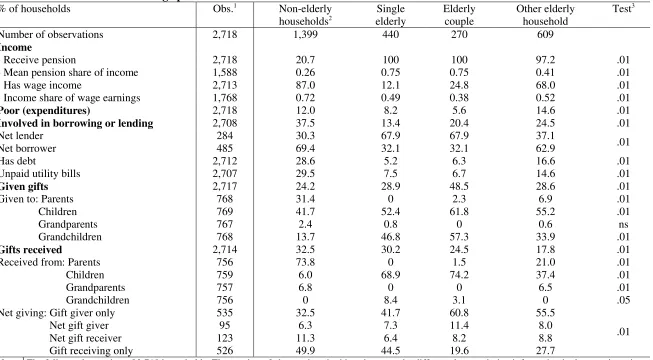
Table 13: Households with old-age pensioners
% of households Obs.1 Non-elderly
households2
Single elderly
Elderly couple
Other elderly household
Test3
Number of observations 2,718 1,399 440 270 609
Income
- Receive pension 2,718 20.7 100 100 97.2 .01
- Mean pension share of income 1,588 0.26 0.75 0.75 0.41 .01
- Has wage income 2,713 87.0 12.1 24.8 68.0 .01
- Income share of wage earnings 1,768 0.72 0.49 0.38 0.52 .01
Poor (expenditures) 2,718 12.0 8.2 5.6 14.6 .01
Involved in borrowing or lending 2,708 37.5 13.4 20.4 24.5 .01
Net lender 284 30.3 67.9 67.9 37.1
Net borrower 485 69.4 32.1 32.1 62.9 .01
Has debt 2,712 28.6 5.2 6.3 16.6 .01
Unpaid utility bills 2,707 29.5 7.5 6.7 14.6 .01
Given gifts 2,717 24.2 28.9 48.5 28.6 .01
Given to: Parents 768 31.4 0 2.3 6.9 .01
Children 769 41.7 52.4 61.8 55.2 .01
Grandparents 767 2.4 0.8 0 0.6 ns
Grandchildren 768 13.7 46.8 57.3 33.9 .01
Gifts received 2,714 32.5 30.2 24.5 17.8 .01
Received from: Parents 756 73.8 0 1.5 21.0 .01
Children 759 6.0 68.9 74.2 37.4 .01 Grandparents 757 6.8 0 0 6.5 .01 Grandchildren 756 0 8.4 3.1 0 .05 Net giving: Gift giver only 535 32.5 41.7 60.8 55.5
Net gift giver 95 6.3 7.3 11.4 8.0 Net gift receiver 123 11.3 6.4 8.2 8.8 Gift receiving only 526 49.9 44.5 19.6 27.7
.01
Note: 1 The full sample consists of 2,718 households. The number of observations in this column can be different due to missing information in the questionnaire and / or because the information is only applicable to a sub-sample of the households. 2An elderly household member is a person whose age is above the official retirement age (55 for women and 60 for men). 3 Wald test on difference means household types (controlling for clustering effects): not significant (ns),
The discussed results suggest that gift exchange as a means to smooth consumption is a
promising area for further research. Moreover, the prevalence and direction of
inter-generational gifts combined with the importance of (old age) pensions, yields another
interesting hypothesis: the relatively generous old age pensions give rise to an
inter-generational risk-sharing in which elderly assist their children and grand children. In
other words, there a re-redistribution taking place from public authorities via elderly
citizens to their younger family members.
We explore the potential relevance of this hypothesis by decomposing the panel in four
(mutually exclusive) household types; single elderly households (16%), elderly couples
(10%), other households with elderly members (22.4%) and households with no elderly
members (51.5%).28 In the first part of Table 13 we can see that pension income forms
the most important source of income for single pensioners and pensioner couples. These
groups are also considerably less likely to be poor.29 Other households with elderly
members form an ‘in between case’ where both pensions as well as wage income form
important shares of total income. Such households have an above average poverty risk.
We expect that intergenerational redistribution may occur either by lending and
borrowing or through gifts. However, the incidence of borrowing/lending activities for
elderly households is significantly lower than that of non-elderly households. But once
elderly households are involved, single elderly and elderly couple households are more
likely to be net lenders.30 Further, elderly households give more often gifts but there are
large differences between elderly households. Only elderly couples give more often gifts
than the average population. In terms of receiving gifts, especially elderly couples and
other elderly households are less likely to get gifts. The results in Table 13 are
28
A household member is considered to be elderly once it has reached the legal retirement age; 55 for women and 60 for men.
29
We also calculated household poverty rates using household expenditures as a welfare indicator and the RLMS household specific poverty lines (2003) as thresholds.
30
Table 14: Seek transfers – Public authorities (social assistance or other benefits)
All Urban Rural Test1 Average expenditure quintiles Test
% of households Obs.2 1 2 3 4 5
Child benefits
Receipt child benefit 2.718 23.2 18.6 30.7 .01 34.7 31.1 21.0 17.8 11.4 .01 Income share of child benefits 631 0.04 0.03 0.04 ns 0.06 0.03 0.03 0.02 0.03 .01 Housing benefits
Receipt subsidies 2,718 12.2 15.2 7.4 .01 16.0 14.9 11.4 10.3 8.5 .1 Income share of housing
benefits
332 0.1 0.1 0.1 ns 0.2 0.1 0.1 0.1 0.1 .05
Fuel subsidies
Receipt fuel subsidies 2,716 3.2 2.1 5.2 .05 2.6 3.9 4.2 2.4 3.1 ns Income share of fuel subsidies 88 0.06 0.05 0.06 0 0.06 0.05 0.06 0.08 0.05 ns Stipend
Receipt stipend 2,715 5.4 6.2 4.2 .1 6.3 6.6 7.6 3.5 3.1 .05 Income share of stipend 145 0.06 0.06 0.05 ns 0.08 0.05 0.04 0.05 0.07 ns
Note: 1 Wald test on difference means urban-rural and average expenditure quintiles (controlling for clustering effects): not significant (ns), significant at 10% (.1), significant at 5% (.05) and significant at 1% (.01). 2 The full sample consists of 2,718 households. The number of observations in this column can be different due to missing information in the questionnaire and / or because the information is only applicable to a sub-sample of the households.
Source: Own calculations RLMS
Table 15: Adjustment of income generating activities – labour and goods market
All Urban Rural Test1 Average expenditure quintiles Test
% of households Obs.2 1 2 3 4 5
At least 1 member reports to have 2nd and/or 3rd job
1,955 26.2 23.9 30.2 ns 29.9 25.1 24.3 27.1 24.4 ns
At least 1 member has informal job 1,955 24.3 22.4 27.7 ns 30.7 24.6 24.1 24.0 17.8 .01
Note: 1 Wald test on difference means urban-rural and average expenditure quintiles (controlling for clustering effects): not significant (ns), significant at 10% (.1), significant at 5% (.05) and significant at 1% (.01). 2 The full sample consists of 2,718 households. The number of observations in this column can be different due to missing information in the questionnaire and / or because the information is only applicable to a sub-sample of the households.
[image:33.792.77.726.372.441.2]Table 16: Seek loans or credit – Household / Financial – Goods – Labour market
All Urban Rural Test1 Average expenditure quintiles Test
% of households Obs.2 1 2 3 4 5
Involved
Borrowing and lending 100 3.7 4.3 2.6 1.9 2.4 2.0 4.8 7.4
Only lending 256 9.5 9.8 8.8 4.3 9.1 9.2 9.9 14.8
Only borrowing 429 15.8 15.9 15.8 15.9 16.3 17.0 15.3 14.8 No borrowing nor lending 1,923 71.0 70.0 72.8
ns
78.0 72.2 71.8 70.0 63.1
.01
Net
Net lender 284 36.8 37.4 35.8 22.6 35.1 33.3 37.5 48.5
Net borrower 485 62.9 62.2 64.2 ns 77.4 64.2 66.7 62.5 51.0 .01 Debt
Has debt 2,712 19.9 19.9 19.8 ns 20.5 20.4 18.6 19.0 20.8 ns Debt as share of monthly
expenditures
526 1.0 1.0 1.0 ns 0.8 0.9 1.1 0.9 1.4 ns
Unpaid utility bills
Unpaid bills 2,707 20.4 21.2 19.0 ns 29.9 18.9 17.9 18.8 16.3 .01 Mean real value
(in 1992 rubles)
504 1,889 1,929 1,804 ns 2,817 2,083 1,556 1,131 1,394 .01
Access to loans Access to loans from employer
1,621 20.9 24.1.05 15.0 .05 13.7 18.1 20.4 21.9 30.3 .01
Note: 1 Wald test on difference means urban-rural and average expenditure quintiles (controlling for clustering effects): not significant (ns), significant at 10% (.1), significant at 5% (.05) and significant at 1% (.01). 2 The full sample consists of 2,718 households. The number of observations in this column can be different due to missing information in the questionnaire and / or because the information is only applicable to a sub-sample of the households.