Munich Personal RePEc Archive
Determinants of Foreign Direct
Investment and Its Impact on Economic
Growth in Developing Countries
Mottaleb, Khondoker Abdul
Civil Service College, Dhaka
December 2007
Online at
https://mpra.ub.uni-muenchen.de/9457/
Determinants of Foreign Direct Investment
and Its Impact on Economic Growth in
Developing Countries
Dr. Khondoker Abdul Mottaleb*
Abstract: By bridging the gap between domestic savings and investment and bringing the latest technology and management know-how from developed countries, foreign direct investment (FDI) can play important role in achieving rapid economic growth in the developing countries. The fact is that FDI mostly flows towards the developed countries and only a small portion of FDI flows to a limited number of developing countries. Thus, most of the developing nations almost fail to attract a handsome amount of FDI. Using panel data from 60 low-income and lower-middle income countries, this paper firstly identifies the influential factors that determine FDI inflow in the developing countries and secondly empirically demonstrates the relationship between economic growth and FDI. It is found that countries with larger GDP and high GDP growth rate and maintain business friendly environment with abundant modern infrastructural facilities, such as internet can successfully attract FDI and FDI on the other hand, significantly affect economic growth of a country.
Determinants of Foreign Direct Investment
and Its Impact on Economic Growth in
Developing Countries
1Dr. Khondoker Abdul Mottaleb
It is widely recognized that foreign direct investment (FDI) produces economic benefits to the recipient countries by providing capital, foreign exchange, technology, competition and by enhancing access to foreign markets (e.g., Brooks and Sumulong, 2003; World Bank, 1999; Caves, 1974; Crespo and Fontura, 2007; Romer, 1993; UNCTAD, 1991). It is argued that FDI can also enhance domestic investment and innovation (Brooks and Sumulong, 2003). Thus, for the developing countries, most of which operate in the low-level equilibrium trap, that is low savings rate, followed by low investment rate and therefore, low per capita income growth rate, may escape from the trap by importing capital from abroad in the form of foreign direct investment (Hayami, 2001). The benefits of FDI are not unknown to the developing countries. In fact, most of the developing countries are competing with each other to attract handsome amount of FDI by adopting different promotional policies, such as by liberalizing trade regimes, establishing special economic zones and by offering incentives to the foreign investors. In 1991, for example, a total of 35 countries made almost 82 changes in their FDI policies to attract FDI (Ruffin, 1993). The scenario of FDI inflow to the developing countries is, however, not very encouraging.
Firstly, Developing countries are dominated by the developed countries in attracting FDI. According to UNCTAD (2007), in 2005 total FDI inflow in the world was 945.8 billion USD, of which developed countries received 590.3 billion USD which is 62.4 percent of the total FDI inflow in the world, whereas in the same year developing countries received FDI only 314.3 billion USD. It was only 38.6 percent of the total FDI inflow in the world. Thus, developing countries are dominated by the developed countries in attracting FDI. Secondly, among the developing countries, only a few countries, such as China, Indonesia, Egypt and Columbia are the most successful countries in attracting FDI, whereas majority of the developing countries apparently fail to attract FDI. According the UNCTAD (2007), in 2007 China, Indonesia, Egypt and Columbia received FDI in total 96.4 billion USD, which was nearly 31 percent of total FDI flowed to developing countries. Whereas some developing countries, such as Bolivia and Yemen faced the problem of negative FDI inflow (FDI outflow). Questions arise as to why FDI inflow is biased towards only to a few countries? What are the determinants of FDI inflow? Finally, is there any relationship between FDI and economic growth?
Using panel data from 60 developing countries, this paper tries to investigate the underlying factors that affect inflow of FDI in the developing countries. The paper strives to establish that size and growth rate of GDP, business environment, as well as,
1 The paper is the outcome of the MA thesis paper submitted to FASID/GRIPS, Tokyo Japan in 2004
modern communication facilities significantly affect the inflow of FDI, and FDI positively and significantly affects the GDP growth of a country.
The rest of the paper is organized as follows. Section 2 advances three hypotheses, firstly on the determinants of FDI and secondly on the role of FDI on GDP growth, which are confronted using panel data from 60 developing countries. Section 3 presents descriptive statistics on the trends of FDI inflow in developing countries. Model specification and hypotheses testing are carried out in Section 4 followed by the summary of the findings and policy implications in Section 5.
2.0 Literature Review and Testable Hypotheses
The literature on FDI has been thickening day by day to identify the determinants and impacts of FDI. Although it is almost commonly approved that FDI positively affect economic growth, there is no general consensus among the economists on the determinants of FDI. As a result, empirical findings are quite chaotic and misleading sometimes.
Political risk, investment environment, infrastructure, regulatory framework, bureaucratic hurdles and red tape, judicial transparency, and the extent of corruption in the host country are found insignificant as determinants of FDI or have mixed influence on FDI inflow. For example, Wheeler and Mody (1992) and Singh and Jun (1995) found that political risk and administrative efficiency are insignificant in determining FDI. Root and Ahmed (1979) and Schneider and Frey (1985), on the other hand found that political strikes and riots and regular constitutional changes in government significantly determine FDI inflow. The mixed result might stems from the problems of getting reliable proxies for the qualitative phenomena, such as political instability (Korbin, 1981; Lim, 2001). It is, however, might be the case that high communication, information and transportation costs, pervasive corruption and poor infrastructural facilities can increase the transaction costs and risks to the foreign investors and thus can affect FDI inflow negatively. Thus, it is reasonable to postulate the following hypothesis:
H1: Countries with better physical infrastructure and business friendly environment, receive more FDI compared to others.
UNCTAD (1998, 2000) emphasizes that some of foreign investors invest to developing countries mainly to serve the host countries’ market. Domestic market size and market potentials might be the major determinants in attracting such type of foreign investors. Empirical literature often found the size of the market and the market potentiality, typically proxied by the level of GDP and GDP growth rate, significantly affect FDI inflow (e.g., Nunnenkamp and Spatz, 2002; Bandera and White, 1968; Schmitz and Bieri, 1972; Root and Ahmed, 1979; Torrisi, 1985; Schneider and Frey, 1985; Petrochilas, 1989; Wheeler and Mody, 1992; Jun and Singh, 1996). Thus, it is reasonable to postulate the following hypothesis:
H2: Countries with higher per capita GDP and higher GDP growth rate are more likely to receive larger amount of FDI compared to others.
technology, competition and by enhancing access to foreign markets (e.g., Brooks and Sumulong, 2003; World Bank, 1999; Caves, 1974; Crespo and Fontura, 2007; Romer, 1993; UNCTAD, 1991). It is argued that FDI can also enhance domestic investment and innovation (Brooks and Sumulong, 2003). To empirically examine the role of FDI on economic growth, it is reasonable to postulate the following hypothesis:
H3: FDI positively affects the GDP growth rate.
In Section 4, an econometric model has developed to empirically examine Hypotheses 1, 2 and 3 but before going to explain the model in details, the next section explains the general trends of FDI inflow in the developing countries.
3.0 Descriptive Analyses
3.1 Data Sources
This study is based on the information from 60 developing countries in 2003, 2004 and 2005. Sample countries are drawn from the three continents, which are Asia, Africa and Latin America. Table 1 presents the name of the sample countries by continents. Among the 60 developing countries, 28 countries are the lower-middle income countries, whose per capita GNI ranges between 755 USD to 2995 USD. The rests are the low-income countries, whose per capita GNI is less than 755 USD. The data on FDI inflow have taken from the UNCTAD’s World Investment Report, issues 1993 and 2007. The data on the socio-economic factors of the sample 60 countries have taken from the World Bank’s (2007) World Development Indicators 2007. The data on the corruption perception index (CPI score) have taken from the website of
“Transparency International”.
3.2.0 Tends of FDI Inflow
3.2.1 FDI Mostly Flows towards the Developed Countries
3.2.2 Lower-middle Income Developing Countries are more successful in Attracting FDI.
Developing countries are not only lagging behind in attracting FDI, but also the pattern of FDI inflow to the developing countries is highly uneven. A few developing countries enjoy massive FDI inflow, whereas other developing countries even face the problem of FDI outflow (negative FDI inflow). An analysis of the UNCTAD (2007) report reveals that lower-middle income countries, that is developing countries with per capita GNI lies between US$ 755 to US$ 2995 are more likely to be successful in attracting FDI, but low-income countries that is developing countries with per capita GNI less than 755 USD are comparatively less likely to be successful in attracting FDI. Table 2 presents the uneven pattern of FDI inflow into the developing countries. In Table 2, sample 60 countries are divided into two groups based on the amount of FDI they have received in 2005. The first group consists of top 20 FDI recipient countries and the second group consists of 40 low FDI countries in 2005.
Among the top 20 FDI recipient countries, six countries were from Africa, 10 countries were from Asia and four countries were from Latin America. In 2005, these top 20 FDI recipient countries received a total of 129738 million (USD) FDI and on average each top FDI recipient country received 6436.9 million USD as FDI. The performance in receiving FDI, however, varies across the continents. The top performing six African countries on average received FDI less than 2500 million USD in 2005, whereas the top performing 10 Asian countries received on an average 9823.6 million USD in the same year. The top performing four Latin American countries, on the other hand received FDI on an average 3895.8 million USD in 2005. Thus, among the top performing countries inflow of FDI is uneven and the Asian countries are performing the best.
In 2005 among the 20 top FDI recipient countries, 16 countries were the lower-middle income countries and only four countries were the low-income countries. Thus, lower-middle income developing countries tend to be more successful in attracting FDI and they are the dominant recipient of FDI. The four low-income but four among the top 20 FDI recipient countries in 2005 were Nigeria, Vietnam, India and Pakistan.
Table 2 also presents the average and total inflow of FDI into 40 low-income countries (whose per capita GNI are less than US$ 755). Among 40 low FDI recipient countries, 24 were from Africa, 10 were from Asia and six were from Latin America. Table 2 clearly shows that low income countries in general less successful in attracting FDI. In 2005, these 40 low FDI recipient countries received FDI only 5992 million USD in total with per country average FDI 149.8 million USD. Thus, the performance gap between top 20 FDI recipient countries and 40 low FDI recipient countries is very visible. The performance of the low recipient countries in terms of receiving FDI also varies across the continents. Table 2 shows that low FDI recipient Asian and Latin American countries on an average receive more FDI compared to the African countries.
Trend analyses of FDI inflow in the developed and developing world reveal two important issues. Firstly, the developing countries are in general not well performing in attracting FDI compared to the developed countries, and secondly, among the developing countries, lower-middle income countries are mostly successful in attracting FDI compared to the low-income countries. Now the question arises as to why lower-middle income developing countries are more likely to be successful in attracting FDI compared to the low income developing countries? What determine the inflow of FDI? The next section compares the socio-economic condition of top 20 and low 40 FDI recipient countries in 2005 with an attempt to answer the questions raised above.
3.3 A comparison of the Socio-Economic Condition Between Top 20 and Low 40 FDI Recipient Countries in 2005
Table 3 presents the comparative socio-economic condition of the 20 top FDI recipient countries and 40 low FDI recipient countries in 2005. To compare, five types of indicators have examined. These are: market size and market potentials, openness to international market, total labor force and the contribution of industrial sector to the GDP, extent of corruption and business environment and finally the communication facilities. Market size and market potentials are compared by examining per capita GDP and annual GDP growth rate in 2005. Merchandise trade (export+ import) and export of goods and services (% GDP) are compared to measure the degree of openness to the international market. Total labor force (absolute number of labor) and industrial value added (% GDP) are examined to compare the comparative availability of labor and industrial strength or contribution of industrial sector in the economy. To compare the extent of corruption and business environment, a number of indicators are examined. These are corruption perception index (lower corruption means higher index and vice versa), cost of business start-up procedure (% GNI per capita), days required to start a business and days required to enforce a contract. To compare the communication facilities, the number of telephone and internet users (per 1000) in top 20 and low 40 FDI recipient countries in 2005 are also compared.
Table 3 shows that in 2005 the average per capita GDP in the top 20 FDI recipient countries was 1529.4 USD, whereas in 40 low FDI recipient countries it was only 651.5 USD. The annual average GDP growth rate in the top 20 FDI recipient countries was 7.4 percent in 2005, whereas in 40 low FDI recipient countries it was only 4.9 percent. The differences in GDP per capita and annual GDP growth rate between top and low FDI recipient countries are statistically highly significant and positive. Thus, the domestic market size and market potentiality of the top 20 FDI recipient countries were larger compared to the low FDI recipient countries.
The comparison of the degree of openness reveal that lower-middle income countries are more international market oriented compared to the low income countries. Table 3 shows that in 2005, both trade (export + import) and export were higher in the top 20 FDI recipient countries compared to the 40 low FDI recipient countries. The differences in the averages of trade and export are also positive, though only the difference in the average export is statistically significant. Thus, the top 20 FDI recipient countries were more international market oriented compared to the 40 low FDI recipient countries in 2005.
shows that top 20 FDI recipient countries have on average more labor force and the contribution of industrial sector to GDP is higher compared to the 40 low FDI recipient countries in 2005, and the differences in the group of averages are statistically highly significant and positive.
To compare the business environment between top 20 and low 40 FDI recipient countries in 2005, corruption perception index (CPI), cost of business start-up procedure (% of GNI), time required to start a business (days) and time required to enforce a contract (days) are compared2. High CPI score, low business start-up cost and less time required to start a business and enforce a contract in the top 20 FDI recipient countries compared to the low 40 FDI recipient countries reveal that on average, the business environment in the top 20 FDI recipient countries is friendlier compared to the 40 low FDI recipient countries.
Finally, Table 3 also depicts a comparison of communication facilities between the top 20 FDI recipient countries and 40 FDI recipient countries in 2005. Table 3 shows that both telephone and internet users in the top 20 FDI recipient countries are higher compared to 40 low FDI recipient countries in 2005 and mean differences are highly statistically significant and positive. Thus, modern communication facilities are also more available in the top FDI recipient countries compared to the low FDI recipient countries.
The findings in Table 3 clearly support the hypotheses that countries with large GDP and higher annual GDP growth rate, business friendly environment and well equipped with modern communication facilities are mostly successful in attracting FDI.
4.0 Model Specification and Regression Analyses
In Hypotheses 1 and 2, it is assumed that the countries with large size of GDP and high GDP growth rate and with better physical infrastructure and business friendly environment are more likely to be successful in attracting FDI compared to others. Findings in Table 3 support Hypotheses 1 and 2. In case of Table 3, however, we have not controlled the influence of other variables. To examine Hypotheses 1 and 2 more rigorously, the following equation will be estimated:
ln (FDI)it = l0 + l1 ln(GDP)it + l2 GDPGRit+l3 INVit +l4 INTERit +l5 TELEit +
l6 TRCit +l7 TRDit +l8CPIit +l9 BCit +l10TRit +zit ---(1)
Where
FDI = Foreign direct investment GDP = Gross domestic product
GDPGR = Annual growth rate of GDP per capita GDP INV =Industrial value added (% of GDP)
INTER =Internet user (per 1000) TELE =Telephone mainline (per 1000)
TRC = Time required to enforce a contract (days) TRD =Time required to start a business (days) CPI =Corruption perception index
BC = Cost of business start-up procedures (% of GNI per capita) TR =Trade (% of GDP)
z is the error term with white-noise properties andl0 isa scalar parameter l1---l10
are the parameters of interest. Finally i (i=1---60) stands for individual countries and t (=2003, 2004, 2005) for the sample years.
Using simple pulled OLS estimation method might provide biased and inefficient estimators because of the unobserved heterogeneity among the sample countries. Therefore, appropriate estimation techniques (either fixed or random effect model) will be used to estimate equation (1). Equation (1), however, might suffer from the simultaneity bias problem. This is because probably large size of GDP not only attracts FDI, but FDI inflow also affects the size and growth of GDP as well as export. Thus, it might also necessary to estimate the following equation:
Yit = b0+ b1 ln(FDI)it+ µit---(2)
Where
Y = a set of dependent variables that includes ln(GDP), annual GDP growth rate and export of goods and services (% GDP)
FDI = defined in the case of equation 1 b0 = scalar parameter
b1 = parameters
µ = the random error term with white-noise properties
An estimation of equation 2 will in fact, facilitate to examine the third hypothesis that is FDI positively affects economic growth. Using “Hausman Test”, suitable estimation method, either “Fixed-effect” or “Random-effect” instrumental variable model will be used to estimate equations (1) and (2).
4.1 Estimation Results3
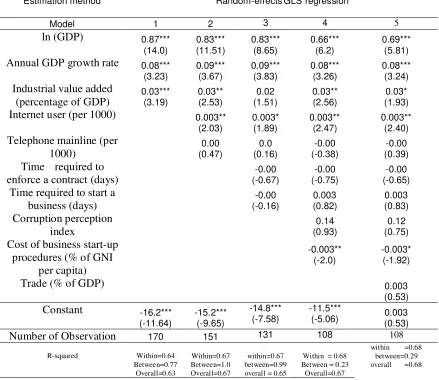
Table 4 presents the estimated regression models explaining the determinants of FDI. Random effect estimation process has applied for the estimation purpose. To identify the determinants of FDI, variables are included in the model step by step. Model 1 consists of only three variables: natural log of GDP, annual GDP growth rate and industrial value added. The estimated model shows that the coefficients of all three variables are positive and highly significant. Thus, countries with large market, high market potentials and relatively higher contribution of industries to GDP are more likely to be successful in attracting FDI. According to model 1, one percent increase in GDP size will increase FDI inflow by 0.87 percent. Similarly, one percent increase in GDP growth rate will increase FDI inflow by 0.08 percent.
In addition to three variables of model 1, model 2 includes two additional variables, which are internet and telephone mainline users. The estimated model shows that an increase in internet user increases the inflow of FDI and the coefficient is statistically significant. The effect of telephone mainline users, however, has
3 The null hypothesis was that the coefficients estimated by the efficient random effects estimator are
appeared as zero and insignificant. Model 3 includes two additional variables, which are: time required to enforce a contract (in days) and time required to start a business (in days) in addition to all variables in model 2. Both variables (time required to enforce a contract, and time required to start a business) are, however, found insignificant in the estimated model.
In addition to all variables in model 3, two additional variables are included in model 4. These are: corruption perception index and the cost of business start-up procedures (percentage of GNI per capita). The estimated model shows that the coefficient of corruption perception index is positive but insignificant. But the coefficient of cost of business start-up procedures (percentage of GNI per capita) is negative and statistically significant, which means an increase in the cost of business start-up costs affects the inflow of FDI in the host countries. In addition to all variables in model 4, model 5 includes one more variable, which is the merchandise trade. In the estimated model merchandise trade variable, however, appeared insignificant.
Overall, the findings in Table 4 support the hypotheses that in one hand market size and market potentials, and the better infrastructural facilities positively affect FDI inflow. On the other hand, unfriendly business environment and high business start-up costs discourage FDI inflow in the developing countries.
Table 5 presents the estimated regression function explaining the role of FDI on GDP size, growth and export while considering the simultaneity bias problem. Generalized 2SLS random-effect model has been used to handle the simultaneity bias problem. Findings in Table 5 are almost similar to the findings in Table 4. The first-stage estimation in Table 5, which explains the determinants of FDI, shows that GDP size and growth rate and internet facilities encourage FDI, whereas an increase in the cost of business start-up procedures discourages FDI into developing countries. Table 5 also shows that inflow of FDI positively and significantly affects the GDP size, growth and exports. The table shows that a one percent increase in FDI inflow increase GDP growth rate by 1.43 percent, increase GDP size by 0.87 percent and increase export by 2.45 percent. Thus, FDI inflow affects economic growth significantly and positively.
5.0 Conclusion and Policy Implications
Based empirical findings, it is suggested that developing countries should try making the more business friendly environment and ensuring create business friendly environment, developing countries, in the long run need to develop some necessary institutions to reduce the extent of corruption and to control the factors that increase both visible and invisible business start-up costs. A reduction in corruption and the expansion of infrastructural facilities can reduce transaction, information, communication and business start-up costs. It can contribute to the development of a business friendly environment, which might encourage inflow of FDI to the developing countries and also might contribute to attain rapid economic growth in the developing countries.
Reference
Bandera, V.N. and White, J.T. (1968). “US Direct Investment and Domestic Markets in Europe.”Economia Internationale. Vol., 21.
Bende-Nabende, Anthony (2002). Globalization, FDI, Regional Integration and
Sustainable Development. Burlington: Ashgate Publishing Company.
Chen, Edward, K.Y. (1993). “Foreign Direct Investment in East Asia.”Asian
Development Review. Vol. 11, No. 1.
Crespo, Nuno and Fontoura, Maria Paula (2007). “Determinant Factors of FDI
Spillovers- What do We Really Know?”World Development, Vol. 35, No. 3, pp 410-425.
Dollar, David (1992). “Outward-oriented developing economies really do grow more rapidly: evidence from 95 LDCs 1976-1985.”Economic Development and
Cultural Change. Vol. 40, No. 3.
ESCAP (1997). Economic and Social Survey of Asia and the Pacific 1997. New York: United Nations.
Hayami, Yujiro (2001). Development Economics: From Poverty Alleviation to the
Wealth Of Nations, 2nd Edition. New York: Oxford University Press.
Jun, Kwang W. and Sing, Harinder (1996). “The Determinants of Foreign Direct Investment in Developing Countries.”Transnational Corporations, Vol. 5, No.2.
Korbin, S. (1981). “Political Risk: A Review and Recommendation.”Journal of International Business.
Lim, Ewe-Ghee (2001). “Determinants of and the Relation Between Foreign Direct Investment and Growth: A Summary of Recent Literature.” IMF Working Paper No. 175.
Lucas, Robert E.B. (1993). “ On the determinants of direct foreign investment : evidence from east and southeast Asia.”World Development. Vol., 21, No. 3. pp. 391-406
Mankiew, N. Gregory (1999). Macroeconomics, 4th Edition. New York: Worth Publishers.
Petrochilas, G.A. (1989). Foreign Direct Investment and Development Process.
Aldershot: Avebury.
Romer, P (1993). “Idea Gaps and Object Gaps in Economic Development.”Journal
Root, F. and Ahmed, A. (1979). “Empirical Determinants of Manufacturing Direct Foreign Investment in Developing Countries.”Economic Development and
Cultural Change. Vol. 27.
Root, F. and Ahmed, A. (1979). “Empirical Determinants of Manufacturing Direct Foreign Investment in Developing Countries.”Economic Development and
Cultural Change, Vol. 27.
Ruffin, Roy J. (1993). “The role of Foreign Direct Investment in the Economic Growth of the Asian and Pacific Region.”Asian Development Review. Vol., 11, No. 1.
Schmitz, A. and Bieri, J. (1972). “EEC Tariff and US Direct Investment.”European
Economic Review. Vol., 3
Schneider, Friedrich and Bruno S. Frey (1985). “Economic and political determinants of foreign direct investment.”World Development. Vol. 13, No. 2. pp 161-175. Shamsuddin, Abul F.M. (1994). “Economic determinants of foreign direct investment
in less developed countries.”Pakistan Development Review. Vol., 33, No. 1. pp. 41-51.
Singh, Harinder and Kwang W. Jun (1995). “Some new evidence on determinants of foreign direct investment in developing countries.” World Bank Policy Research Working Paper No. 1531. Washington, D.C.: World Bank. Torrisi, C.R. (1985). “The Determinants of Direct Investment in a Small LDC.”
Journal of Economic Development. Vol., 10.
Nunnenkamp, Peter and Spatz, Julius (2002). “Determinants of FDI in Developing Countries: has globalization changed the rules of the game?”Transnational
Corporations. Vol. 11, No. 2. pp 1-34.
Transparency International (2007). Transparency International the Annual
Corruption Perception Index. Web page:
http://www.transparency.org/policy_research/surveys_indices/cpi Retrieved on February 28, 2008
Tsai, Pan-Long (1994). “Determinants of foreign direct investment and its impact on economics growth.”Journal of Economic Development. Vol., 19, No. 1. pp 137-163.
UNCTAD (2003). World Investment Report 2003: FDI Policies for Development,
National and International Perspective. New York: United Nations.
UNCTAD (2007). World Investment Report 2007: Transnational Corporations,
Extractive Industries and Development. New York: United Nations.
UNCTC (1991). World Investment Report 1991: The Triad in Foreign Direct
Investment. New York: United Nations Centre on Transnational Corporations.
Wheeler, D. and Mody, A. (1992). “International Investment Location Decisions, the Case of US firms.”Journal of International Economics, Vol. 33.
Wheeler, David. and Mody, Ashoka (1992). “International Investment Location Decisions, the case of US Firms.”Journal of International Economics. Vol. 33,
No. 1/2. pp 57-76.
World Bank (2007). The World Development Indicators 2007, CD-ROM Version.
Washington: The World Bank.
Figure 1: Trends of FDI Inflow (in billion USD) During 1997 to 2005
Source: UNCTAD (1993, 2003, 2007): World Investment Report
Sources: UNCTAD. World Investment Report, Issues 1991, 2003 and 2007
Table 1: Name of the 20 Top and Lowest 40 FDI Recipient Countries in 2005 by Continents
Continent Top 20 Recipient Countries Lowest 40 Recipient Countries
Asia Philippines, Jordan, Azerbaijan, Kazakhstan, Vietnam, Pakistan, Thailand, Indonesia, India, China
Bhutan, Nepal, Lao PDR, Iran, Uzbekistan, Kyrgyz Republic, Mongolia, Sri Lanka, Georgia, Bangladesh
Africa Tunisia, Algeria, Congo Rep., Morocco, Nigeria, Egypt
Angola, Burundi, Malawi,
Rwanda, Cameroon, Benin, Sierra Leone, Lesotho, Kenya,
Madagascar, Togo, Senegal, Guinea, Zimbabwe, Mozambique, Mauritania, Ghana, Mali, Cote d'Ivoire, Ethiopia, Uganda, Zambia, Namibia, Chad Latin America Dominican Republic, Ecuador,
Peru, Colombia
Bolivia, Guatemala, Paraguay, Nicaragua, Honduras, El Salvador
Total 20 40
Source: The classification is based on FDI inflow information in 2005 in UNCTAD (2007), World Investment Report 2007: Transnational Corporations, Extractive
Industries and Development. New York: United Nations. Pp 251-254
0 200 400 600 800 1000 1200 1400 1600
Year 1997 1998 1999 2000 2001 2002 2003 2004 2005
World
[image:13.612.104.524.378.628.2]Table 2: Average Inflow of FDI into Sample Lowest 40 and Top 20 FDI Recipient Countries in 2005
Lowest 40 FDI recipient countries Highest 20 FDI recipient countries Continents
No. of Countries
Average inflow in Million USD
No. Of Countries
Average inflow in Million USD
Africa 24 125.4 6 2486.5
Asia 10 175.2 10 9823.6
Latin America 6 205.2 4 3895.8
Total 40 5992 20 129738
Data source: UNCTAD (2006). World Investment Report (2006)
Table 3: A Comparison of the Socio-Economic Condition Between Top and Low FDI Recipient Countries in 2005
20 highest FDI Recipient
average
40 low FDI Recipient
average
Differences in group
means Socio-Economic
Factors
Proxy Variables
A B A-B
GDP per capita USD) 1529.4 651.5 878.0***
Market size and
market potentials GDP growth rate (annual) 7.4 4.9 2.5**
Trade (% of GDP) 85.9 76.8 9.1
Openness to Intl.
Market Exports of goods and services (% GDP)
44.0 32.5 11.5***
Labor force (thousands) 82616.4 7721.1 74895.3*** Labor force and
labor quality Industrial value added (% GDP)
40.9 27.9 13.0***
Corruption perception index
3.1 2.7 0.4**
Cost of business start-up procedures (% of GNI per
capita)
49.3 129.5 -80.1**
Time required to start a business (days)
52.7 56.4 -3.7
Extent of corruption and the
business environment
Time required to enforce a contract (days)b
476.2 501.1 -24.9
Internet users (per 1000)a 88.7 47.3 41.5**
Communication
facilities Telephone mainline (per
1000)c 103.1 41.1 62.0***
a. The data was available only for 17 top recipients’ countries and 32 lowest recipients’ countries.
b. The data was available only for 17 top recipients’ countries and 36 lowest recipients’ countries.
c. The data was available only for 17 top recipients’ countries and 30 lowest recipients’ countries.
Table 4: Estimated Regression Models Indicating the Factors that Affect FDI Inflow
Dependent variable ln(FDI)
Estimation method Random-effects GLS regression
Model 1 2 3 4 5
ln (GDP) 0.87*** (14.0) 0.83*** (11.51) 0.83*** (8.65) 0.66*** (6.2) 0.69*** (5.81) Annual GDP growth rate 0.08***
(3.23) 0.09*** (3.67) 0.09*** (3.83) 0.08*** (3.26) 0.08*** (3.24) Industrial value added
(percentage of GDP)
0.03*** (3.19) 0.03** (2.53) 0.02 (1.51) 0.03** (2.56) 0.03* (1.93) Internet user (per 1000) 0.003**
(2.03) 0.003* (1.89) 0.003** (2.47) 0.003** (2.40) Telephone mainline (per
1000) 0.00 (0.47) 0.0 (0.16) -0.00 (-0.38) -0.00 (0.39) Time required to
enforce a contract (days)
-0.00 (-0.67) -0.00 (-0.75) -0.00 (-0.65) Time required to start a
business (days) -0.00 (-0.16) 0.003 (0.82) 0.003 (0.83) Corruption perception index 0.14 (0.93) 0.12 (0.75) Cost of business start-up
procedures (% of GNI per capita)
-0.003** (-2.0)
-0.003* (-1.92)
Trade (% of GDP) 0.003
(0.53) Constant -16.2***
(-11.64) -15.2*** (-9.65) -14.8*** (-7.58) -11.5***
(-5.06) (0.53) 0.003
Number of Observation 170 151 131 108 108
R-squared Within=0.64 Between=0.77 Overall=0.63 Within=0.67 Between=1.0 Overall=0.67 within=0.67 between=0.99 overall = 0.65
Within = 0.68 Between = 0.23
Overall=0.67
within =0.68 between=0.29 overall =0.68
Table 5: Estimated G2SLS Regression Model Explaining the Determinants of FDI and GDP Growth Rate
Estimation method
First-stage of G2SLS regression
G2SLS random-effects IV regression
Dependent variable Ln (Foreign direct investment)
Annual GDP growth rate
ln(GDP) Export of goods and services (%
GDP) ln (Foreign direct
investment)
-- 1.43***
(5.03)
0.87*** (11.9)
2.45** (2.46) Export of goods and
services as percentage of GDP
-0.003 (-0.36)
Industrial value added as percentage of GDP
0.035 (2.21) ln (GDP) 0.65*** (5.73) Annual GDP growth
rate
0.08*** (3.21) Days required to
enforce a contract
-0.001 (-0.8) Days required to start a
business
0.003 (0.78) Telephone user (per
1000)
-0.001 (-0.39) Internet user (per 1000) 0.004** (2.48) Corruption perception
index
0.157 (0.98) Cost of business
start-up procedures as percentage of per
capita GNI
-0.003** (-2.02)
Constant -11.2*** (-4.54) -2.63 (-1.55) 18.6*** (42.3) 23.08*** (3.87)
Number of observations 108 108 108 108
R squared
Within =0.14 Between=0.98 Overall =0.14
Within =0.54 Between=0.01 Overall =0.53
Within =0.04 Between=0.99 Overall =0.04
Instrumented: ln(Foreign direct investment)
Instruments: Export of goods and services (% GDP), Industrial value added (% GDP), ln(GDP), annual GDP growth rate, days required to enforce a contract, Days required to start a business, telephone user (per 1000), internet user (per 1000), corruption perception index, Cost of business start-up procedures (% per capita GNI).
[image:16.612.117.533.95.503.2]