Performance Comparison between OOK, PPM and PAM
Modulation Schemes for Free Space Optical (FSO)
Communication Systems: Analytical Study
Taissir Youssef Elganimi
Teaching Assistant
Electrical and Electronic Engineering Department University of Tripoli, Libya
ABSTRACT
As wireless communication systems become ever-more important and pervasive parts of our everyday life; system capacity and quality of service issues are becoming more critical. In order to increase the system capacity and improve the quality of service, it is necessary that we pay closer attention to bandwidth and power efficiency issues. In this paper, the bandwidth and power efficiency issues in Free Space Optics (FSO) transmissions are addressed under Pulse Position Modulation (L-PPM) and Pulse Amplitude Modulation (M-PAM) schemes, and their performance in terms of power and bandwidth efficiencies and the Bit Error Rate (BER) versus Signal-to-Noise Ratio (SNR) are compared analytically. The comparative study of the L-PPM and M-PAM schemes is discussed, and showed that for similar SNR, L-PPM scheme offered improved performance. For FSO communication systems, although the power efficiency is inferior to L-PPM scheme, On-Off Keying (OOK) modulation scheme is more commonly used due to its efficient bandwidth usage, but M-PAM is the bandwidth efficient modulation scheme in this research for more than “2” bits of information can be sent, while L-PPM is the power efficient modulation scheme for more number of bits can be sent, and it may be able to improve performance by increasing the number of bits in L-PPM scheme.
General Terms
Optical Communications, Modulation schemes, Bit Error Rate (BER), Signal to Noise Ratio (SNR), Bandwidth Efficiency, Power Efficiency.
Keywords
Free Space Optics (FSO), On-Off Keying (OOK), Pulse Position Modulation (L-PPM), Pulse Amplitude Modulation (M-PAM).
1.
INTRODUCTION
The key element in any optical communication system is the optical source, which can easily be modulated. Such a source should produce energy concentrated in a narrow wavelength band, and should be capable of being modulated at very high rates. The semiconductor laser is one of the primary sources of light in modern optical systems [1].
When transmitted optical signals arrive at the receiver, they are converted to electronic signals by photo detectors. There are many types of photo detectors in existence, but the photodiodes are used almost exclusively in optical communication applications because of their small size, suitable material, high sensitivity, and fast response time [2]. The two most commonly used photodiodes are the pin photodiode and the Avalanche Photodiode (APD), because
they have good quantum efficiency and are made of semiconductors that are widely available commercially. For optimal design of the receiver system, it is important to understand the characteristics of these photodiodes and the noise associated with optical signal detection [1].
1.1
pin
Photodiode
The pin photodiode consists of p and n regions separated by a very lightly n-doped intrinsic i region. In normal operation, a sufficient reverse bias voltage is applied across the device so that the intrinsic region is fully depleted. When an incident photon has energy greater than the band gap energy of the material, the photon can give up its energy and excite an electron from the valence band to the conduction band. This generates free electron-hole pairs called photo carriers. The pin photo detector is designed so that these photo carriers are generated mainly in the depletion region, where most of the incident light is absorbed [1].
The performance of a pin photodiode is often characterized by its responsivity which given by [1]:
Where is the average photocurrent generated by the optical power incident on the photodiode.
1.2
Avalanche Photodiode
This type of photodiodes internally multiplies the primary signal photocurrent before it enters the input circuitry of the following amplifier. This increases the receiver sensitivity, since the photocurrent is multiplied before encountering the thermal noise associated with the receiver circuit [1].
Contrarily, a pin photodiode followed by an electronic amplifier could also provide good sensitivity margin with the expense of slower response time. For data transmission below one gigabit per second, the configuration of a pin photo detector and electronic amplifier may be advantageous over APD because of its low cost [1].
The required power for Free Space Optics (FSO) communication systems under various modulation schemes can readily be derived from the Bit Error Rate (BER) expression for all modulation schemes, and can be expressed as follows [1]:
is the total noise power in the detector current. is the signal-to-noise ratio.
2.
FSO MODULATION TECHNIQUES
Nowadays, the main goal of modulation is to squeeze as much data into the least amount of spectrum possible. That objective known as spectral efficiency, measures how quickly data can be transmitted in an assigned bandwidth. Multiple techniques have emerged to achieve and improve the spectral efficiency [1].
There are many different types of modulation schemes which are suitable for FSO communication systems such as On-Off Keying (OOK), Pulse Position Modulation (L-PPM), Pulse Amplitude Modulation (M-PAM), Differential Phase Shift Keying (DPSK), Binary Phase Shift Keying (BPSK) and Quadrature Phase Shift Keying (QPSK). Since the average emitted optical power is always limited, the performance of modulation techniques is often compared in terms of the average received optical power required to achieve a desired BER at a given data rate. It is very desirable for the modulation scheme to be power efficient, but this is however not the only deciding factor in the choice of a modulation technique.
In OOK modulation scheme, the information bits are converted into some specific code pulses (Non Return-to-Zero (NRZ), Return-to-Zero (RZ), Manchester, etc.), presence of a pulse denotes bit 1 and absence of a pulse denotes bit 0, during that slot. OOK is the simple and widely adopted modulation scheme used in commercial FSO communication systems because of ease in implementation, simple receiver design, bandwidth efficiency and cost effectiveness [3]. On the other hand considerable average power efficiency can be achieved by employing pulse modulation, in which a range of time dependent features of the pulse carrier is used to convey information. The PPM scheme is a popular modulation format used in FSO communication systems [4], it is more power efficient than the OOK modulation, but it shows a rapid decline of bandwidth efficiency with increase in the power efficiency. When bandwidth efficiency is taken into account, PAM scheme is a prime candidate [5].
This study will focus on OOK, L-PPM, and M-PAM schemes, which are summarizes as follows:
2.1
On-Off Keying (OOK)
This type of modulations is the dominant modulation scheme employed in commercial terrestrial FSO communication systems. This is primarily due to its simplicity and resilience to the innate nonlinearities of the laser and the external modulator. OOK modulation can use either NRZ or RZ pulse formats. In NRZ-OOK, an optical pulse of peak power “ ” represents a digital symbol “ ” while the transmission of an optical pulse of peak power “ “ represents a digital symbol “ ”. The optical source extinction ratio “ ” has the range . The finite duration of the optical pulse is the same as the symbol duration “ ”. While in RZ-OOK, the pulse duration is lower than the bit duration, giving an improvement in power efficiency over NRZ-OOK at the expense of an increased bandwidth requirement [6].
The probability of error for NRZ-OOK-coded optical data, detected with a photodiode, can be expressed as a function of the Signal-to-Noise Ratio (SNR) as in [1].
And the required bandwidth for NRZ-OOK is equal to the bit rate. i.e., “ ” [1].
In RZ-OOK, the required SNR is equal to half “ ” of the required SNR of the regular NRZ-OOK to achieve the same BER performance, with the expense of doubling the bandwidth [1], and the BER for RZ-OOK can be expressed as a function of SNR as follows:
2.2
Pulse Position Modulation (L-PPM)
In this modulation scheme, each pulse of a laser can be used to represent one or more bits of information by its position in time relative to the start of a symbol whose duration is identical to that of information bits it contains. And the great advantage of PPM scheme is the elimination of decision threshold dependence on the input power [7].
Bits in block encoding are transmitted in blocks instead of one at a time. Optical block encoding is achieved by converting each word of “ ” bits into one of “ ” optical fields for transmission. Since “ ” is the possible pulse positions code for “ ” bits of information in PPM scheme, and the bit rate can be expressed as follows [1]:
For Gaussian noise, the BER for L-PPM scheme can be expressed as [1]:
Substituting “ ” in (6), one can derive another form for the BER for L-PPM scheme as a function of the number of bits as follows:
2.3
Pulse Amplitude Modulation (M-PAM)
It is a form of signal modulation where the message information is encoded in the amplitude of a series of signal pulses; and the BER for M-PAM scheme can be expressed as follows [5]:
Since “ ” is the possible pulse amplitudes code for “ ” bits of information in M-PAM, i.e., “ ”, and the bit rate can be expressed as follows [5]:
Substituting “ ” in (8), one can derive another form for the BER for M-PAM as a function of the number of bits as follows:
3.
ANALYTICAL COMPARISON
BETWEEN FSO MODULATION
TECHNIQUES
To compare between L-PPM and M-PAM schemes used in FSO communication systems analytically, the BER quality, the bandwidth efficiency at any particular transmission speed and the required power, all are important measures to evaluate the performance of FSO communication systems. In this section, these three measures are compared as follows.
3.1
Bit Error Rate (BER) Analysis
To compare between L-PPM and M-PAM schemes in terms of BER performance, one can write the BER equation for each scheme as follows:
The BER equation for 2-PPM can be expressed as follows:
And the BER equation for 4-PPM can be expressed as follows:
While the BER equation for 8-PPM can be expressed as follows:
But the BER equation for 16-PPM can be expressed as follows:
And the BER equation for 2-PAM can be expressed as follows:
While the BER equation for 4-PAM can be expressed as follows:
And the BER equation for 8-PAM can be expressed as follows:
But the BER equation for 16-PAM can be expressed as follows:
Since the error function goes down with the increase in the variable of the function, and from (11), (12), (13), (14), (15), (16), (17), and (18), it is clear that the required SNR to achieve any particular BER is decreases with the increase of the number of bits in L-PPM scheme, while the required SNR to obtain any desired BER is increases with the increase of the number of bits in M-PAM scheme. And substituting “ ” (i.e., ) in L-PPM and “ ” (i.e., ) in M-PAM
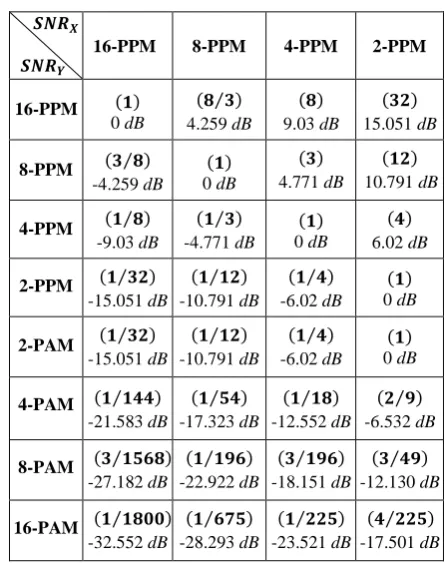
in (6) and (8) respectively yields the BER for Manchester signals, which is identical to the BER of NRZ-OOK scheme as given in (3). On the other hand, the BER for L-PPM has a better BER performance for “ and so on” than 2-PPM scheme. But the comparison with M-PAM illustrates that M-PAM scheme requires more SNR to achieve a desired BER performance for all values of more than “ ” ( ). The SNR for any FSO modulation scheme can be normalized to SNR for another modulation scheme to get the desired BER performance. Table 1 summarizes the normalized average SNR for L-PPM normalized with the other schemes of L-PPM and M-PAM.
Table 1. The Normalized Average Signal-to-Noise Ratio for L-PPM Scheme Normalized to the Other Modulation
Schemes
16-PPM 8-PPM 4-PPM 2-PPM
16-PPM
0 dB
4.259 dB
9.03 dB
15.051 dB
8-PPM
-4.259 dB 0 dB
4.771 dB
10.791 dB
4-PPM
-9.03 dB
-4.771 dB
0 dB
6.02 dB
2-PPM
-15.051 dB
-10.791 dB
-6.02 dB
0 dB
2-PAM
-15.051 dB
-10.791 dB
-6.02 dB
0 dB
4-PAM
-21.583 dB
-17.323 dB
-12.552 dB
-6.532 dB
8-PAM
-27.182 dB
-22.922 dB
-18.151 dB
-12.130 dB
16-PAM
-32.552 dB
-28.293 dB
-23.521 dB
[image:3.595.315.538.240.522.2]-17.501 dB
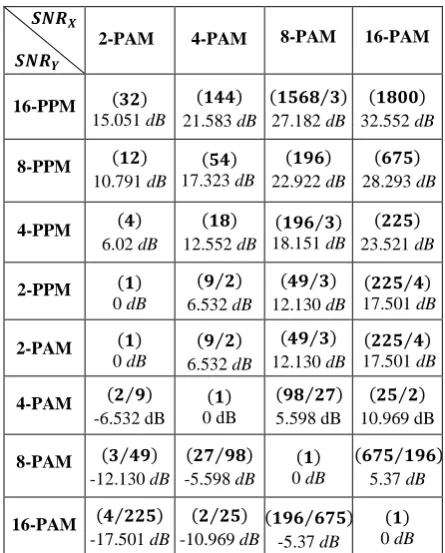
Table 2 summarizes the normalized average SNR for M-PAM normalized with the other schemes of L-PPM and M-PAM. For example, the SNR for 8-PPM normalized to 2-PAM can be calculated as follows:
This means that 8-PPM requires a factor of “
” less power than 2-PAM to obtain any desired
BER performance as shown in Table 1.
3.2
Bandwidth Efficiency
Another important measure to evaluate the performance of FSO communication systems is the bandwidth efficiency; it measures how quickly data can be transmitted in an assigned bandwidth. It is defined also as the ratio between the bit rates “ ” and the required bandwidth “ ”, and the unit of this
Table 2. The Normalized Average Signal-to-Noise Ratio for M-PAM Scheme Normalized to the Other Modulation
Schemes
2-PAM 4-PAM 8-PAM 16-PAM
16-PPM
15.051 dB
21.583 dB
27.182 dB
32.552 dB
8-PPM
10.791 dB 17.323 dB
22.922 dB
28.293 dB
4-PPM
6.02 dB
12.552 dB
18.151 dB
23.521 dB
2-PPM
0 dB
6.532 dB
12.130 dB
17.501 dB
2-PAM
0 dB
6.532 dB
12.130 dB
17.501 dB
4-PAM
-6.532 dB 0 dB
5.598 dB
10.969 dB
8-PAM
-12.130 dB
-5.598 dB
0 dB
5.37 dB
16-PAM
-17.501 dB -10.969 dB
-5.37 dB
0 dB
Since the required bandwidth for NRZ-OOK is equal to the bit rate, i.e., “ ”, so the theoretical bandwidth efficiency
for this modulation scheme is unity. While the required bandwidth for RZ-OOK is double the required bandwidth for NRZ-OOK [1], then it is equal to double the bit rate, i.e., “ ”. So, RZ-OOK has a theoretical bandwidth
efficiency of “ ”.
And the bandwidth “ ” required by the L-PPM scheme to
achieve a bit rate of “ ” is approximately the inverse of one chip duration, and is given by [5]:
So, the bandwidth efficiency “ ” for L-PPM can be
expressed as a function of as follows:
Substituting “ ” in (21), one can derive another form of the bandwidth efficiency for L-PPM scheme as a function of the number of bits “ ” as follows:
Equation (22) shows that the bandwidth efficiency “ ” for
L-PPM is decreases with the increase of the number of bits “ ”, and it is less than the bandwidth efficiency of the other modulation techniques except RZ-OOK when or . And the bandwidth efficiency “ ” for M-PAM can be
expressed as a function of as follows:
Substituting “ ” in (23), one can derive another form of the bandwidth efficiency for M-PAM as a function of the number of bits “ ” as follows:
Equation (24) shows that the bandwidth efficiency is increases with the increase of the number of bits “ ” in M-PAM, and it is more than the bandwidth efficiency of L-PPM scheme and it has a more bandwidth efficiency than the other modulation schemes for ( ), so, it is the bandwidth efficient modulation technique used in FSO communication systems.
3.3
Power Requirements
Since the required power for FSO communication systems is in proportional to the square root of the SNR as in (2), one can derive an expression relates the average power for any FSO modulation scheme (say ) normalized to the average power for another scheme (say ) with the average SNR for this modulation scheme (say ) normalized to the SNR for another scheme (say ) as follows:
Where and are the signal-to-noise ratio for X and Y modulation techniques respectively at a particular BER performance.
On the other side, the normalized average power requirement of RZ-OOK scheme normalized to NRZ-OOK scheme can be expressed as:
Equation (26) shows that NRZ-OOK scheme requires a factor of “ ” more power than RZ-OOK scheme to obtain any particular BER performance.
The normalized average power requirement of L-PPM scheme as a function of the number of bits “ ” can be expressed as:
And the normalized average power requirement of M-PAM scheme as a function of can be expressed as:
On the other hand, the normalized average power requirement of M-PAM scheme can be expressed as a function of the number of bits “ ” as follows:
both L-PPM and M-PAM require the same amount of power as NRZ-OOK when “ ”, while M-PAM require more power than OOK for greater than “2”. And from (27), it is clear that NRZ-OOK requires a factor of “ ”,
“ ” and “ ” more required power
than 4-PPM, 8-PPM, and 16-PPM respectively.
Also from (28) and (29), it is obvious that M-PAM requires a factor of “ ”, “ ”, “
”, and “ ” more required power
than NRZ-OOK for 2-PAM, 4-PAM, 8-PAM, and 16-PAM respectively.
Then, 16-PPM scheme is power efficient more than the other modulation schemes because it requires the least amount of required power followed by 8-PPM, 4-PPM, RZ-OOK, NRZ-OOK (2-PPM and 2-PAM), 4-PAM, 8-PAM and 16-PAM respectively. On the other hand, L-PPM scheme requires a factor of less power than NRZ-OOK scheme to obtain a desired BER performance.
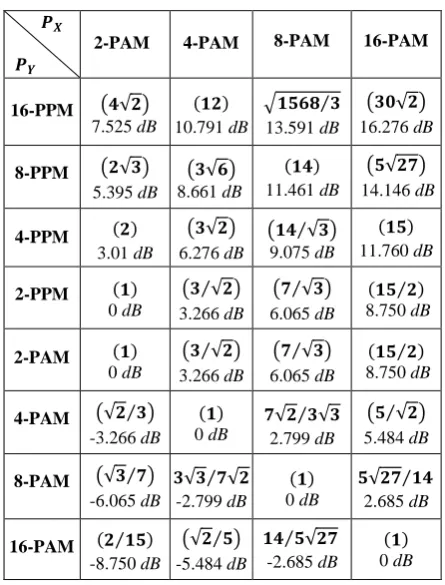
[image:5.595.317.540.104.397.2]The average power requirement for any modulation scheme can be normalized to the average power requirement for another modulation scheme to get the desired BER performance. Table 3 summarizes the normalized average power requirement for L-PPM scheme normalized with the other schemes of L-PPM and M-PAM.
Table 3. The Normalized Average Power Requirement for L-PPM Scheme Normalized to the Other Modulation
Schemes
16-PPM 8-PPM 4-PPM 2-PPM
16-PPM 0 dB 2.129 dB 4.515 dB 7.525 dB 8-PPM -2.129 dB 0 dB 2.385 dB 5.395 dB 4-PPM -4.515 dB -2.385 dB 0 dB 3.01 dB 2-PPM -7.525 dB -5.395 dB -3.01 dB 0 dB 2-PAM -7.525 dB -5.395 dB -3.01 dB 0 dB 4-PAM -10.791 dB -8.661 dB -6.276 dB -3.266 dB 8-PAM -13.591 dB -11.461 dB -9.075 dB -6.065 dB 16-PAM -16.276 dB -14.146 dB -11.760 dB -8.750 dB
And Table 4 summarizes the normalized average power requirement for M-PAM scheme normalized with the other schemes of L-PPM and M-PAM.
Table 4. The Normalized Average Power Requirement for M-PAM Scheme Normalized to the Other Modulation
Schemes
2-PAM 4-PAM 8-PAM 16-PAM
16-PPM 7.525 dB 10.791 dB 13.591 dB 16.276 dB 8-PPM 5.395 dB 8.661 dB 11.461 dB 14.146 dB 4-PPM 3.01 dB 6.276 dB 9.075 dB 11.760 dB 2-PPM 0 dB 3.266 dB 6.065 dB 8.750 dB 2-PAM 0 dB 3.266 dB 6.065 dB 8.750 dB 4-PAM -3.266 dB 0 dB 2.799 dB 5.484 dB 8-PAM -6.065 dB -2.799 dB 0 dB 2.685 dB 16-PAM -8.750 dB -5.484 dB -2.685 dB 0 dB
It can be observed also that 32-PPM scheme is power efficient than 16-PPM, and it is clear from the analytical comparison that 16-PAM scheme requires a factor of “ ” more power than 16-PPM scheme to achieve any desired BER performance. Of course the saving of power by “ ” in FSO communication networks results in saving of millions of dollars a year.
4.
CONCLUSIONS
As it is shown in this paper, the normalized average power requirement for L-PPM scheme decreases with the increase of the number of bits can be sent, but the normalized bandwidth requirement increases with the increase of the number of bits can be sent. While the normalized average power requirement for M-PAM scheme increases with the increase of the number of bits can be sent, and the normalized bandwidth requirement decreases with the increase of the number of bits can be sent. On the other hand, L-PPM scheme is the power efficient modulation scheme can be used in FSO communication systems, but when the bandwidth efficiency is taken into consideration, M-PAM scheme is a prime candidate to use in FSO communication systems.
5.
ACKNOWLEDGMENTS
I would like to acknowledge all my family members for their continuous support and understanding. And I hope to have something better than this paper to dedicate to them in the future.
6.
REFERENCES
[image:5.595.58.279.370.677.2][2] G. Keiser. 2000. Optical Fiber Communications, McGraw-Hill.
[3] M.Ijaz, O. Adebanjo, S. Ansari, Z. Ghassemlooy, S. Rajbhandari, H. Le Minh, A. Gholami and E. Leitgeb. 2010. Experimental Investigation of the Performance of OOK-NRZ and RZ Modulation Techniques under Controlled Turbulence Channel in FSO Systems. IEEE Trans.
[4] S. J. Dolinar, J. Hamkins, B. E. Moision, and V. A. Vilnrotter. 2006. Optical modulation and coding in Deep Space Optical Communications, Wiley-Interscience. [5] Mehdi Rouissat, Riad A. Borsali and Mohammed
Chick-Bled. 2010. Dual amplitude-width PPM for free space
optical systems, International journal on information technology and computer science. (March 2010), pp. 45-50.
[6] Popoola, Wasiu Oyewole. 2009. Subcarrier intensity modulated free-space optical communication systems, Ph.d thesis (September 2009). University of Northumbria at Newcastle.