http://dx.doi.org/10.4236/jpee.2015.310001
Coordination of Overcurrent Relay in
Distributed System for Different
Network Configuration
Niraj Kumar Choudhary, Soumya Ranjan Mohanty, Ravindra Kumar Singh
Electrical Engineering Department, Motilal Nehru National Institute of Technology Allahabad, Allahabad, India Email: [email protected], [email protected], [email protected]
Received 16 July 2015; accepted 26 October 2015; published 29 October 2015
Copyright © 2015 by authors and Scientific Research Publishing Inc.
This work is licensed under the Creative Commons Attribution International License (CC BY).
http://creativecommons.org/licenses/by/4.0/
Abstract
This paper presents a study on protection coordination of overcurrent relays (OCRs) in a distri-buted system by considering its different operating modes. Two different case studies which are considered in present work for protection coordination include: (i) DG interfaced distribution system in grid connected mode and (ii) DG interfaced distribution system in islanded mode of op-eration. The proposed approach is tested on the Canadian urban benchmark distribution system consisting of 9 buses. On the occurrence of fault, level of fault current changes which in turn changes the operating time of various OCRs. Therefore, it is important to calculate and suggest method of the relay setting in order to minimize the operating time of relays and also to avoid its mal-operation. In this paper, the protection scheme is optimally designed by taking into account the above mentioned conditions. The operating time of relays can be decreased and, at the same time, coordination can be maintained by considering the optimum values of time dial setting (TDS). Genetic Algorithm (GA) has been used for determining the optimum values of TDS and hence operating time.
Keywords
Distributed Generator (DG), Overcurrent Relays (OCRs), Time Dial Setting (TDS), Genetic Algorithm (GA), Grid Connected Mode, Islanded Mode
1. Introduction
tra-ditional utility grid. The distributed energy also known as decentralized energy is generated with the help of small distributed energy resources (DER) or distributed generators (DGs). These distributed generators are erally integrated to the low/medium voltage level distribution network as the range of voltage which can be gen-erated has some limitation. Based on the interfacing medium DGs can be classified into two types: (i) rotating machine based DGs and (ii) electronically interfaced DGs. The DGs should be properly integrated by consider-ing its impact on the performance of electric power distribution system. Integration of DG has several impacts on the performance of power system. The main impact is in terms of bidirectional power flow and change in short circuit current level etc. [1].
The protection system should be fast and capable enough to isolate the faulty part of the network in case the fault strikes. In the conventional distribution system, power flow is unidirectional i.e. from substation towards the load whereas the presence of another source causes the bidirectional flow of power [2]. Incorporation of DG in the distribution system has increased the complexity of protection coordination. The main changes due to DGs are bidirectional power flow and change in short circuit current level. Therefore, the existing coordination schemes may not be able to perform its function correctly [3]. The majority of protection schemes used in mod-ern power system are based upon the short circuit current sensing capability [4] [5]. The main protection issues associated with the introduction of DERs to the distribution network include the blinding of protection, false sympathetic tripping, reclosure-fuse mis-coordination, lapse of inter fuse coordination and failed auto-reclosing [6] [7]. The most widely used form of protection in power system is overcurrent protection. Each relay in the power system should be properly coordinated with another relay protecting the adjacent equipment. In case the primary relay fails to clear the fault, the backup protection should initiate its operation after certain interval of time known as coordination time interval (CTI). If the relays are not properly coordinated, it may mal-operate. Thus over-current protection is one of the major concerns in power system protection.
Different optimization techniques for optimum coordination of OCRs have been proposed in literature. The optimized vale of time of operation of over-current relays can be calculated with the help of various optimiza-tion techniques. This secoptimiza-tion provides an extensive literature survey for some of the methods which have been used for the solution of protection coordination problem. The relay coordination is formed as mixed integer non- linear programming and solved by the use of general algebraic modeling software [8] [9]. In [8], hybrid GA is used to solve the directional OCRs coordination problem for several network topologies. In [10], various linear programming problem techniques have been used for OCR coordination. In [11], sequential quadratic program-ming method has been used for optimizing all the settings of OCRs. Most recently some heuristic techniques with particle swarm optimization (PSO), evolutionary methods and harmony search algorithms have been used for solving the protection coordination problem of OCRs [12]-[14].
2. Impact of DG on Protection Coordination
In a distributed power system, DGs are used to generate power at low or medium voltage levels along with the utility grid. A distributed power system may contain different type of DG sources (electronically coupled distri- buted generators or rotating machine based distributed generators) depending upon the environmental/geo- graphical conditions. The presence of multiple DERs may cause the increase in short circuit current flowing through the network. However, as the current rating of silicon device is limited, the fault current of electronical-ly interfaced DGs should be restricted to a maximum of about two times their nominal current [15]. The higher current flowing through the relays affects the time dial setting (TDS) which in turn decreases its time of opera-tion and also the coordinaopera-tion characteristics gets changed. Thus the established over-current protecopera-tion tech-nique remains no longer applicable for the DG integrated distribution systems [16]. The most important protec-tion issues associated with the introducprotec-tion of distributed energy resources in a distribuprotec-tion network includes blinding of protection and false/sympathetic tripping.
2.1. Blinding of Protection
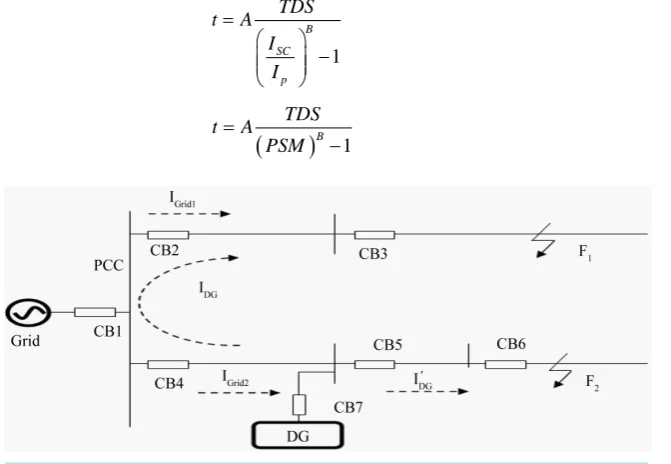
Figure 1, for a fault F2 the relay corresponding to circuit breaker CB4 does not respond to the fault and comes under the effect of blinding. This may result in malfunction of the relay.
2.2. False/Sympathetic Tripping
False/Sympathetic tripping refers to a situation in which tripping occurs due to fault outside the zone of protec-tion for a feeder embedded with DER. In this case, the DERs contribute to the fault via its feeder and the fault current flows upwards on the feeder. Thus, the non-directional relay of the healthy feeder may falsely detect a fault and may isolate the feeder, which is undesirable. Higher the short-circuit capacity; more adverse is its ef-fect on the relay performance [18]. In Figure 1, for a fault F1 circuit breaker CB3 should operate but due to con-tribution of current IDG from connected DG, circuit breaker CB4 will operate which may lead towards unneces-sary interruption of healthy feeders.
3. Methodology and Problem Formulation
The operating time of an OCR is inversely proportional to the short circuit current passing through it. The two parameters involved in the operating characteristics of relay represented by “Equation (1)” are its pick-up cur-rent (Ip) and time dial setting (TDS). In “Equation (1)”, ISC represents the short circuit current. The values of A
and B decides the operating characteristics of the relays i.e. whether the relay has got normal inverse, very in-verse or extremely inin-verse characteristics.
In this paper it has been assumed that the OCRs possess inverse definite characteristics and thus the values of A and B are taken to be 0.14 and 0.02 respectively [19] [20]. Therefore, the operating time of OCRs can be ex-pressed as shown in “Equation (2)”.
where, PSM is known as plug setting multiplier which can be determined for a known configuration after calcu-lating the values of ISC and Ip. The objective function denoted by T is the summation of coordination times of all
relays, which is to be minimised and is expressed as following in “Equation (3)”. Here tii indicates the operating
time of primary relay i, for near end fault. Therefore the time of operation of individual relay is a function of TDS, which is represented by “Equation (4)”. The value of C for each relay is a function of plug setting multi-plier (PSM) which needs to be calculated for different fault location. The functional relationship of C with PSM is shown in “Equation (5)”.
In “Equation (6)” Ci is the constant for ith relay and its value for different fault location is to be calculated.
The main objective is to minimize the operating time and to calculate the optimized value of (TDS)i. The
calcu-lation of fault current and TDS is presented in Section V of this paper.
1
B SC
p
TDS t A
I I
=
−
(1)
(
)
B 1TDS
t A
PSM
=
− (2)
, 1 min m i i i T t =
=
∑
(3)(
)
t=C TDS (4)
(
)
B 1A C
PSM
=
− (5)
(
)
1 min m i i iT C TDS
=
=
∑
(6)4. System Description and Simulation Setup
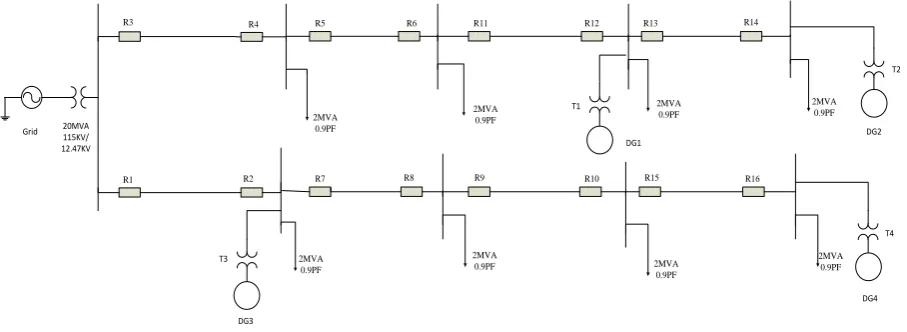
In Figure 2, a section of the Canadian urban benchmark distribution system is shown in which there are two radial feeders. The rating of each feeder is 8.7 MVA. The impedance of each feeder is (0.1529 + j 0.1406) Ω/km. These feeders are energized by utility through a transformer of 20 MVA, 115 kV/12.47kV. Four DGs are con-nected at different locations through transformers of 12.47 kV/480V voltage rating and having same power rat-ing as that of DG. From simulation studies it has been observed that sixteen relays (R1-R16) are required for this system. The operating zone of each relay is to be identified in which the relays should be capable enough to op-erate on the occurrence of different types of fault.
Due to the presence of DG the distribution system no longer remains radial therefore each fault is associated with two primary relays, one from each side which in turn is associated with up to two backup relays. The study of protection coordination among the OCRs placed in this system has been studied for three cases: Distribution system without DG, DG integrated system in grid connected mode and DG integrated system in islanded mode of operation.
5. Simulation Results and Analysis
[image:4.595.88.542.537.703.2]On the selected distribution system the study of protection coordination of OCRs are studied. Since directional overcurrent relays are used they will operate for the current flowing in a particular direction. If the current flows in reverse direction the relay will not operate. Now considering relay 13 (R13) as shown in Figure 2, which is at far end from the Grid. If fault occurs between bus 4 and bus 5 then relay 13 will act as primary relay and relay 11 acts as back up relay. The current flowing through the relay is 2600 A and current setting of relay is 200 A. Now PSM can be calculated by dividing fault current and current setting of relay and its calculated value is 13. From the inverse characteristics of overcurrent relay, operating time of relay is 2.8 sec. since there is no relay following the relay 13, therefore value of TDS should be small and here we have chosen 0.05. Thus the actual operating time of the relay is 0.14 sec. Now for the relay number 11, fault current is 1900 A and current setting is 400 A which results in PSM equal to 4.75. From the inverse time characteristics the operating time of relay is
Figure 2. Canadian benchmark distribution system.
R4 R5 R6 R11 R12 R13 R14
4.5 sec. But relay 11 is acting as backup relay and therefore grading margin of 0.3 sec is taken. Therefore re-quired discrimination time of the relay is obtained by adding operating time of primary relay and grading margin. Therefore operating time of relay 11 is 0.44 sec. Hence required TDS is obtained by dividing required discrimi-nation time and operating time obtained from inverse time characteristics. Thus the TMS of relay 11 is 0.097. Now if fault occurs between bus 3 and bus 4, relay 11 acts as primary relay for which the fault current is 2250 A and current setting is same i.e. 400 A. Therefore PSM is 5.625 and corresponding operating time from inverse time characteristic is 4 sec. But actual operating time is obtained by multiplying TMS of the relay and operating time obtained from the inverse time characteristics. Hence operating time of relay in this case is 0.388 sec. Fol-lowing the same procedure TMS and operating time of relays can be calculated. This methodology has been used for solving the problem of protection coordination for the system configuration as following.
5.1. Grid Connected Mode of Operation
The 9-Bus electrical power distribution system operating in grid connected mode is shown in Figure 2. The prime objective of conducting this study is to investigate the impact of DG on fault current and how the coordi-nation of OCRs gets altered. All the system parameters are explained in section IV of this paper.
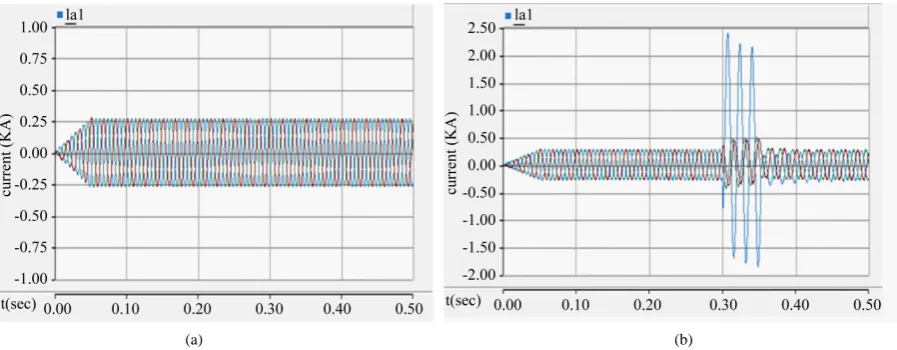
From Figure 3(a) and Figure 3(b), it can be observed that the level of current is higher as soon as the fault on feeder takes place. From the graph it is clear that the fault current through the feeder nearly become ten times the normal current. Due to this increased value of current the operating time of overcurrent relays should de-crease compared to the condition when there is no fault in the system. Table 1 shows the simulation results for the calculation of TDS and operating time for the various overcurrent relays connected to the distribution system.
Table 2 demonstrates the comparison of TDS of individual relays with and without optimization. For major-ity of relays available in the system, the optimized value of TDS is slightly lower than the un-optimized value. Thus the range of coordination for OCRs in the system increases and also the relay operating time will be more.
5.2. Islanded Mode of Operation
In this condition the overall distribution system is represented by two radial feeders which operate in isolation from the utility grid. The objective of conducting such study is to check the coordination of OCRs in islanded system under the influence of fault and also to find out the level of current which decides the time of operation of individual relays.
The islanded mode of operation of the system is represented as shown in Figure 4. From the diagram it is evident that in this condition the load demand is to be fulfilled by the DGs connected to the system. Islanded mode of operation is allowed when there is any fault on grid side and the connected DGs are capable enough to fulfill the load demand. The wave form of current in normal and faulty condition is shown in Figure 5(a) and Figure 5(b) respectively. The configuration and parameters of the distribution system are same as it is in case
(a) (b)
[image:5.595.90.539.527.702.2]Table 1. Calculation of operating time and TDS in grid connected mode.
Relay No.
Operating Time and TDS
TDS Near End Fault Far End Fault
1 0.192 0.883 0.960
2 0.050 0.680 …
3 0.191 0.859 0.9468
4 0.050 1.000 …
5 0.132 0.646 0.688
6 0.144 0.993 1.300
7 0.150 0.660 0.707
8 0.032 0.544 0.980
9 0.110 0.407 0.440
10 0.084 0.633 0.844
11 0.097 0.388 0.440
12 0.182 1.019 1.293
13 0.050 0.140 …
14 0.231 1.155 1.319
15 0.050 0.140 …
16 0.173 0.761 0.933
Table 2. Optimized calculation of TDS and its comparison in grid connected mode.
Relay No.
Calculation of TDS by using GA and comparison with un-optimized value
TDS (without GA) TDS (with GA) Relay No. TDS (without GA) TDS (with GA)
1 0.192 0.1002 9 0.110 0.1300
2 0.050 0.0160 10 0.084 0.0270
3 0.191 0.1020 11 0.097 0.1180
4 0.050 0.0116 12 0.182 0.0340
5 0.132 0.0411 13 0.050 0.0751
6 0.144 0.0549 14 0.231 0.0826
7 0.150 0.0459 15 0.050 0.0729
8 0.032 0.0250 16 0.173 0.0954
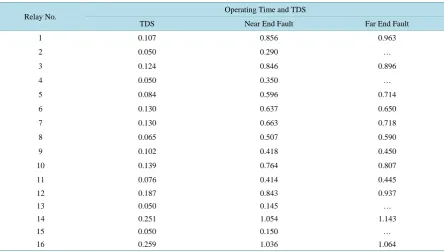
[image:6.595.90.538.434.611.2]of grid connected mode except that there is no utility grid and the system is completely operating in isolation. Table 3 shows the simulation results for the calculation of TDS and operating time for the various overcurrent relays connected to the distribution system when operated in islanded mode. As compared to the grid connected mode as shown in Table 1, the values of TDS are larger in the islanded mode of operation. From the various simulation results it has been observed that the magnitude of short circuit current decreases in this mode of op-eration and hence the operating time of relay increases.
Figure 4. Canadian benchmark distribution system in islanded mode.
[image:7.595.93.538.470.722.2](a) (b)
Figure 5.(a) Waveform of current in normal condition; (b) Waveform of current in faulty condition.
Table 3. Calculation of operating time and TDS in islanded mode of operation.
Relay No. Operating Time and TDS
TDS Near End Fault Far End Fault
1 0.107 0.856 0.963
2 0.050 0.290 …
3 0.124 0.846 0.896
4 0.050 0.350 …
5 0.084 0.596 0.714
6 0.130 0.637 0.650
7 0.130 0.663 0.718
8 0.065 0.507 0.590
9 0.102 0.418 0.450
10 0.139 0.764 0.807
11 0.076 0.414 0.445
12 0.187 0.843 0.937
13 0.050 0.145 …
14 0.251 1.054 1.143
15 0.050 0.150 …
16 0.259 1.036 1.064
R4 R5 R6 R11 R12 R13 R14
R16 R15
R10 R9
R8 R7
R2 R1
R3
2MVA 0.9PF
2MVA 0.9PF
2MVA 0.9PF
2MVA 0.9PF
2MVA 0.9PF
2MVA 0.9PF
2MVA 0.9PF
2MVA 0.9PF
DG1 DG2
DG4 DG3
T4 T2
T1
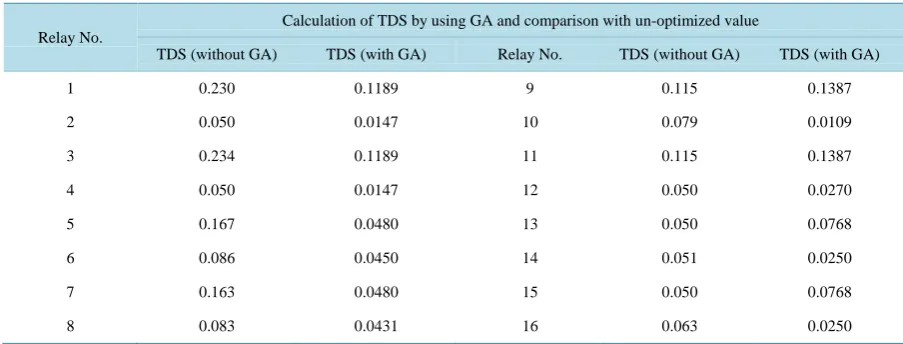
Table 4. Optimized calculation of TDS and its comparison in islanded mode of operation.
Relay No.
Calculation of TDS by using GA and comparison with un-optimized value
TDS (without GA) TDS (with GA) Relay No. TDS (without GA) TDS (with GA)
1 0.230 0.1189 9 0.115 0.1387
2 0.050 0.0147 10 0.079 0.0109
3 0.234 0.1189 11 0.115 0.1387
4 0.050 0.0147 12 0.050 0.0270
5 0.167 0.0480 13 0.050 0.0768
6 0.086 0.0450 14 0.051 0.0250
7 0.163 0.0480 15 0.050 0.0768
8 0.083 0.0431 16 0.063 0.0250
is shown in Table 2, the value of TDS increases. Thus the coordination margin for OCRs in the system increases and also the relays operating time will be more.
6. Conclusion
A comparative study for protection coordination of OCRs is presented for different network configuration in presence and absence of DG. The effect of DG penetration on the two main protection coordination problems i.e. blinding of protection and False/Sympathetic tripping is discussed in the first section of this paper which is sup-ported with the simulation results. The novel idea used in this paper for the calculation of TDS is that both near and far end fault location has been considered. Whereas, in the second section, a comparative analysis for the calculation of TDS and operating time of relays has been presented. The range of protection coordination for the same system can be enhanced by using different types of fault current limiters (FCLs) at suitable location. In this paper, equivalent source based on DGs has been considered as a substitute of real distributed generators. There-fore, the effectiveness of the proposed method can be tested for electronically interfaced DERs (converter based DGs).
References
[1] So, C.W. and Lee. K.K. (2000) Overcurrent Relay Coordination by Evolutionary Programming. Electric Power System
Research, 53, 83-90. http://dx.doi.org/10.1016/S0378-7796(99)00052-8
[2] Chowdhury, A. and Koval, D. (2009) Power Distribution System Reliability: Practical Methods and Applications.
Wi-ley-IEEE, Hoboken.
[3] Choudhary, N.K., Mohanty, S.R. and Singh, R.K. (2014) A Review on Microgrid Protection. 2014 International
Elec-trical Engineering Congress, Chonburi, 19-21 March 2014, 1-4. http://dx.doi.org/10.1109/iEECON.2014.6925919
[4] Morren, J. and de Haan, S.W.H. (2008) Impact of Distributed Generation Units with Power Electronic Converters on
Distribution Network Protection. IET 9th International Conference on Developments in Power Systems Protection, UK,
17-20 March 2008, 664-669. http://dx.doi.org/10.1049/cp:20080118
[5] Baran, M. and El-Barkabi, I. (2005) Fault Analysis on Distribution Feeders with Distributed Generation. IEEE
Trans-actions on Power Systems, 20, 1757-1764. http://dx.doi.org/10.1109/TPWRS.2005.857940
[6] Maki, K., Repo, S. and Jarventausta, P. (2008) Methods for Assessing the Protection Impacts of Distributed Generation
in Network Planning Activities. IET 9th International Conference on Developments in Power Systems Protection, UK,
March 2008, 484-489. http://dx.doi.org/10.1049/cp:20080085
[7] Kauhaniemi, K. and Knmpnlained, L. (2004) Impact of Distributed Generation on the Protection of Distribution
Net-works. 8th IEE International Conference on Developments in Power System Protection, 1, 315-318.
[8] Noghabi, A.S., Sadeh, J. and Mashhadi, H.R. (2009) Considering Different Network Topologies in Optimal
Overcur-rent Relay Coordination Using a Hybrid GA. IEEE Transactions on Power Delivery, 24, 1857-1863.
http://dx.doi.org/10.1109/TPWRD.2009.2029057
[9] Urdaneta, A.J., Ramon, N. and Jimenez, L.G.P. (1988) Optimal Coordination of Directional Relays in Interconnected
Power System. IEEE Transactions on Power Delivery, 3, 903-911. http://dx.doi.org/10.1109/61.193867
[10] Zeienldin, H., El-Saadany, E.F. and Salama, M.A. (2004) A Novel Problem Formulation for Directional Overcurrent
Relay Coordination. 2004 Large Engineering systems Conference on Power Engineering, Halifax, 28-30 July 2004,
48-52. http://dx.doi.org/10.1109/lescpe.2004.1356265
[11] Birla, D., Maheshwari, R.P. and Gupta, H.O. (2006) A New Nonlinear Directional Overcurrent Relay Coordination
Technique, and Banes and Boons of Near-End Faults Based Approach. IEEE Transactions on Power Delivery, 21,
1176-1182. http://dx.doi.org/10.1109/TPWRD.2005.861325
[12] Mansour, M., Mekhamer, S. and El-Kharbawe, N.-S. (2007) A Modified Particle Swarm Optimizer for the
Coordina-tion of DirecCoordina-tional Overcurrent Relays. IEEE Transactions on Power Delivery, 22, 1400-1410.
http://dx.doi.org/10.1109/TPWRD.2007.899259
[13] Bedekar, P.P. and Bhide, S.R. (2011) Optimum Coordination of Directional Overcurrent Relays Using the Hybrid
GA-NLP Approach. IEEE Transactions on Power Delivery, 26, 109-119.
http://dx.doi.org/10.1109/TPWRD.2010.2080289
[14] Barzegari, M., Bathaee, S. and Alizadeh, M. (2010) Optimal Coordination of Directional Overcurrent Relays Using
Harmony Search Algorithm. 9th International Conference on Environment and Electrical Engineering, Prague, 16-19
May 2010, 321-324. http://dx.doi.org/10.1109/eeeic.2010.5489935
[15] Al-Nasseri, H., Redfern, M.A. and Li, F. (2006) A Voltage Based Protection for Micro-Grids Containing Power
Elec-tronic Converters. IEEE Power Engineering Society General Meeting,Montreal, 1-7.
[16] Miveh, M.R., Gandomkar, M., Mirsaeidi, S. and Nuri, M. (2011) Analysis of Single Line to Ground Fault Based on
Zero Sequence Current in Microgrids. ISCEE Conference, Kermanshah.
[17] Hung, D.Q. and Mithulananthan, N. (2013) Multiple Distributed Generators Placement in Primary Distribution
Net-works for Loss Reduction. IEEE Transactions on Industrial Electronics, 60, 1700-1708.
http://dx.doi.org/10.1109/TIE.2011.2112316
[18] IEEE Recommended Practice for Protection and Coordination of Industrial and Commercial Power Systems. IEEE Std.,
242-1986.
[19] Sortomme, E., Venkata, S. and Mitra, J. (2010) Microgrid Protection Using Communication-Assisted Digital Relays.
IEEE Transactions on Power Delivery, 25, 2789-2796. http://dx.doi.org/10.1109/TPWRD.2009.2035810
[20] Najy, W.K.A., Zeineldin, H.H. and Woon, W.L. (2013) Optimal Protection Coordination for Microgrids with Grid
Connected and Islanded Capability.IEEE Transactions on Industrial Electronics, 60, 1668-1677.