Sum of Distance based Algorithm for Clustering Web
Data
Neeti Arora
Research studentRajiv Gandhi Technical University, Bhopal
Mahesh Motwani
Associate Professor, Computer Engineering Rajiv Gandhi Technical University, Bhopal
ABSTRACT
Clustering is a data mining technique used to make groups of objects that are somehow similar in characteristics. The criterion for checking the similarity is implementation dependent.Clustering analyzes data objects without consulting a known class label or category i.e. it is an unsupervised data mining technique. K-means is a widely used clustering algorithm that chooses random cluster centers (centroid), one for each centroid. The performance of K-means strongly depends on the initial guess of centers (centroid) and the final cluster centroids may not be the optimal ones as the algorithm can converge to local optimal solutions. Therefore it is important for K-means to have good choice of initial centroids. An algorithm for clustering that selects initial centroids using criteria of finding sum of distances of data objects to all other data objects have been formed. The proposed algorithm results in better clustering on synthetic as well as real datasets when compared to the K-means technique.
General Terms
Data Mining, Algorithm, Centroids
Keywords
Clustering, K-means, Recall, Precision
1. INTRODUCTION
Clustering is the data mining technique that groups the data objects into classes or clusters, so that objects within a cluster have high similarity in comparison to one another(intra-class similarity) but are very dissimilar to objects in other clusters(inter-class similarity). There are many clustering methods available, and each of them may give a different grouping of a dataset. These methods are divided into two basic types: hierarchical and partitional clustering [1]. Hierarchical clustering proceeds successively by either merging smaller clusters into larger ones, or by splitting larger clusters. The clustering methods differ in the rule by which it is decided which two small clusters are merged or which large cluster is split. Partitional clustering, attempts to directly decompose the data set into a set of disjoint clusters. Each object is a member of the cluster with which it is most similar. K-means [2, 3, 4, 5] is one of the most widely used partition clustering algorithm. The algorithm clusters the n data pointsof the given dataset Dinto k groups, where k is provided as an input parameter. It defines k centroids, one for each cluster. For this kdata points are selected at random from D as initial centroids.The next step is to take each point belonging to the given data set and assign it to the nearest centroid. Euclidean distance is generally considered to determine the distance between data points and the centroids. When all the points are included in some clusters, the mean of each cluster is calculated to find the new centroids for each cluster. It then assigns all the data points to clusters based upon their proximity to the mean of the cluster. The cluster’s mean is
then recomputed and the process begins again.In due course, a situation is reached where the clusters centers do not change anymore. This becomes the convergence criterion for clustering.
The K-means algorithm has a drawback that it results in different types of clusters depending on the initialization process, which randomly generates the initial centers. Thus the performance of K-means strongly depends on the initial guess of centers as different runs of K-means on the same input data might produce different results [6]. A new algorithm that removes this drawback of K-means has been developed. The proposed algorithm does not perform random generation of the initial centers and does not produce different results for the same input data.
2. RELATED WORK
27 A new approach inspired by the process of placing pillars in
order to make a stable house is proposed in [13]. This technique chooses the position of initial centroids by using the farthest accumulated distance metric between each data point and all previous centroids, and then, a data point which has the maximum distance will be selected.
3. PROPOSED METHOD
A new algorithm to find initial centroids and perform clustering using these centroids has been developed. The selection of initial centroids is done such that the performance of clustering is improved. New algorithm is named as Sum of Distances Clustering (SODC).
3.1 Sum of Distances Clustering
Let the clustering of n data points in the given dataset D is to be done into k clusters. In SODC algorithm, calculate the distance of each data point di= 1 to n in the given dataset D from
all other data points and store these distances in a distance matrix DM. The total distance of each data point di= 1 to n with
all other data points is then calculated. The total distance for a point di is sum of all elements in the row of the DM
corresponding to di. These sums are stored in a sum of
distances vector SD. The vector SD is sorted in decreasing order of total distance values. Now define the point d with highest total distance value among SD as the first initial centroid. As the vector SD is sorted in decreasing order of total distance values, this point d will be the first element in the vector SD. Put this initial centroid point d in the set S of initial centroids.
Now pick the next point d with highest total distance value among the remaining (n-1) points in SD and define it as the second initial centroid point. This second initial centroid will be the second element of the sorted vector SD. Put this initial centroid point d in the set S of initial centroids. This process is repeated until k initial centroid points are determined. These k initial centroids are now used in the K-means process as substitute for the k random initial centroids. K-means is now invoked for clustering the dataset D into k number of clusters using the initial centroids available in set S.
Algorithm SODC:
Input: Graph G of n data points {d1, d2,…,dn} in D and k
the number of clusters
Output: Initial k cluster centroids and the set of k Clusters 1. Find the distance matrix DM from G; 2. Calculate the sum vector SD from DM;
3. SD = Sort (SD, decreasing); // sort SD in decreasing order
4. ic = 1; //ic indicates counter for number of initial centroids
5. d = SD [ic]; // first point from SD to be chosen as initial centroid
6. S = d; // S is set of final initial centroids 7. ic = ic+ 1;
8. While (ic<=k) {
d = SD [ic]; // next point from SD to be chosen as initial centroid
S = S Union d; ic =ic+ 1; } End while 9. K-means(D, S, k);
4. EXPERIMENTAL RESULTS
The experiments are conducted on synthetic and real data points to compute different sets of clusters. The experiments are performed on core i5 processor with a speed of 2.5 GHz and 4 GB RAM using Matlab.
Recall is defined as the proportion of data points that have been correctly put into a cluster among all the relevant points that should have been in that cluster. Precision is defined as the proportion of data points that have been correctly put into a cluster among all the points put into that cluster. Recall and precision parameters have been used to evaluate the quality of clusters.
4.1 Experiments on synthetic datasets
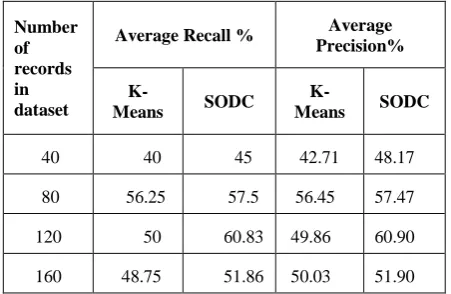
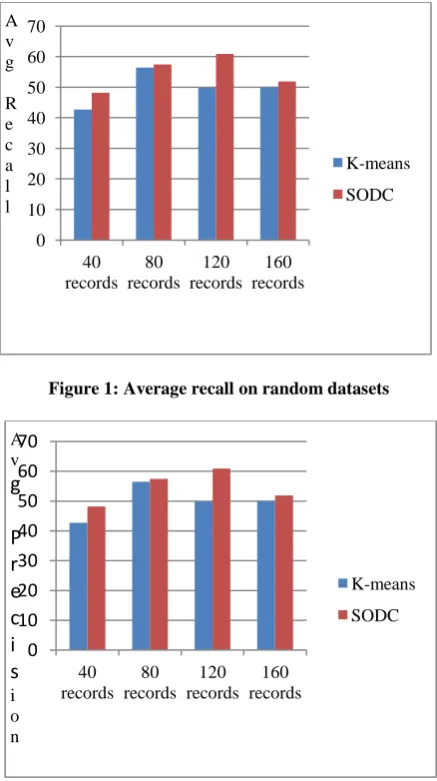
The synthetic data set by generating random data points in 2 dimensions have been created. Four datasets with 40, 80, 120, 160 records are generated. Random data points are generated and distributed among four groups. Equal numbers of data points are generated in each group. The range of points in the first group is chosen from (0, 1) to (50, 7). The range of points in the second group is from (0, 10) to (50, 17). The range of points in the third group is from (0, 20) to (50, 27) and finally the range in the fourth group is from (0, 30) to (50, 37). The comparison of the quality of the clustering achieved with SODC and K-means is made in terms of the percentage accuracy of grouping of objects in correct clusters. The recall accuracy is calculated by dividing the number of relevant data points correctly put in a particular group (by running the clustering algorithm) by the total number of data points that should have ideally been in that group.The precision accuracy is calculated by dividing the number of relevant data points correctly put in a particular group (by running the clustering algorithm) by the total number of all data points put in that group. [image:2.595.314.540.607.754.2]The recall and precision is found for all the datasets using K-means algorithm and the proposed SODC algorithm to see how correctly the data points are put into a cluster. The results of clustering using K-means algorithm and the proposed SODC algorithm are shown in Table 1. The graph plotted for average recall in percentage using both the techniques is shown in Figure 1 and the graph plotted for average precision in percentage using both the techniques is shown in Figure 2. As can be seen from the results, SODC algorithm performs better clustering of data as compared to the K-means algorithm with randomly initialized centroids.
Table 1: Average Recall and Average Precision on random datasets
Number of records in dataset
Average Recall % Average Precision%
K-
Means SODC
K-
Means SODC
40 40 45 42.71 48.17
80 56.25 57.5 56.45 57.47
120 50 60.83 49.86 60.90
4.2 Experiments on real web datasets
The proposed algorithm SODC has been implemented on real web datasets of images. The image datasets are processed and described in terms of features that are inherent in the images themselves. The features extracted from the images are smaller in size as compared to the original image data and are being used in place of the images themselves for retrieval and mining. These are represented in the form of real–valued components called the feature vectors or signature or descriptors of an image. The color moments are used by us as the property in the feature extraction technique [14].
Algorithm SODC is applied to cluster the images over the extracted features. Recall and Precision of the clusters are calculated to determine the quality of clustering. K-means algorithm to cluster the images over the same extracted features in order to compare the performance of SODC with K-means has been applied. The comparison is in terms of the recall and precision parameters.
[image:3.595.321.519.139.251.2]The datasets and experimental results achieved using SODC and K-means clustering techniques are described below.
[image:3.595.57.276.300.691.2]Figure 1: Average recall on random datasets
Figure 2: Average precision on random datasets
4.1.1
Results on image.cd dataset
The image.cd image database created for research on image retrieval by J.Li [15] contains 2360 images of size 384x256 and are stored in JPEG format. Firstly 80 images are selected
and created eight groups of these images, with each group having 10 images each of similar color and items as perceived by our eye. These eight groups (classes) are shown in Table 2.Thus overall the dataset of 80 images are created.
Table 2: Eight classes from image.cd dataset
Class 1 Class 2 Class 3 Class 4 water,
splash, rock and whale
blue glacier and water
blue flowers and green leaves
white-yellow flowers and green leaves Class 5 Class 6 Class 7 Class 8 Water plant Purple
flowers
Glacier, snow
Red fireworks
[image:3.595.55.277.302.478.2]Eight clusters of these images using SODC and K-means algorithm have been formed .The recall and precision of each cluster is found for K-means and SODC. The average recall and average precision is calculated for K-means and SODC and shown in Table 3. The results of average recall and average precision are shown graphically in Figure 3. The results prove that the recall and precision of SODC algorithm are better than the recall and precision of K-means with randomly initialized centroids.
Table 3: Average Recall and Precision on image.cd dataset
Number of Classes
Average Recall in %
Average Precision in %
K-Means SODC K-
Means SODC
8 57.5 58.75 58.37 58.37
4.1.2
Results on corel dataset
Corel5k is a collection of 5000 images downloaded from website [16]. 10, 50 and 100 clusters of these images using SODC and K-means algorithm have been formed. The average recall and precision using SODC and K-means algorithm is determined and shown in Table 4. The graph plotted for average recall in percentage using these techniques is shown in Figure 4 and the graph plotted for average precision in percentage using these techniques is shown in Figure 5. The results prove that the recall and precision of SODC algorithm are better than the recall and precision of K-means with randomly initialized centroids.
Figure 3: Average recall and Average precision on image.cd dataset
0 10 20 30 40 50 60 70
40 records
80 records
120 records
160 records
K-means SODC A
v g R e c a l l
0 10 20 30 40 50 60 70
40 records
80 records
120 records
160 records
K-means SODC A
v
g
P
r
e
c
i
s
i o n56.5 57 57.5 58 58.5 59
Avg Recall Avg Precision
K-Means
[image:3.595.315.537.591.718.2]29
Table 4: Average Recall and Precision on Corel dataset
Figure 4: Average recall on Corel dataset
4.1.3
Results on image.orig dataset
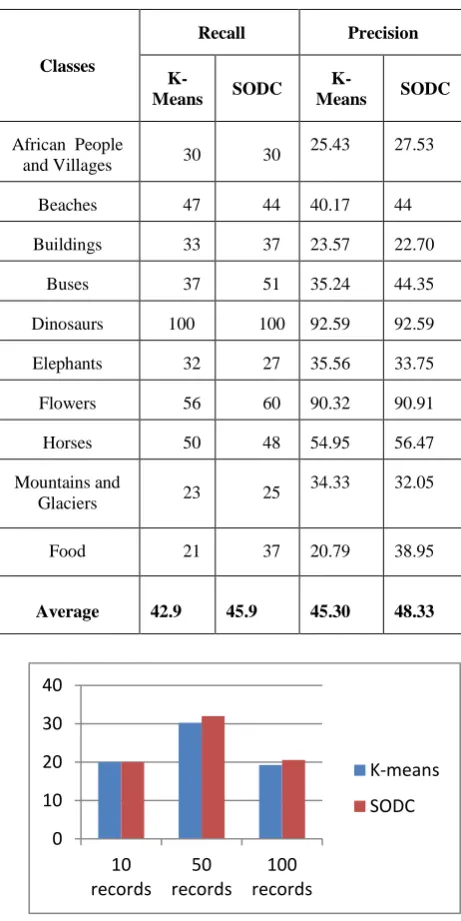
Image.orig is a collection of 1000 test images in test database downloaded from website [17]. This database is used in SIMPLIcity paper [18]. This image database of 1000 images has ten classes and class has 100 images. Ten clusters of these images using SODC and K-means algorithm have been formed. The recall and precision of SODC and K-means algorithm is determined and shown in Table 5. The results of average recall and average precision are shown graphically in Figure 6. The results show that the recall and precision of SODC algorithm are better than the recall and precision of K-means with randomly initialized centroids.
[image:4.595.51.282.93.554.2]Figure 5: Average precision on Corel dataset
Table 5: Average Recall and Precision on image.orig dataset
Figure 6: Average recall and Average precision on image.cd dataset
5. CONCLUSION
The quality of clustering of K-means algorithm depends on the initialization of kdata points. These kinitial centroids are chosen randomly by the K-means algorithm and this is the major weakness of K-means. The algorithm proposed in this paper is based on the assumption that good clusters are formed when the choice of initial k centroids is such that they are as far as possible from each other. SODC approach proposed here is based on computing the total distance of a node from all other nodes. The algorithm is tested on both synthetic database and real database from web. The experimental results show the effectiveness of the idea and the algorithm produce better quality clusters than the existing K-means algorithm. An optimization to improve the quality of clusters formed with SODC algorithm is also proposed.
6. REFERENCES
[1] J. Han and M. Kamber. 2002. “Data Mining concepts
0 10 20 30 40
10 records
50 records
100 records
K-means
SODC
0 10 20 30 40 50
10 clusters
50 clusters
100 clusters
K-means
SODC
40 42 44 46 48 50
Avg Recall Avg Precision
K-Means
SODC Classes
Recall Precision
K-
Means SODC
K-
Means SODC
African People
and Villages 30 30
25.43 27.53
Beaches 47 44 40.17 44
Buildings 33 37 23.57 22.70
Buses 37 51 35.24 44.35
Dinosaurs 100 100 92.59 92.59
Elephants 32 27 35.56 33.75
Flowers 56 60 90.32 90.91
Horses 50 48 54.95 56.47
Mountains and
Glaciers 23 25
34.33 32.05
Food 21 37 20.79 38.95
Average 42.9 45.9 45.30 48.33
Number of Clusters
Average Recall % Average Precision %
[image:4.595.307.547.259.537.2]and Techniques”, Morgan Kaufmann Publishers. [2] J. B. MacQueen, 1967. "Some Methods for classification
and Analysis of Multivariate Observations”, Proceedings of 5-th Berkeley Symposium on Mathematical Statistics and Probability", Berkeley, University of California Press, pp 281-297.
[3] Margaret Dunham, Data Mining 2006. Introductory and advanced concepts, Pearson education.
[4] S.Llyod. 1982. “Least Squares quantization in PCM”. IEEE transactions on information theory, 28(2), pp 129-137.
[5] JuanyingXie, Shuai Xiang, WeixinXie, Xinbo Gao. 2011. “An efficient Global K-means Clustering Algorithm”, Journal of Computers, Vol 6, No 2, pp 271-279.
[6] S.S.Khan, A.Ahmed.2004. “Cluster Center initialization algorithm for k-means algorithm”, Pattern Recognition Letters, pp 1293-1302.
[7] Bradley, P. S., Fayyad, U. M. 1998. , “Refining initial points for K-Means clustering”, In Proceedings of 15th International Conf. on Machine Learning. Morgan Kaufmann, San Francisco, CA, pp 91-99.
[8] Likas, A., Vlassis, N., Verbeek, J. J. 2003. ” The global k-means clustering algorithm”,In Pattern Recognition, Vol. 36. pp 451-461.
[9] Fang Yuan, Zeng-HuiMeng, Hong-Xia Zhang, Chun-Ru Dong. 2004. ,“A new algorithm to Get the Initial Centroids”,In proceedings of the third International Conference on Machine Learning and Cybernetics, Shanghai, pp26-29.
[10]A.R Barakbah, A. Helen. 2005. “Optimized K-means: an algorithm of initial centroids optimization for K-means. In proceedings of Soft Computing, Intelligent Systems and Information Technology (SIIT), pp2-63-66.
[11]Fahim A.M., Salem A.M., Torkey F.A., Ramadan M.A. 2006. “An efficient enhanced k-means clustering algorithm”, Journal of Zhejiang University Science, 7(10), pp1626-1633.
[12]A.R Barakbah, K. Arai. 2007. “Hierarchical K-means: an algorithm for centroids initialization for K-means”,Reports of the faculty of Science & Engineering, Saga University, Japan, Vol. 36, No. 1.
[13]A.R Barakbah, Y. Kiyoki. 2009. “A pillar Algorithm for K-means optimization by distance maximization for initial centroid designation”, IEEE.
[14]M.Stricker and M.Orengo. 1995. “Similarity of color images”, Storage and Retrieval for Image and Video Databases III (SPIE), pp381-392.
[15]http://sites.stat.psu.edu/~jiali/ for image.cd image database
[16]http://sci2s.ugr.es/keel/dataset_smja.php?cod=230 for Corel5k image database
[17]http://wang.ist.psu.edu/docs/related/ for image.orig image database