WSNs Power Consumption Reduction using Clustering
and Multiple Access Techniques
Omar N. Al-Khayat
Dept. of Computer Engineering, University of Technology,
Baghdad, Iraq
Siddeeq Y. Ameen
Professor College of Electronics Engineering, University of
Mosul, Mosul, Iraq
Mohammed N. Abdallah
Asst. Prof.
Dept. of Computer Engineering, University of Technology,
Baghdad, Iraq
ABSTRACT
Energy consumption is one of the important challenge in WSNs deployment and applications. This is because power of WSNs is limited by battery which is difficult if not impossible to replace or recharge in some manner in the sensor nodes. Power consumption can be controlled in WSNs in more than one layer. In this thesis, power efficiency problems and techniques of enlarging battery life using WSNs physical layer are investigated in the second layer MAC sublayer. The latter has been achieved using the multiple access techniques, TDMA and CDMA.
Initially, the research attempt to divide the WSN nodes into clusters such that at any time only one specific cluster will operate and the remaining cluster switched off to reduce the power consumption. Each cluster consists of several nodes and one sub-station (SS), all the nodes in one cluster send its data to the (SS) that forwards the data to main station (MS). Furthermore, the link between nodes, SS, and MS is controlled and scheduled such that cluster and node switched to active or sleep modes. Four systems with multi-types of multiple access are proposed and tested. These systems are classified according to the way multiple access provided in the link: TDMA-TDMA-OFDM system, CDMA-CDMA system, CDMA-TDMA-OFDM system, and TDMA-OFDM-TDMA-OFDM system. These systems have been simulated and investigated. By comparing the results of each system with different case of cluster, it has been found that the less consumed power is achieved with 8 clusters of 16 nodes/cluster case. The results also show that the best performance is achieved with CDMA-CDMA system with 8 clusters of 16 nodes/cluster case.
Keywords
Browser, WSNs, Power Consumption, Clustering, Multiple Access
1.
INTRODUCTION
The researchers’ problems and challenges in wireless sensor networks field are: energy efficiency, limited storage and computation, low bandwidth and higher error rates, error caused by wireless communication and noise measurements, scalability to large number of sensor nodes and last survivability in harsh environments [1]. On other hand, many researches have an interest to solve these problems such as: producing protocols to solve and management the scheduling task of sensing to enlarge the battery life. Moreover, researchers have produced an algorithm to turn-off the sensor which is not active at this time.
Wireless sensor networks power depends on battery, and to recharge or replace the battery considers is a difficult task. This is because sensor node location or other reasons related to sensors. The physical layer in WSNs is responsible for frequency selection, modulation and data encryption whereas the power consumption management might locate at top layer such as the data link layer. There are two types of consumed power in wireless sensor networks: the consumed power through process and sense and the consumed power through transmit data from node to station. It is well known that the consumption of power through transmit data is larger than other power consumption. Furthermore, not all transmitted data from nodes to the station will reach uncorrupted and require retransmission. The retransmission process consumes more power and discharges the sensor node quickly. The major cause of the error is the non-ideal channel characteristics (distortion and noise). This effect can be simulated as AWGN noise and multipath fading effect (Rayleigh Fading).Therefore the research goals that adopted to solve the above research problem are:
1. Employment of task of scheduling to schedule the wake-up and sleep modes via clustering and multiple access. 2. Investigate the effect of clustering and access control
techniques effect between the main station, substations and sensors on power consumption.
3. Simulation of the above suggestions to investigate the enhancement using MATLAB simulation tool.
Energy consumption is one of the important issues in WSNs; because the power is limited by battery as well as some nodes are difficult, if not impossible to replace or recharge battery dependent of the locations of these nodes. This paper aims to handle the power consumption and enlarge battery life by using physical layer of wireless sensor networks.
2.
WSNS AND MULTIPLE ACCESS
TECHNIQUES
WSNs is a network consisting of sensors measuring devices, computing devices, and communication elements. These devices make together allow the network to be able to monitor the specified environment and acting to achieve the goals required. Many form of sensors are available depending on the applications and environments. The environment could be the chemical reactor, human body, a biological system, remote and dangerous area, highways, or an information technology framework. Thus wide range of WSNs deployments are now available. These include data collection, observation, monitoring, and medical telemetry [2].
components are processor, wireless communication, memory, sensor interface, power supply, and operating system[3].
In WSNs, the communication is controlled by Media Access Control, MAC layer. With MAC protocols, simultaneous communication can be achieved with minimum interference from different nodes and negligible co-channel interference. On the other hand, adjacent-channel interference can be regarded as a noise. In this aspects, signal-to-noise ratio (SNR) at a distance d from the transmitter can be defined as [4]:
…………(1)
where Pt and Pn are the transmitted and noise powers in dB,
respectively and PL(d) is the path loss at distance d from the transmitter. One of the important factor in data communication is the Bit Error Rate, BER, that depends on the ratio of energy per bit to noise spectral density, Eb/No,
which can be defined as [4]:
………..(2)
where ψ is the received SNR, BN is the noise bandwidth and R
is the data rate. The BER can be related and computed from the energy per bit that depends on the modulation type that affects the energy per bit.
Multiple access techniques assign the channels to different users. The most common multiple access techniques are frequency-division multiple access (FDMA), time-division multiple access (TDMA) and code-division multiple access (CDMA [5]. These multiple access are a single carrier system, a single fade or interferer may cause the entire link to fail. Efficient type of multiple access are multicarrier system, where only a small percentage of the subcarriers will be affected. Orthogonal frequency division multiplexing (OFDM) is a distinctive case of multicarrier transmission, where as a single data stream is transmitted over a number of lower rate subcarriers. OFDM can be realized as either a modulation technique or a multiplexing technique. One of the important reasons of using OFDM is to increase the robustness against frequency selective fading or narrowband interference [6].
2.1 Time Division Multiple Access TDMA
With TDMA, the entire system bandwidth are divided into channels such that each user is assigned a different cyclically-repeating timeslot, that represents a channel. These will causes Intersymbol Interference, ISI, Furthermore, a buffering is also required. However, the TDMA has the feature that it is simple to assign multiple channels to a single user.The main difficulty of TDMA, at least for uplink channels, is the requirement for synchronization among the different users. More specifically, in a downlink channel all signals originate from the same transmitter then pass through out the same channel to any given receiver. Hence, for flat-fading channels, if the users transmit on orthogonal timeslots the received signal will maintain this orthogonally. Nevertheless, in the uplink channel the users transmit over different channels with different respective delays. In order to maintain orthogonal timeslots in the received signals, the different uplink transmitters must synchronize such that after transmission through their respective channels, the received signals are orthogonal in time. This synchronization is typically coordinated by the base station or access point, and can entail
significant overhead. Multipath can also destroy time-division orthogonally in both uplinks and downlinks if the multipath delays are a significant fraction of a timeslot. Therefore the TDMA channels often have guard bands between them so as to compensate for synchronization errors and multipath. Further difficulty with TDMA is that with cyclically repeating timeslots the channel characteristics change on each cycle. This makes the receiver to re-estimate the channel on each cycle [5].
2.2 Code Division Multiple Access CDMA
With CDMA, the information signals from each user is modulated by orthogonal or non-orthogonal spreading codes. These modulated signals from different users at any instant are simultaneously occupy the same time and bandwidth. Each intended user should use the same spreading code used at the transmitter[5]. In the downlink, orthogonal spreading codes are the most likely used code such as Walsh-Hadamard code. However, in the uplinks, non-orthogonal codes are the most likely codes used. This is because of user synchronization and the complexity problem and difficulty [7]. Furthermore, the non-orthogonal CDMA in uplinks has an advantages of less dynamic coordination of users in time or frequency is required.A non-orthogonal CDMA scheme also needs power control in the uplink to compensate for the near-far effect. The near-far effect rises in the uplink because the channel gain between a user’s transmitter and the receiver is dissimilar for different users. Furthermore, CDMA systems with non-orthogonal spreading codes can use MUD (Multi-User Detection) to lessen interference between users. MUD is responsible for providing considerable performance improvement even under perfect power control, and works even better when the power control is jointly optimized with the MUD technique [8]. CDMA with different forms of multiuser detection achieves the Shannon capacity of both the uplink and the downlink, although the capacity achieving transmission and reception strategies for the two channels are very different [5].
2.3
Orthogonal
Frequency
Division
Multiplexing OFDM
In OFDM high-rate data stream are transmitted over number of lower rate streams using multicarrier principle. This feature will eliminate the problem intersymbol interference [6]. Thus, an OFDM signal can be computed as a sum of individual modulated signals, given by [6]:
………(3) where:
NS is the number of subcarriers.
T is the symbol duration. fc is the carrier frequency.
operations in the IDFT. In the receiver side, the subcarriers are demodulated by the FFT, which is the reverse operation of the IFFT [6].
2.4 Hybrid Techniques
Many systems use a mixture of different multiple access schemes to allocate signaling dimensions. OFDMA can be combined with tone hopping to enhance frequency diversity [9]. DSSS can be combined with FDMA to break the system bandwidth into subbands. In this hybrid method different users are assigned to different subbands with their signals spread across the subband bandwidth. Within one subband, the processing gain is smaller than it would be over the entire system bandwidth, so interference and ISI rejection has reduced. Yet, this technique does not require contiguous spectrum between subbands, and also allows more flexibility in spreading user signals over different size subbands based on their requirements. Another hybrid method combines DS-CDMA with FH-DS-CDMA so that the carrier frequency of the spread signal is hopped over the available bandwidth. This lessens the near-far effect since the interfering users change on each hop. Instead of, TDMA and FH can be combined so that a channel with deep fading or interference is only used on periodic hops, so that the fading and interference effects can be mitigated by error correction coding. This idea is used in the GSM standard, which combines FH with its TDMA scheme to reduce the effect of strong interferers in other cells [5].
3.
PROPOSED CLUSTERED AND
MULTPLE ACCESS SYSTEMS
3.1 Proposed TDMA-TDMA-OFDM
System (System 1)
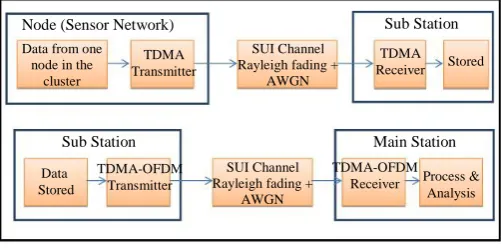
This system has two forms of multiple accesses. The first one is between the main- station and sub-station which has been assumed to be TDMA-OFDM. The second form of access method is between sensors nodes and sub-station which is TDMA. This has been implemented in a form shown in Figure (1). This system configuration has some features that depend on the TDMA, and TDMA-OFDM systems. The system has two stages of transceiver as shown in Figure (1).
In system 1, there are two time slots (ts1) and (ts2). The time slot (ts1) is controlled by the main station and is used for assigning what sub-station begins to receive from its nodes and sends its data to the main station. On the other hand, time slot (ts2) is controlled by the sub-station and is used for assigning which node in the cluster begins to transmit the data.
Assume that the slot (ts1) has been assigned to cluster (1) and slot (ts2) has been assigned to node (1). Furthermore, it is
supposed that node1 has gathered the data of (2048) bits in binary mode, sampled it to (1024) samples, and transmitted it to station using (TDMA) system. In this case the sub-station will receive data by (TDMA) receiver and stores it to its memory until all of the nodes in the cluster sent their data. When node 1 finishes sending its data, the sub-station assigns the time slot (ts2) to node 2, which transmits its data in the same way that used by node 1 and so on. When all the nodes in the cluster finishes sending their data, the sub-station sends the collected data which stored in memory (1024 * K) samples where K is the number of nodes in the cluster of sub-station to main sub-station by using (TDMA-OFDM) system.
When the main station receives data by (TDMA-OFDM) receiver, the data is processed and analyzed to make a decision about the data. The main station sends a control signal (S) to sub-station to sleep all the nodes in the cluster and then moves time slot (ts1) to another cluster.
3.2.
Proposed
CDMA-CDMA
System
(System 2)
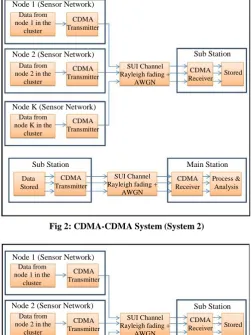
This system has two forms of multiple accesses. The first one is between the main- station and sub-station which has been assumed to be CDMA. The second form of access method is between sensors nodes and sub-station and it is also CDMA. This has been implemented in a form shown in Figure (2). The system configuration has some features that depend on the CDMA system. The system has two stages of transceiver as shown in Figure (2).
From Figure (2), there is one timeslot (ts) that has been controlled by main station. When it is assigned to a cluster, the cluster is ON and it begins to send its data whereas the other clusters are OFF and sleep in all the nodes. Now suppose (ts) is given to cluster (1), all the nodes in cluster (1) are ON but all the nodes in other clusters are OFF. The nodes in cluster (1) gather its data and transmit it to sub-station using CDMA system. Each node transmits (2048) binary bits (sampled to 1024 samples) to sub-station. The sub-station receives the data by the CDMA receiver and stores it in the memory. When all the nodes in cluster (1) finish sending their data, the sub-station will retransmit this data to the main-station using CDMA transmitter. Next, the main-main-station receives the data by the CDMA receiver, process and analyses it and makes a decision about it. When the main station finishes sending the data, a control signal (S) will be sent to the sub-station to sleep all the nodes in the cluster and moves the timeslot (ts) to another cluster (cluster 2).
3.3.
Proposed
CDMA-TDMA-OFDM
System (System 3)
This system has two forms of multiple accesses. The first one is between the main-station and sub-station which has been assumed to be TDMA-OFDM. The second form of access method is between sensor nodes and the sub-station which is assumed to be CDMA. This system has been implemented in a form shown in Figure (3). The system configuration and features depend on CDMA, and TDMA-OFDM systems. The system has two stages of transceiver as shown in Figure (3).
Node (Sensor Network)
Data from one node in the
cluster
TDMA Transmitter
SUI Channel Rayleigh fading +
AWGN
TDMA Receiver
Sub Station
Stored
Data Stored
TDMA-OFDM Transmitter
SUI Channel Rayleigh fading +
AWGN
TDMA-OFDM Receiver
Sub Station Main Station
[image:3.595.39.290.523.648.2]Process & Analysis
From Figure (3), there is one time slot (ts) that has been controlled by the main station. When it is assigned to a cluster, the cluster is ON and begins to send its data while the other clusters are OFF and sleep. Now assume (ts) is given to cluster (1), all the nodes in cluster (1) are ON but all the nodes in other clusters are OFF. The nodes in cluster (1) gather their data and transmit it to sub-station using the CDMA system. Each node transmits (2048) binary bits (sampled to 1024 samples) to the sub-station. The sub-station receives the data by CDMA receiver and stores it to memory when all the nodes in the cluster (1) finish sending their data, the sub-station re-transmits these data to the main-sub-station using TDMA-OFDM system (TDMA-OFDM transmitter).
When the main station receives data by (TDMA-OFDM) receiver, the data will be processed and analyzed to make a decision about these data. Finally, the main station sends a control signal (S) to sub-station to sleep all the nodes in the cluster and moves time slot (ts) to another cluster.
3.4. Proposed
TDMA-OFDM_TDMA-OFDM System (System 4)
This system has two forms of multiple accesses. The first one is between the main- station and sub-station which is assumed to be TDMA-OFDM. The second form of access method is between sensors nodes and sub-station and it is also TDMA-OFDM. The system has two stages of transceiver as shown in Figure (4).
From Figure (4), there are two time slots (ts1) and (ts2). The time slot (ts1) is controlled by the main station and used for assigning what sub-station begins to receive from its nodes and sends its data to the main station. Yet, time slot (ts2) is controlled by the sub-station and is used for assigning which node in the cluster begins to transmit the data.
Suppose that the time slot (ts1) has been assigned to cluster (2) and time slot (ts2) has been assigned to node (1). Moreover, node1 has gathered the data of (2048) bits in binary mode, samples it to (1024) samples and transmits these data to the sub-station using (TDMA-OFDM). In this case the sub-station receives the data by the (TDMA-OFDM) receiver and stores it in its memory until all of the nodes in the cluster send their data. When node 1 finishes sending its data, the sub-station assigns the time slot (ts2) to node 2. Next, node 2 transmits its data in the same way as that used by node 1 and so on. Having all the nodes in the cluster finishes sending their data, the sub-station sends the collected data, which stored in memory (1024 * K) samples to main station by using also (TDMA-OFDM) system. It is worth to mention that K is the number of nodes in the cluster of sub-station.
Finally, when the main station receives data by (TDMA-OFDM) receiver, the data is processed and analyzed to make a decision about the data. The main station sends a control signal (S) to sub-station to sleep all the nodes in the cluster and then moves time slot (ts1) to another cluster (cluster 3).
4. PROPOSED SYSTEM SIMULATION
AND EVALUATION
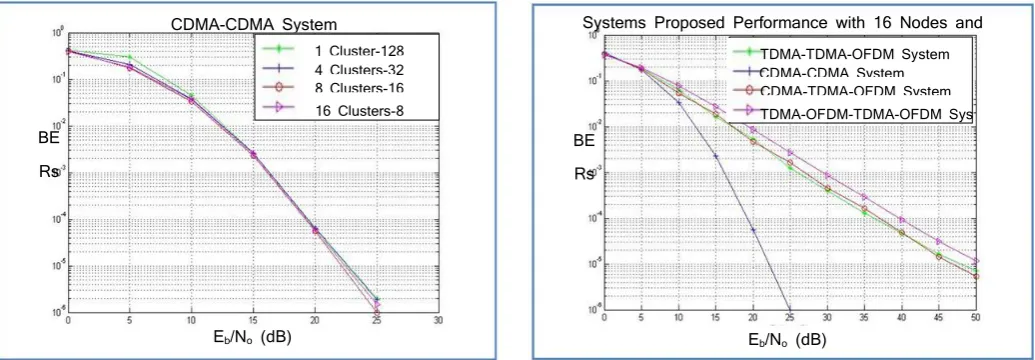
The proposed systems 1, system 2, system 3 and system 4 have been simulated using Matlab 10 and evaluated. In the simulation different sizes of clusters cases have been investigated. In the evaluation the BER performance for each case have been computed as shown in Figures (5), (6), (7) and (8) respectively for systems 1,2, 3 and 4.
Figures (5), (6), (7) and (8) have shown the performance of systems 1, 2, 3 and 4 respectively with different size of cluster. The comparison assumes that, at each case the total number of nodes are 128 nodes and these may divide into 1, 4,
Node 1 (Sensor Network)
Data from node 1 in the
cluster
CDMA Transmitter
SUI Channel Rayleigh fading +
AWGN CDMA Receiver Sub Station Stored Data Stored
Sub Station Main Station
[image:4.595.37.289.83.419.2]Process & Analysis
Fig 2: CDMA-CDMA System (System 2)
Node 2 (Sensor Network)
Node K (Sensor Network)
Data from node 2 in the
cluster
Data from node K in the
cluster CDMA Transmitter CDMA Transmitter SUI Channel Rayleigh fading +
AWGN
CDMA Receiver CDMA
Transmitter
Node 1 (Sensor Network)
Data from node 1 in the
cluster
CDMA Transmitter
SUI Channel Rayleigh fading +
AWGN CDMA Receiver Sub Station Stored Data Stored
Sub Station Main Station
[image:4.595.309.565.181.324.2]Process & Analysis
Fig 3: CDMA-TDMA-OFDM System (System 3)
Node 2 (Sensor Network)
Node K (Sensor Network)
Data from node 2 in the
cluster
Data from node K in the
cluster CDMA Transmitter CDMA Transmitter TDMA-OFDM Receiver TDMA-OFDM Transmitter SUI Channel Rayleigh fading +
AWGN
Node (Sensor Network)
Data from one node in the
cluster
SUI Channel Rayleigh fading +
AWGN
Sub Station
Stored
Data Stored
Sub Station Main Station
Process & Analysis
Fig 4: TDMA-OFDM - TDMA-OFDM System (System 4) TDMA-OFDM
Receiver TDMA-OFDM
Transmitter
SUI Channel Rayleigh fading +
AWGN TDMA-OFDM
Transmitter
[image:4.595.40.289.307.551.2]8 and 16 clusters. It is clear from the performance results (SNR vs BER), that there is no much difference in dividing the 128 nodes into 1, 4, 8 or 16 with all of the proposed system. The results also indicate that system 2 gives the best performance comparing to other systems. Furthermore, almost all other systems 1,3 and 4 give the same performance compared with each others as shown in Figure (9). The most important thing that can be achieved from this investigation is the saving in power achieved via the use of clustering and multiple access techniques with all proposed systems. This has been conducted based on the results presented in Figures (5-8).
From Figures (5), (6), (7) and (8), it is clear that the performances of proposed systems (system 1, system 2, system 3, and system 4) with different cases of clustering are approximately the same. Furthermore, Figure (9) shows that the performance of the four systems are approximately is the same.
TDMA-TDMA-OFDM System 1 Cluster-128
Nodes 4 Clusters-32
Nodes 8 Clusters-16
Nodes 16 Clusters-8
Nodes
Eb/No (dB) BE
[image:5.595.310.562.86.264.2]Rs
[image:5.595.44.291.274.464.2]Fig 5: System 1 Performance with Different Cluster Cases
Fig 6: System 2 Performance with Different Cluster Cases
1 Cluster-128 Nodes 4 Clusters-32
Nodes 8 Clusters-16
Nodes 16 Clusters-8
Nodes CDMA-CDMA System
Eb/No (dB) BE
[image:5.595.102.548.284.473.2]Rs
Fig 7: System 3 Performance with Different Cluster Cases
1 Cluster-128 Nodes 4 Clusters-32
Nodes 8 Clusters-16
Nodes 16 Clusters-8
Nodes CDMA-TDMA-OFDM System
Eb/No (dB) BE
Rs
Fig 8: System 4 Performance with Different Cluster Cases
1 Cluster-128 Nodes 4 Clusters-32
Nodes 8 Clusters-16
Nodes 16 Clusters-8
Nodes TDMA-OFDM – TDMA OFDM
System
Eb/No (dB) BE
Rs
Fig 9: Systems Proposed Performance with 8 Clusters and 16 Nodes/ Cluster Case
TDMA-TDMA-OFDM System CDMA-CDMA System CDMA-TDMA-OFDM System TDMA-OFDM-TDMA-OFDM Sys Systems Proposed Performance with 16 Nodes and
8 Clusters
Eb/No (dB) BE
[image:5.595.45.563.508.688.2]The results also show that system 2 has the best performance from the others systems according to less error rate (BER) and so it has less re-transmission data caused by error or damage packet transmission. The results also show that performance through Walsh code for system 2 is most preferable code because it has strong randomness and orthognality and less error rate from other types of codes. The results also show that system 1 and system 3 approximately have the same performance. Finally, system 4 has the worst performance and more error rate (BER). This will causes more re-transmission data and large active mode and more consumed power.
The consumed power at each size of cluster for each one of the proposed systems 1-4 that has been simulated within a period of 60 sec has been calculated. In this aspects, there are some parameters that should be assumed. These parameters have no effect on the consumed power, but it necessary to achieve the required calculations. The following can be assumed:
Active mode power = 60 mW / sec. Transmit mode power = 50 mW / sec. Sleep mode power = 2 mW / sec.
Data transmit time of each node = 3 sec and each bit takes (3 / 2048) sec to transmit.
Each transmission required 3 sec for transmission, 3 sec for re-transmit and 2 sec guard.
Since
Error bit = BER * No of clusters * No of nodes * No of transmit bits …(6)
Thus
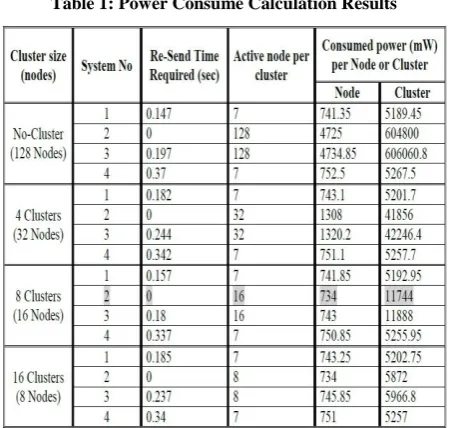
Power consumed/node = (Active mode power * Active time/node) + (Transmit mode power * Transmit time) + (Sleep mode power * Sleep time) + (Transmit mode power * Time required to re-transmit error bits) …………....(7) Using Equations (6) and (7) together with the results presented in Figures (5-8), the power consumption have been calculated and tabulated as shown in Table (1). The results in Table (1) show the effects of cluster and multiple access through the parameters which have been calculated depending on equations (6, 7) and the assumption. It is clear that these calculations depend on an automatically repetition of the sending period when all the nodes and clusters finish sending the data.
From Table (1), system 1 has approximately the same value of power consumption at different size of cluster. This is because TDMA system does not affected by clustering process. The same can also applied to system 4.
It is clear from Table (1) that the performance of system 2 with 8 clusters and 16 nodes is less consumed power. Furthermore, Table (1) shows that systems 2 and 3 with no clustering or four cluster cases consumes the largest amount of power (4725 mW, 4734.85 mW, 1308 mW, and 1320.2 mW) either per node or per cluster among the other cases. This is because for no-cluster all the nodes of these systems remain on active mode and did not switch to sleep mode. However, Table (1) shows and for other multi-clustering cases systems 2 and 3 become less power consuming than the cases of no-clustering. This is because that some nodes at clustering switch to sleep mode. The best achieved performance for all the systems investigated are systems 2 and 3 at with 8 clusters and 16 nodes in a cluster.
Finally, Table (1) shows that system 2 clearly has the best performance but in 16 nodes per cluster with system has 8 clusters. The effect of clustering not appear at the BERs characteristics. However, from Table (1) it becomes more
clear that the system with 1 (or no) clustering consume 84.85% power larger than system with 8 cluster.
5. CONCLUSION
This thesis focuses on energy consumption using physical layer and the methods which decrease the energy consumption of WSN. The research presented in this thesis reaches to the following conclusions;
1. Power calculation shows the effects of the clustering on the proposed systems, these effects appear on the CDMA systems (system2, system 3), in the other hand the clustering does not effect on TDMA system so all TDMA system (system 1, system 4) approximately have the same consumed power of all the size of cluster.
2. The results of simulation and power calculation lead to that the best system is system 2 which consumes less power than the other systems on the 8 clusters with 16 nodes in each cluster case.
6. REFERENCES
[1] M .Sheik Dawood, et al, “A Survey on Energy Efficient Modulation and Coding Techniques for Wireless Sensor Networks”, Journal of Global Research in Computer Science, VOL. 4, No 1, 2013.
[2] K. Sohraby, D. Minoli, and T. Znati, “Wireless Sensor Networks Technology, Protocols, and Applications”, John Wiley & Sons, Inc., 2007.
[3] T. Shu and M. Krunz, “Energy-Efficient Power/Rate Control and Scheduling in Hybrid TDMA/CDMA Wireless Sensor Networks”, IEEE GLOBECOM Conference, San Francisco, Dec. 2006.
[4] I. F. Akyildiz, and M. C. Vuran, “Wireless Sensor Networks”, John Wiley & Sons Ltd., 2010.
[5] A. Goldsmith, “Wireless Communications”, by Cambridge University Press, 2005.
[image:6.595.317.542.112.326.2][6] T. Sumathra, N. S. Nagaraja and B. Shreeganesh “Chaotically Modulated RSA/SHIFT Secured IFFT/FFT Based OFDM Wireless System”, IJERT, Vol. 2, Issue 4, 2013.
[7] A. S. Cacciapuotig, “The Role of the Widely Linear Processing in the Narowband”, PhD thesis, Università degli Studi di Napoli, 2008.
[8] J. Shapira, and S. Y. Miller, “CDMA Radio with Repeaters”, Springer US, 2007.