Traffic based Dynamic Request Control System For Web
Page Analysis
Akash
Computer Science and Engineering Dept, MNNIT
Allahabad, India
Namrita Pandita
Electronics and Communication Engineering Dept, MNNIT Allahabad, India
Aditya Chaudhary
Electronics and Communication Engineering Dept, KIET Ghaziabad, India
Abstract
Web analytics has become an important business and market research tool for measuring and improving the effectiveness of a website. Web analytics requires to log in the database, information like the number of visitors visiting a web page or country of the visitor, some other information related to the visitor or web page. Considering the fact that some web pages attract huge traffic in relatively short time, either because it has gone viral or due to marketing or any other reason. As the number of page views increase exponentially, the rate of requests coming to web analysis server and entries into their database can become significantly high. In such cases, server might not sustain such load and which will consequently affect the web analysis of server’s performance. This paper proposes a request control system which dynamically updates the amount of requests coming from a web page under analysis, based on the number of visitors visiting the web page, and still is able to maintain the accurate count of visitors visiting web page with error less than 1.1%. This paper presents the performance measurements for the proposed system as well as analyzes the efficiency and limitations of this approach.
General Terms
Load reduction, Algorithm, Dynamic System, Data Collection
Keywords
Web analytics, Content Delivery Network, Redis, Internet Marketing
1.
I
NTRODUCTIONWith the advent of the internet marketing also called online advertising [1], the web page analysis has become the need of the hour. Measuring, collecting and analysis of the information from the web page is important for the purpose of understanding and optimizing web usage and to improve the effectiveness of the web site. Web analysis can be used both by the owner of the website or by the advertising companies to estimating data like the number of users visiting a web page, country from where the maximum hits are coming, places on a web page where the chances of mouse hovering or clicking is more than usual, collecting information about the visitor who clicked on an advertisement or how many times an advertisement has been shown on a web page etc. is a crucial part of the analysis. So, whenever any of the above analytical events occur then usually a call back request is made from the browser to the web analysis server using any of the various techniques available like java script or AJAX solutions etc. Web analysis server then usually makes a database entry corresponding to that request from the web
page. Now with the exponential growth of the World Wide Web users and rapid increase in the use of social media and marketing techniques [2] for website, the chances of a web page getting huge traffic in short time is relatively very likely. The number of users visiting a web page can increase from several hundred to million within minutes and hence the probability of occurring of analytical events also increases exponentially. As a result the load on the web analysis server as well as on the database server will also increase drastically. It’s in such cases some dynamic mechanism is needed which can control the load coming to the web analysis server during that short period of time.
There are various techniques to control such high traffic on a web server like using distributed load balancing systems for web servers [3] by using various proposed solutions and for database server load balancing techniques like replication, Sharding [4] etc. But such techniques are expensive and are for handling the high traffic which persists constantly throughout the day. But there are some cases like entertainment or news websites where when some new and interesting information comes then leading to the increasing internet connectivity among people, huge traffic starts coming on that particular web page but this traffic persists momentarily and then it fades out because the information becomes obsolete. In such cases it is not considered economical or optimal to install more hardware or use various load balancing techniques as traffic persists only momentarily. It is for such cases this paper proposes the dynamic request control system which dynamically controls the amount of requests coming from any web page to analysis server based on the amount of traffic coming on the web page that to without needing to install extra hardware. System starts controlling the load on web analysis server if the load starts increasing above some predefined threshold requests in a particular time interval.
needed, by calculating the minimum hits required on the web page to keep the error minimum by using the testing method that is proposed in this paper. The system tries to keep the error percentage of the number of visitors on web page measured by the dynamic system to the actual number of visitors less than or equal to 1.1%.
2.
THE
ARCHITECTURE
OF
THE
DYNAMIC
REQUEST
CONTROL
SYSTEM
2.1
E
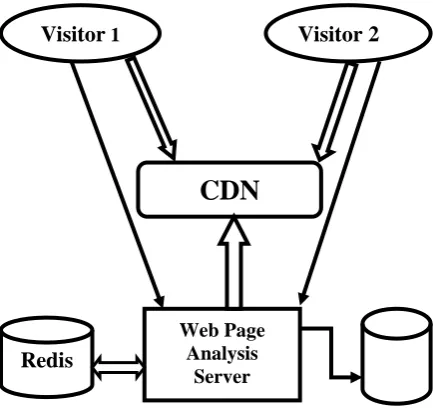
LEMENS OF THE SYSTEM [image:2.595.310.548.355.505.2]Architecture as shown in the “Fig. 1” is used for the web page analysis. It consists of five elements: a web analysis server, an In-memory data storage (Redis), Content Delivery Network (CDN), a Database server and visitors visiting a web page. The web page analysis server is used to gather data from the requests which come to it whenever the web page gets a hit. It processes the data for statistical analysis and sends the relevant data to the database server for storing relevant information. For storing some temporary information which is used to decide the logging percentage at the server, Redis [6] is used which is an open-source, in-memory, key-value data store. Content delivery network (CDN) [7] is a large distributed system of servers deployed in multiple data centers across the internet with a goal to server the content to end users with high availability and high performance. CDN is used here to store the dynamic controller java script file. Then there are end users which opens the web page which is under analysis.
Figure 1. Dynamic Request Control System Architecture
2.2
S
TATIC CONTROLLEROn the web page, html code is put in an iframe tag, this code is called static controller. It is static in nature and code once put on the web page never changes. When the web page is rendered in the web browser, static controller in the iframe is executed. This script contains a link to the CDN server which could look like this "http://cdn.we.net/dyncontroller.js". The dynamic controller file is fetched from the CDN servers and is executed in the browser.
2.3
D
YNAMIC CONTROLLERThis java script file is dynamic in nature. Whenever the traffic increases on the web page, dynamic controller file with new logging percentage value is uploaded on CDN by the web analysis server. The dynamic controller is fetched from the CDN by browsers and then executed and it is the code in this controller which decides whether to send a request to web analysis server or not using the logging percentage value set in the file.
3.
IMPLEMENTATION
OF
THE
DYNAMIC
REQUEST
CONTROL
SYSTEM
[image:2.595.55.272.418.625.2]When the web page is rendered, the static controller calls the dynamic controller which in turn decides whether to send a request to analysis server or not. The request always contains the logging percentage used to determine whether to send the request to server or not. So, if a request is sent, then the count of visitors who visited that web page is increased with a value as shown in the TABLE I corresponding to the percentage in the request.
TABLE I. VALUE USED TO INCREASE THE VISITOR COUNT OF A WEB PAGE WHEN REQEST
RECEIVED WITH PARTICULAR LOGGING PERCENTAGE
Sr. No.
Logging
Percentage Visitor Count
1 100 1
2 50 2
3 20 5
4 10 10
5 5 25
6 2 50
.
Thus, if a request is received with logging percentage as 100% then count is increased by 1, if logging percentage is 50% then count is increase by 2 and so on. The total count of visitors on a web page is maintained in the database server whereas a 10 min count of visitors is maintained in Redis. The use of this 10 min count is discussed later.
3.1
A
LGORITHM AND WORKING OF THE DYNAMIC CONTROLLERDynamic controller uses following algorithm to determine whether to send a request to web analysis server or not :
Var x = getRandomNumberBetween 1 to 100 If ( x < = dynamicPercentage )
Then
Send request To Analysis Server With dynamicPercentage and other relevant information
In above algorithm the dynamicPercentage is a variable whose value is calculated by the web analysis server. When the traffic increases on the web page, new dynamicPercentage is calculated and the dynamic controller with new dynamicPercentage value is uploaded by the server on CDN.
Visitor
1Visitor 2
CDN
Web Page Analysis
Server
In dynamic controller, a random number is generated between 1 and 100 (inclusive of 1 and 100), now if the number generated is less than or equal to the dynamicPercentage then a request is sent to the analysis server with the all the needed information along with the dynamic logging percentage otherwise not. So, if the logging percentage is 100%, then all the requests will be sent to the server with probability of 1 as the number generated will always be less than or equal to 100. And the server will increase the count of visitors for the web page as 1 in database and Redis. Similarly, if logging percentage is 50% then if the random number generated is less than or equal to 50 then request will be sent otherwise not. Thus, the probability of the request sent will be ½ if the random number generator is perfect. And the count at the server will be increased by 2 corresponding to the web page. Similarly, if the logging percentage is 20% then if the number generated is less than or equal to 20 then the request will be sent otherwise not. Thus, the probability of the request generated will be 1/5 if the random number generator is perfect and the count at server will be increased by 5 and so on for other percentages. So next the accuracy of random number generator is determined.
3.2
A
CCURACY OF RANDOM NUMBER GENERATORThe random number will be generated on the browser as the dynamic controller runs on the browser. So the function used is the java script Math.random() function. The accuracy of the random function is tested corresponding to logging percentage p, so as to find a number n, for which if the random function if called n times then the probability of numbers less than or equal to p is almost p/100 with error less than 1.1%. Thus if p=50 then probability of sending a request should be close to ½. The algorithm used to find such number n corresponding to logging percentage p is given below:
Var totalHits = n
Var dynamicPercentage = p Function generateRandom()
generates random number between 1 to 100 Function getNumbersLessThanPercentage
Var count = 0 For x = 1 to totalHits
Var rand = generateRandom() If ( rand <= dynamicPercentage)
loggingRequests = loggingRequests + 1;
Return logginRequests
Function calculateMeanErrorAndMeanExpectedHits Var error[1000]
Var expectedHits = (n * p)/100 For x = 1 to 1000
Var hits = getNumberLessThanPercentage() error[x] = absoluteValue( hits - expectedHits) Var meanError = getMeanError(error, 1000)
Var sD = getStandardDeviation(error, 1000)
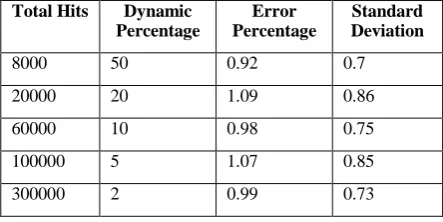
Since the java script can run on any of the browsers, so the algorithm was tested on all the prominent browsers Chrome (v21), Mozilla Firefox (v14.01), Internet Explorer (v7) and Safari (v5.1). Now the above code was tested on different web browsers with p values as 50, 20, 10, 5 and 2, and varying the n value such that to find a value n for each p for which the error percentage become as close 1.1%. TABLE II shows the minimum n value to be used to get error percentage less than 1.1%.Thus, the TABLE II shows that if logging percentage is set to 50% then there must be at least 8000 hits on the web
[image:3.595.325.547.211.322.2]page to generate around 4000 requests for the web analysis server with error less than 1.1%. The server will receive 4000 requests which will be multiplied by 2 determined from TABLE I as the logging percentage is 50% and this gives 8000 requests which is the actual count of hits on the web page. It should be noted that the values in the TABLE II are not final and depends on the random function used. So by using a better random function the limits on the percentage can be reduced further.
TABLE II. HITS USED TO GENERATE REQUESTS FOR ANALYSIS SERVER WITH A CERTAIN
PERCENTAGE AND ERROR GENERATED
Total Hits Dynamic Percentage
Error Percentage
Standard Deviation
8000 50 0.92 0.7
20000 20 1.09 0.86
60000 10 0.98 0.75
100000 5 1.07 0.85
300000 2 0.99 0.73
3.3
S
ERVER SIDE IMPLEMENTATIONAt server side, the number of hits on a web page for a certain time frame is stored along with the timestamp of the first request in that time frame. For implementation time frame is 10 minutes. This information is stored in the Redis with key equal to the web page URL and the values as the total hits in that time frame and the timestamp of first request in that time frame. After receiving a request, a database entry is made and count is increased in Redis corresponding to that URL based on number of counts determined from TABLE I. The algorithm used at server side is:
Var timeFrame = 10 min
Fuction request ( url, oldPer ) then Var newPer = oldPerc
Var incrementBy = 100 / oldPer
Var startTime = getFrameStartTimeForURL(url) Var hits = getHitsForURL(url)
Var nextHigherLimit = getNextHigherLimit( oldPerc ) If( ( currTime() - startTime ) > timeFrame)
newPer = getNewLoggingPercentage ( hits ) setFrameStartTimeForURL( url, currentTimeStamp )
setHitsForURL(url, 0 ) incrementUrlHits( incrementHitsBy ) If ( newPer ! = oldPer )
Update the dynamic controller script with the new percentage logging value
Upload the dynamic controller with new logging percentage on CDN
Function getNewLoggingPercentage( hits ) If ( hits < 20000 )
Return 100 Else if ( hits < 60000 )
Return 50 Else if ( hits < 100000 )
Return 10 Else if ( hits < 300000)
Return 5 Else
Function getNextHigherLimit( per ) If ( per > 50 )
Return 8000 Else if ( per > 20 ) Return 20000 Else if ( per > 10 )
Return 60000 Else if ( per > 5 ) Return 100000 Else
Return 300000
The above algorithm uses redis for storing this 10 min information about the web page and after completion of a given time frame determines what should be the new logging percentage for the dynamic controller and uploads the controller with new logging percentage on CDN. It keeps the count of visitors visiting a web page in a 10 min frame. If a request comes after the completion of the 10 min time frame, new percentage is calculated using the visitors count, start time of new frame is set and count for that URL is set to 0. If the new logging percentage is same as previous one then dynamic controller is not changed otherwise new file is uploaded. So, if traffic was high in previous 10 minutes then it is assumed that the chances of traffic being high in next 10 min are also equally likely. So, the dynamic controller with new logging percentage is uploaded on CDN and will run whenever the web page is opened and fewer requests will be generated. As traffic will fade, the visitor count on the redis will decrease and after 10 min frame completion new dynamic percentage will be calculated and used, which will increase the amount of traffic in the web analysis server. And thus in this manner traffic is controlled on the web analysis server with change in the traffic on the web page dynamically.
4.
TESTING
AND
RESULTS
For testing the actual hit counts was stored as well as the counts generated by the system in the database and they were compared with each other after completion of 1 day. The testing was performed on web pages of some famous web sites like “autos.yahoo.com”, “thekrazycouponlady.com”, “desirulez.net”, “liveonsat.com” and “therichest.org”. The code was tested real time on working web pages instead of creating simulation. Since it is not possible to generate traffic as high as 300000 on a web page so for the test it was decided to reduce the limits of the percentage to 1/10th of the limit to generate data and control the request rate more aggressively. For testing purposes functions changed to
Function getNewLoggingPercentage( hits ) If ( hits < 800 )
Return 100 Else if ( hits < 2000 )
Return 50 Else if ( hits < 6000 )
Return 20 Else if ( hits < 10000 )
Return 10 Else if ( hits < 30000 )
Return 5 Else
Return 2
Function getNextHigherLimit( per ) If ( per > 50 )
Return 800 Else if ( per > 20 ) Return 2000
Else if ( per > 10 ) Return 6000 Else if ( per > 5 )
Return 10000 Else
Return 30000
On a given day for a particular website the data collected contains
4.1
R
EQUESTS WITHL
OGGINGP
ERCENTAGE AS X%
Total number of requests coming to the web analysis server in a day with dynamic logging percentage used at the time of the request generation as x% in dynamic controller.
4.2
T
OTALR
EQUESTSTotal requests coming to the web analysis server in a day.
4.3
T
OTALV
ISITORS ONW
EB PAGETotal number of visitors on a web page in a day is calculated by multiplying the number of requests with the corresponding visitor count based on the logging percentage associated with the request as shown in TABLE I.
4.4
A
CTUALV
ISITORSActual number of visitors on a web page is calculated by sending every request to the server when visitor visits. This is the true count of visitors on a web page and is used to compare with the visitors calculated by the system.
4.5
E
RROR%
AGEError between the number of actual visitors on the web page and the visitors calculated by dynamic system. Aim is to keep this error %age less than 1.1%.
4.6
R
EQUESTSR
EDUCTION%
AGEThe %age of reduction of the requests coming to the analysis server after using the dynamic request control system. This tells us that whether there was any reduction in the requests coming to server or not.
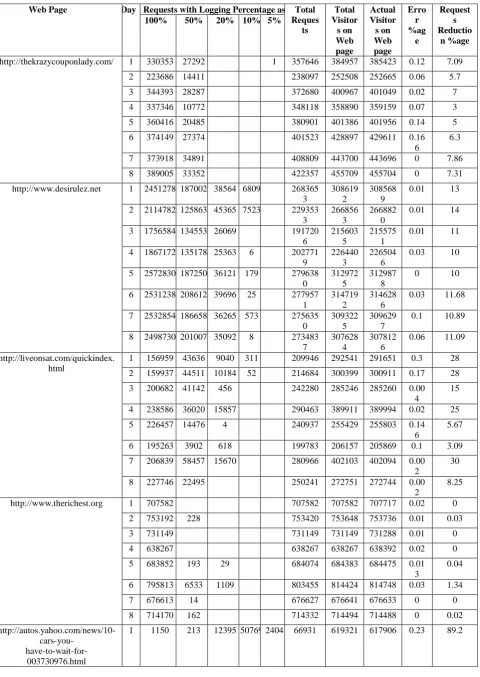
As shown in the results in the TABLE III, it is quite clear that even with the reduced limits the error percentage is as low as 0.3%. Reduction in the requests coming to the web analysis server is as high as 89.2% for web page “autos.yahoo.com”. Even though the actual hits on “autos.yahoo.com” is much less than the actual hits on “desirulez.net”, the reduction in requests is significantly higher which clearly suggests that the tendency of achieving high traffic in relatively less time frame was much higher on “ autos.yahoo.com ” site than any other site and hence more reduction. Similarly, the traffic on web page “therichest.org” was just double than “liveonsat.com” but because of uniform distribution of the traffic throughout the day the reduction in the requests coming to web analysis server is almost 0.
TABLE III. Percentage error in requests and requests reduction calculation based on the one day data collected for the various web pages.
Web Page Day Requests with Logging Percentage as Total Reques ts
Total Visitor s on Web page
Actual Visitor s on Web page
Erro r %ag
e
Request s Reductio
n %age 100% 50% 20% 10% 5%
http://thekrazycouponlady.com/ 1 330353 27292 1 357646 384957 385423 0.12 7.09
2 223686 14411 238097 252508 252665 0.06 5.7
3 344393 28287 372680 400967 401049 0.02 7
4 337346 10772 348118 358890 359159 0.07 3
5 360416 20485 380901 401386 401956 0.14 5
6 374149 27374 401523 428897 429611 0.16
6
6.3
7 373918 34891 408809 443700 443696 0 7.86
8 389005 33352 422357 455709 455704 0 7.31
http://www.desirulez.net 1 2451278 187002 38564 6809 268365 3
308619 2
308568 9
0.01 13
2 2114782 125863 45365 7523 229353 3
266856 3
266882 0
0.01 14
3 1756584 134553 26069 191720 6
215603 5
215575 1
0.01 11
4 1867172 135178 25363 6 202771 9
226440 3
226504 6
0.03 10
5 2572830 187250 36121 179 279638 0
312972 5
312987 8
0 10
6 2531238 208612 39696 25 277957 1
314719 2
314628 6
0.03 11.68
7 2532854 186658 36265 573 275635 0
309322 5
309629 7
0.1 10.89
8 2498730 201007 35092 8 273483 7
307628 4
307812 6
0.06 11.09
http://liveonsat.com/quickindex. html
1 156959 43636 9040 311 209946 292541 291651 0.3 28
2 159937 44511 10184 52 214684 300399 300911 0.17 28
3 200682 41142 456 242280 285246 285260 0.00 4
15
4 238586 36020 15857 290463 389911 389994 0.02 25
5 226457 14476 4 240937 255429 255803 0.14
6
5.67
6 195263 3902 618 199783 206157 205869 0.1 3.09
7 206839 58457 15670 280966 402103 402094 0.00 2
30
8 227746 22495 250241 272751 272744 0.00
2
8.25
http://www.therichest.org 1 707582 707582 707582 707717 0.02 0
2 753192 228 753420 753648 753736 0.01 0.03
3 731149 731149 731149 731288 0.01 0
4 638267 638267 638267 638392 0.02 0
5 683852 193 29 684074 684383 684475 0.01
3
0.04
6 795813 6533 1109 803455 814424 814748 0.03 1.34
7 676613 14 676627 676641 676633 0 0
8 714170 162 714332 714494 714488 0 0.02
http://autos.yahoo.com/news/10-cars-you-
have-to-wait-for-003730976.html
Logging on “desirulez.net” also spiked to 10% during some time frames. Thus the system is able to control the high traffic load on the web analysis server dynamically and the error in the visitor count is very low.
5.
C
ONCLUSIONThe work described in this paper is intended to control the number of request coming to the web analysis server in cases when there is sudden increase in the traffic on the web page. Dynamic requests control system for controlling the traffic to web analysis server is presented. Based on above results it can be concluded that dynamic system reduces the traffic to the web analysis server when the load on the web page increases substantially over a given period of time.
The above system can be used by anyone who wishes to control the sudden increase in the request coming to their server and lasting for short period of time. The time period can be changed by the implementer of this algorithm. It can be as large as 1 day or as short as 1 min. The algorithm can be modified in various ways as per the need like some people may find the values calculated in TABLE I to be impossible to reach in 10 minutes for some sites which generate less traffic but may still want to use this system. Well they can try to decrease the limits on percentage like the way it’s done in the testing above and were still able to get the intended result with a little compromise on the visitor count error. The random function used in the algorithm can also be changed and new limits on the percentage can be deduced too. Similarly anyone can modify the time frame value according to his need. If he wants his system to be more dynamic then he can reduce the time frame. If the need is to change the logging percentage only after let say 100 000 hits in certain time frame then that can also be done by simply changing the getNewLoggingPercentage and getNextHigherLimit functions accordingly and can only use the 5% and 2% logging. Thus, the
system is modifiable and versatile and can be used according to
the need.
It should be kept in mind that system is only helpful in cases when information of each and every event and the exact count of event happening on a web page is not important i.e. some error in event’s count is acceptable.
6.
A
CKNOWLEDGMENTThe support from Media.net, [8] A global contextual advertising company, is highly appreciated. As they provided the opportunity to implement the above proposed dynamic request control system in their architecture and supported in testing the architecture real time and on real web pages.
7.
R
EFERENCES[1] Onlinen Advertising:
http://en.wikipedia.org/wiki/Online_advertising
[2] Howard, Theresa (2005-06-23). "USAToday: Viral advertising spreads through marketing plans". USA Today. Retrieved 2010-05-27. June 23, 2005, 2005
[3] V. Cardellini, M. Colajanni, "Dynamic Load Balancing on Web-server Systems", Journal IEEE Internet Computing, 1999
[4] Rahul Roy (July 28, 2008). "Shard - A Database Design": Available on “http://technoroy.blogspot.in/”
[5] Web Analytics :
http://en.wikipedia.org/wiki/Web_analytics
[6] Redis: Available on “http://redis.io/”
[7] "What is CDN?". cdn-advisor.com. CDN-Advisor.com. 10 April 2013.Available on:” http://www.cdn-advisor.com/what-is-cdn/”
[8] Media.net Pvt Ltd : Available on “http://www.media.net/aboutus”
http://autos.yahoo.com/news/ 10-cars-you-
have-to-wait-for-003730976.html?page=2
1 766 9393 17560 36089 419 64227 476622 474376 0.47 86.5
http://autos.yahoo.com/news/10-cars-you-
have-to-wait-for-003730976.html?page=3
1 790 9845 18143 34451 395 63624 463605 461852 0.38 86.3
http://autos.yahoo.com/news/10-cars-you-
have-to-wait-for-003730976.html?page=4
1 740 10095 17832 32338 142 61147 436310 438871 0.58 86.1
http://autos.yahoo.com/news/10-cars-you-
have-to-wait-for-003730976.html?page=5
1 806 10353 18133 31553 156 61001 430827 431238 0.1 85.9
http://autos.yahoo.com/news/10-cars-you-
have-to-wait-for-003730976.html?page=6
1 793 11760 19255 29708 176 61692 421188 419131 0.49 85.3
http://autos.yahoo.com/news/10-cars-you-
have-to-wait-for-003730976.html?page=7
1 953 11001 10246 5