Munich Personal RePEc Archive
From Export Promotion To Import
Substitution; Comparative Experience of
China and Mexico
Shafaeddin, Mehdi and Pizarro, Juan
Institute of Economic Research, Neuchatel University, UNCTAD
June 2007
Revised (October 2007)
From Export Promotion
To Import Substitution; Comparative Experience of China and Mexico
Mehdi Shafaeddin and Juan Pizarro*
Revised version of the paper initially presented to:
International conference on Policy Perspectives on Growth, Economic Structures and Poverty Reduction ,Beijing, China, 3-9 June, 2007
organized by:
International Development Economics Associates (IDEAs), the Institute of Economics, School of Humanities and Social Sciences,
Tsinghua University, Beijing and
the School of Economics, Renmin University, Beijing supported by:
Christian Aid, UK, UNDP, India and Action Aid, China
---
Abstract
Both Mexico and China have started export orientation in some industries, through assembly operations, based on imported inputs a couple of decades ago. The literature on industrialization, has discussed the questions of import substitutions and outward-orientation mainly as alternative routes to industrialization. In both cases, it is argued that “learning” would contribute to industrial development. Proponent of import substitution argued that import substitution contributes to industrial development through “learning by doing”. Those in favour of free trade and outward orientation argue that trade contributes to the transfer of knowledge and technology.
This study is the first part of a twin study in which the authors attempt to shed some light on the comparative experience of the two countries in the light of the above-mentioned literature. The present study is devoted to the establishment of facts, while in the second study an attempt will be made to provide an explanation for differences in the performance of the two countries and the role played by their government in order to see whether the process, if successful, is replicable elsewhere.
China and Mexico the process of trade liberalization and development of export oriented industries started, following a period of pursuing import substitution strategy , more or less, at the same time-if not earlier in the case of Mexico. It will be shown in this study that both countries have managed to develop comparative advantage in many industries initiated through import substitution; but China has been more successful than Mexico in gradually increasing value added in export oriented industries by substituting domestic production for imported inputs in these industries.
The first section is devoted to a brief survey of the literature. In the second section, we will shed some light on the general trends in development of export promotion industries and general performance of the manufacturing sector in exports and production. The third section is devoted to the analysis of processing trade and value added in assembly operations through production of domestic components. In section four we will investigate the evolution of revealed comparative advantage in exports, production and assembly operation of traded finished goods and parts and components in order to shed some light on their future export prospects. The final section will conclude the study.
Introduction
This study is the first part of a twin study which examines the comparative experience of
China and Mexico in processing industries (assembly operations) mainly with the help of
foreign direct investment (FDI). In this paper is devoted to the analysis of data to
establish facts on the performance of the two countries in expansion of exports and value
added through production of domestic parts and components. The second study will be
allocated to the examination of the reasons behind the relative success of China in order
to see whether it is replicable elsewhere.
After a period of pursuing import substitution, both China and Mexico embarked
on establishing some export oriented industries through assembly operations based on
imported inputs. The experience of China indicates that in certain industries, particularly
data processing and other electronic industries, the country has gradually increased value
added by substituting domestic production for imported inputs. While the process of
export orientation in China and Mexico started more, or less, at the same time-if not
earlier in the later case, Mexico has not been as successful as China in this respect.
The study will be undertaken taking into account the debate in the literature on
trade and industrial policies. The literature has discussed the questions of import
substitutions and export promotion or outward-orientation1 mainly as alternative routes to
industrialization. In both cases, it is argued that “learning” would contribute to industrial
development. Proponents of import substitution argue that import substitution contributes
outward orientation argue that trade contributes to the transfer of knowledge and
technology.
The first section is devoted to a brief survey of the literature. The second section
will briefly explain the process of liberalization of trade and FDI and review the
comparative performance of exports of manufactured goods, MVA, GDP and a number
of other macroeconomics variables. The third section is devoted to the analysis of
processing trade and development in value added in assembly operations through
production of domestic components. In the fourth section we will study the evolution of
revealed comparative advantage (CA)2 of the two countries in exports, assembly
operation and production. of traded finished goods and parts and components in order to
shed some light on their prospects in the future. The final section will conclude the study.
I. The literature on industrialization and “learning”
The literature on trade and industrial policies has regarded import substitutions and
export promotion/outward-orientation mainly as alternative industrial strategies. Both
strategies emphasize the role of learning in industrial development. The proponents of
import substitution strategy argue that it contributes to industrialization through
“learning-by-doing. By contrast, those in favour of export promotion believe in
contribution of “learning through trading”. The basic difference between the two is that
the first group favour government intervention, while the second one argues in favour of
free trade and market-oriented development.
Raul Prebisch (1950) introduced the theory of import substitution strategy in late
exporters because of his belief, based on the results of his studies, that the distribution of
the gains in trade in primary commodities was unfavourable to exporting developing
countries. Accordingly, the terms of trade of these products suffered from secular
declines against manufactured goods imported from developed countries. Moreover, the
improvement in productivity in primary products, he argued, would benefit the importing
countries, rather than the exporting developing countries. Further, he thought
Government intervention was required for industrialization to support infant industries
which face competition with industries which had been already established in developed
countries. He believed the market forces alone would not allow a developing country to
catch-up with developed countries. Prebisch initially did not regard import substation a
step towards export expansion. Nevertheless, in his report to UNCTAD I, he applied the
concept of infant industry also to export activities by recommending selective
subsidization of exports. Finally, in mid-1980s he emphasized two features of his theory
which are closely relevant to our argument. One is the importance of indigenous
technology, which implicitly refers to the crucial significance of “learning by doing”
although he did not elaborate on it. The other one is his reference to the need for a
mixture of export promotion and import substitution to increase the domestic value added
in export activities3.
The process Prebisch had in mind in the evolution of an industry was import
substitution, stimulation of exports and further increase in domestic value added through
substitution of imported inputs, intermediate products and subsequently capital goods.
Some scholars in fact regard import-substitution a pre-requisite for export promotion in
external economies of learning (Young, 1991). Some others, argue for the lack of
demarcations between import-substitution and export promotion; while in any industry
import substitution precedes export promotion, a mixture of import-substitution and
export promotion may be followed in various industries in each point in time (e.g.
Streeten, 1972 and 1982., Singer and Alizadeh 1988, Chang, 1993, Shafaeddin 2005.a).
This is in fact, the process through which the Republic of Korea and Taiwan went
through in their industrialization. In other words, Although Prebisch referred to the
increase in domestic value added of exports, what he did not consider was the reveres
situation in which a country could start with a process of export promotion in some
industries before increasing value added in that industry.
The neo-liberals are advocators of free trade, export promotion, or
outward-looking, strategy as an alternative to import-substitution, or inward-looking strategy4.
They range from scholars (e.g. Krueger,1974, 1978 and 1998, Greenaway et al.1998,
Balassa, 1980, Bhagwati, 1978); main international financial institutions (e.g.World Bank
1987 and 1993, Papageorgiou et al. 1990) and the so-called Washington Consensus (e.g.
Williamson, 1990). The trust of their argument is that trade provide a channel for the
transfer of knowledge and technology, or learning through trade. The theoretical
foundation behind the neo-liberal argument is basically the static comparative advantage
theory although some lip service is provided to the dynamic theory. Accordingly, a
country concentrates on exporting what it already produces, not on the development of
what it will be able, or wish, to produce and export through developing dynamic
comparative advantage (see e.g. Cline, 1983, Amsden,1989 and 2001, Gomery and
An important criticism of both import substitution and export promotion is that
they did not contribute much to learning:
The principal reason for the failure of import substitution was that, as practiced, it created an environment that discouraged learning5. The outward-oriented strategy, on the other hand, fails to appreciate that learning requires conditions that are essentially internal and depend on the basic characteristics of the society. This failure means that outward orientation as such needs substantial qualification and redirection(Bruton, 1998:903-4).
A reason for the lack of sufficient learning in import-substitution, according to
Bruton, was that it was assumed that “once the structure of the economy changed,
learning would occur automatically and resolve the difficulties” (Ibid: 914). But the
learning process did not emerge as it does not occur automatically. Efficient government
policies were required. Similarly, in the case of export promotion strategy:
Studies of knowledge accumulation-especially the ideas of tacit knowledge, on the job learning, learning by doing and by using-combined with studies of technological change- in individual firms and industries offer strong evidence that simply exporting is not sufficient to result in or to substitute for the creation of a strong indigenous learning process (Bruton, 1998:930)6.
Once again, under export promotion strategies also the transfer of technology and
knowledge does not take place automatically. Not only, initial conditions, history,
culture, institutions, but also efficient policies as well as their effective implementations
are, inter alia, essential for the materialization of learning (Ibid:926 and 931). In both
cases, not only the firms, but also the government has to learn; “searching and learning”
by both firms and governments are fundamental. The government has to learn to design,
implement and correct policies over time.
In nutshell, learning and knowledge accumulation are important for
industrialization and development and government policies should address these issues
learning and the actual policies and measures taken by the two governments is the subject
of a separate paper as mentioned earlier. In this paper, we will study how things have evolved. In other words, to what extent assembly operation in processing industries has
been upgraded towards production by increasing domestic value added? Which country
has learned to upgrade its industrial structure? Meanwhile, we will also examine
development, in more recent years, in comparative advantage of the two countries in
capital/technology products which had been initiated through import substitution and
became subject to trade liberalization. Let us first say a few words about the general
export and growth performance of the two countries during the period they have
undertaken export promotion through processing industries.
II. Historical background and comparative performance
There are some similarities between Mexico and China in terms of timing of opening up
their economies to international trade; however, there are a lot of differences in their
export and growth performance. So are the results of their attempts in economic
liberalization and attraction of FDI. Both countries started opening-up their economies in
foreign trade and FDI, more or less the same time. In its economic and trade
liberalization, in fact, Mexico has far exceeded China, to the extent that it has been
regarded the main champion of trade liberalization and economic reform in general (ECLAC,
2002). The country started trade liberalization in 1984. In 1986 it joined GATT and began
deregulation of FDI which was further intensified in 1989, 1993 and 1999 when FDI in services
was also fully liberalized. In 1988, the range of import duties was reduced considerably. The
NAFTA Agreement came into effect at beginning of 1994; in 2001 NAFTA tariff rates were
also signed free trade agreements with 5 Latin American countries followed by similar
agreements with EU in 2000 and Japan in 2004.
China’s opening to foreign trade and FDI started in early 1980s, when it also
launched four special economic zones for export processing with the involvement of FDI,
after some internal reform of the domestic economy which began in 1979. Reforms of
China’s State Enterprises started more or less the same time i.e. in 1983 and have
intensified since1994. Further reforms in trade, financial, capital and labour markets
continued in 1980s and 1990s (see Kojima1990, Hiddo 1999, JP Morgan1999 and Seckington
2002).
We will illustrate the case of Mexico in more details than China, as the performance of
the former has been less strait forward than the latter requiring more attention. Mexico received
significantly greater FDI than China until around 1990 not only in relation to its GDP but also in
absolute terms (tables 1 and A.1). In both countries export processing zones were mainly
responsible for export expansion. During 1980s and 1990s, Mexico showed considerably faster
expansion of exports of manufactured goods than China (table 1). Mexico started with export
processing zones much earlier than China. The share of Maquiladoras in exports of manufactured
goods of Mexico was already 45 per cent in 1980, and it increased to over 55 percent in 2000 and
55.6 per cent in 2006 (table A.2)7. In the case of China, the share of “processed exports” in total
exports reached over 58 % in 2005(table 3).
Insert table 1 and chart 1 here
In terms of economic performance, however, there are significant differences
between the two countries. Let us start with Mexico. First of all, in this country the
growth of exports has not been associated with acceleration of growth of GDP. In fact,
the relation between the two variables nearly collapses in 1980 (chart 1). During
rate of GDP sharply decelerated from 6.3 per cent for 1960-1980 to 1.1per cent in 1980s
and slightly over 3 per cent in 1990s despite over 8 times increase in FDI between 1980
and 2000 (see table A.1). Secondly, over 1980-2000, the lack of nexus between the
growth of manufactured exports and MVA is also clearly evident (see table 1). Thirdly,
during 2000003 both manufactured exports and MVA showed negative growth rates of
-2.9 and -48, respectively, before picking-up slightly since 2004 when the world
economic situation improved. Even then the MVA/GDP ratio, in current terms, continued
falling reaching 17.8.percent for 2005, before picking up slightly in 2006, as compared with over
22 per cent in 1980.9Further, the prospect for high growth rate is in doubt as growth of
investment was on average negative during 2000-2003 (-2.9) and the I/GDP ratio is not
particularly high for 2004/5(table.1)10. Further, the nexus between export and GDP seems also to
continue in the future (chart 1).
Fourthly, FDI seems to have crowded out national investment in the case of Mexico;
despite significant increase in the FDI/GDP ratio, the investment/GDP ratio declined considerably
between 1980 and 2004, particularly since 2000 (table A.1). In other words, the response of
investors to economic reform and opening of the economy to FDI has been poor. The fall in
investment/GDP ratio is partly due to the decline in public investment. The ratio of gross public
fixed capital formation to GDP declined from 10.7 in 1980/81 to 4.55 in 2003/411. Public
investment declined even in absolute current terms from over $11.6 billions in 1981 to about $2.8
billions in in 1998 and in 2006 it stood at $4.2 billions12.But, it must have also been caused by
crowing out of national private investment. The ratio of gross private fixed capital formation to
GDP was 14.7 in 2003/4 as against14.25 in 1980/8113. Considering the inclusion of FDI in this
ratio, the national investment/GDP ratio must have fallen. In fact the gross private fixed capital
formation in 2005/6 was15.2 billion dollars, as against15.1billions in 198014. Thus contrary to
liberalization Moreover, there is some evidence that there was also a shift from investment in
productive activities to less risky investment such as residential construction (Shafaeddin, 2005.b:
table3.3). The movements in the exchange rate, particularly currency shocks, were not conducive
to investment in productive activities in non-maquila sector either (Shafaeddin, 2006:50-52).
In many respects, China’s performance has been far better than Mexico. Although during
1980-2000, China showed lower growth rates of exports of manufactured goods than Mexico,
unlike Mexico; its growth rate of exports of manufactured goods was accompanied with
significant growth rates of MVA and GDP (table 1). As a result, according to the same table, it
gained considerable increase in its shares of world exports and MVA (table 1). And China, in
contrast to Mexico, has continued rapid expansion of exports, MVA and MVA/GDP ratio since
2000, after it joined WTO, despite the world economic recession of early years of the decade.
Furthermore, FDI did not cowed out domestic investment; in fact, the I/GDP ratio increased
almost continuously far beyond the increase in FDI/GDP ratio. Table 1 also shows that in the case
of China, the trade balance ratio of the manufacture sector, (exports-imports)/exports, has
improved significantly and continuously (table A.1). By contrast, while Mexico has shown some
improvement in the corresponding ratio, it still remains negative to a significant magnitude. This
is in fact, due to slow progress in increasing its domestic value added in processing industries.
III. Processing trade and the evolution of value added in assembly operations
Mexico has not achieved much in increasing domestic value added in its assembly
operations. Table 2 provides the data on the evolution of the maquila export industry of Mexico
for 1974-2006. Accordingly, first of all, there has been extremely rapid expansion of the sector in
terms of the number of firms, number of employees and output particularly since the trade
liberalization of 1980s. Secondly, there was a significant drop in the share of value added,
may not matter much if the share of domestic input in production increases, i.e. the backward
linkages of the sector with other domestic industries enhances. Nevertheless, according to the
same table, the contribution of local inputs in exports has increased little. Thirdly, by contrast, the
share of imported inputs in output of the sector has increased continuously to nearly 77 percent in
2004. And the picture does not seem to have changed much since then.
Insert table 2 here
The decline in the value added, in relation to exports, of the maquila sector has been far
beyond what had been expected by the authorities and has not been confined to the maquila
sector. Nevertheless, the situation was somewhat better in the non-maquila sector. The forecast of
the authorities was that the export/value added ratio would increase from 10 in 1980 to 18 in 1995
for the manufacturing sector as a whole. The actual figures for the maquila sector were 635 in
1995 and 864 in 2000, respectively. For the non-maquila manufacturing sector, the ratio went up
to 150 in 1995 before falling to over 100 in 2000. For the car industry, which is an old industry
and operates in both sectors, the corresponding ratio increased from 8 in 1980 to 378 in 2000
(Palma, 2003:28-9).
The performance of non-maquila sector, which is mainly based on industries which had
gone through import substitution, is a lot better than the maquila sector in terms of linkages with
the domestic economy. Comparable data on value added of the non-maquila sector is not
available. Nevertheless, some inferences can be made with the help of the alternative data shown
in charts 2 and 3. These charts show for each sector the evolution , over 1980-2006, of the share
of exports of manufactured goods to non-oil export, the ratio of export to intermediate imports
and the ratio of trade balance to exports. Accordingly, for the maquila sector the share of the
maquila exports (of (manufactured goods) in total non-oil exports has increased significantly over
time. However, the ratios of exports to intermediate imports and the trade balance ratio [(exports
minus imports of intermediate goods)/exports] of the sector show downward trends, despite some
operation has increased over time. Trade liberalization seems to have been an important
contributory factor to such increase; the reduction in the trade balance ratios is visible with each
trade liberalization episode (1984, 1986, 1994 and 2001-2006) as is clear in the same chart 2.
Insert charts 2 and 3 here
By contrast, for the non-maquila sector, the ratios of export/intermediate imports and the
trade balance ratio are considerably higher at the end of the period than the initial period despite
their declines since 1994 when the NAFTA Agreement came into effect. It is not clear whether or
not the data on imports of intermediate goods for the non-maquila sector includes imports for the
other sectors of the economy (including agriculture, construction, etc.). Nevertheless, if it does,
our conclusion on the better performance of the non-maquila manufacturing industries will be
strengthened.
The immediate and longer-run impact of trade liberalization on non-maquila sector is also
interesting. According to chart 3, the immediate impact of trade liberalization of 1986 (accession
to WTO) and 1994 (coming into effect of NAFTA), was a sharp increase in exports/intermediate
imports ratio and in the trade balance ratio. In both cases however, the ratios fell after the
liberalization. The reason for the immediate increase in the ratios is that industries which had
developed supply capacities through import substitution could benefit from access to markets in
other countries facilitated by the trade agreements. Nevertheless, subsequently, the trade balance
ratio deteriorated due to the increase in import intensity of output and increase in imports of final
products as a result of import competition. In fact, since 1994, the reliance on imports of
components has also increased even for the non-maquila sector.
Unfortunately, comparative data on value added for China is not available to make
similar analysis for the performance of the export processing industry of the country Available
data on exports and imports for processing trade of the country for 1981-2005 period is shown in
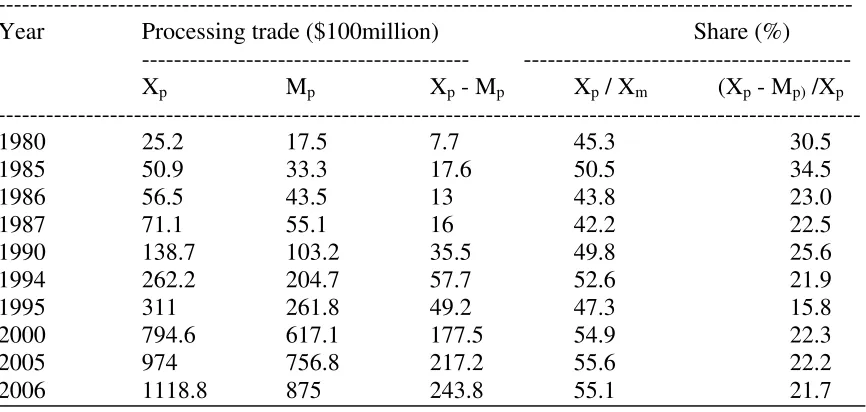
table 3. For the sake of comparison, we have also shown similar data for Mexico for selected year
two countries are closed to each other in recent years. Nevertheless, in the case of Mexico,
processing exports constituted an important share of total exports of the country already in 1980.
In the case of China, it begins to pick up in late 1980s, but expanded very fast. The importance
difference between the two countries is that in the case of China the trade balance of the sector
(processing trade) was significantly negative until late 1980s, but it improved very fast until 1998,
after a temporary decline in early 1990s, and remained more or less the same since then with
some fluctuation. By contrast, in the case of Mexico the ratio was already high in 1980 and
increased for a while, i.e until the accession of the country to WTO, but since then the trend has
been downward. There was also a drastic decline in the ratio in 1995 with the entry into force of
the NAFTA agreement.
In the latest year, the trade balance ratio of processing trade of China far exceeds that of
Mexico. What are the prospects for the future? To shed some light on this question, we should
investigate the trade in parts and components and the evolution of CA of these countries in
exports as well as production of components and finished products.
IV: Trade in components and evolution of the pattern of competitive advantage15
What are the prospects for increase in value added of exports, in the assembly
operations of China and Mexico? In the absence of readily available data on production,
to shed light on this question, we will first briefly review the evolution of trade in parts and components of these countries. The data on trade, per se, however does not provide
the whole picture, as will be explained shortly. Therefore, subsequently, we will study the
evolution of the pattern of CA in exports and production of the two countries.
Trade in components
The data on trade in components for the two countries for the period 1992-2005
exports of components is evident. China expanded exports of components much faster
than Mexico throughout the period, particularly in more recent period after its accession
to WTO i.e. during 2001/2-04/05 and the resulting trade liberalization. During this
period, in the case of China while the rate of growth of exports accelerated sharply, that
of imports decelerated. As a result the trade balance of parts and components of the
country reduced after their increases over 1992-2002. By contrast, in the case of Mexico
the trade balance has increased continuously. The superior capabilities in production of
components can be also gauged by the comparative changes in figures of ratios of exports
and imports of parts & components to total exports and imports of manufactured goods of
the two countries as shown in the same table. In the particular case of Mexico while the
share of parts and components in total exports in 2004/4 is hardly different from 1992/3,
the corresponding ratio for imports has continuously increased.
Of course, the slower expansion of exports of components in the case of Mexico,
i.e. the relative success of China in this respect may not necessarily be an indicator of
China’s relative success in the production of components. It is possible that Mexico’s
components were used more in the production of finished goods for exports or for sale in
the domestic market. For the same reason, however, it is possible that China’s capability
in production of parts and components is underestimated. Exports of finished products
could be the results of assembly operations based on imported inputs. It could also be the
result of expansion of production of domestically produced components. In the absence
of figures on production of components, we may examine the tendency in the
comparative evolution of the pattern of CA in exports and production of components and
Indicators of RCA
To do so, we may use various indicators of Revealed Comparative Advantages
(RCA) applied to the exports and imports of the related finished products and
components at 3 digit level for which data are readily available. For this purpose we will
apply the methodology used by Shafaeddin (2004) and Ng and Yeats (1999)16. When
applied to exports the RCA formula would be:
Rx= [Xij/Xj]: [Xwi/Xw];
Where R, i, j, w, x stand for RCA, product, country, world and exports, respectively. R is the ratio
of the market share of a country (e.g. here Mexico or China) in an item, to market share of the
country in total world exports.
• If R is greater than unity, it implies that the country has CA in exportation of the product.
• CR,,change in R over a period (shown as the ratio of R for a period divided by R for a
previous period), indicates whether the country is gaining CA in exports (when CR is
greater than unity) or losing CA (when CR is less than unity).
Nevertheless, CA in export of a finished product does not necessarily imply
advantage in production of that product as the finished product may be the result of
simple assembly operation. The application of R to imports can distinguish CA in
assembly operation and production although it does not measure the extent of the value
added involved. When the RCA indicator is applied to imports the formula will be:
Rm = [M ij / Mj ] ÷ [ M wj / Mw ];
where R,i, j, w and M stand for, RCA, product, country, world and imports, respectively.
R is the market share of a country’s (here Mexico’s or China’s) imports of an item, to
• R greater (smaller) than unity for imports of a finished product implies that the
country has disadvantage (advantage) in production of that product;
• CR greater (smaller) than unity for finished products implies further loss (gain) in
advantage in production of a product.
• By contrast, R greater(smaller) than unity for imports of a component implies that the
country has CA in assembly operation (production of the component);
• CR greater(smaller) than unity means further gain in assembly operations (production of
component);
China’s revealed comparative advantage
The indicators of RCA for main export products of China at 3 digit levels for the 1992/3-2004/5
are shown in tables 6. We have also shown the figures for changes in RCA for 2000/01-2004/5 in
order to study the evolution in CA of the country after the trade liberalization due to its accession
to WTO. The table covers export items whose individual share in total exports of the country is
around one per cent or higher. According to the table, in 2004/5 China showed RCA in all
products included in the table, except for transistors and valves etc. (SITC 776), electric apparatus
such as switches (SITC 772) and non-electric accessories of machinery (SITC 749). Even for
these products, particularly transistors, the tendency has been to improve RCA as shown by the
indicators of change in RCA.
Insert tables 6 here
Main export items
The products shown in the table include 14 capital/technology intensive, mostly
electronic and electric products, 12 labour intensive and 2 natural resource-based products. In
fact, the first three items are electronic products which together account for over 23 percent of
country’s exports. Furthermore, changes in the performance of capital/technology intensive and
China has also gained CA in all of its capital/technology intensive products, mostly electronics
and electric products, which include mainly finished goods (10 items) and 4 components and
parts. The finished electronic products include, in order of importance of change in their RCA
over 1992/3-2004/5, data processing (SITC 752), heating, cooling equipment (SITC 741), sound
record, phonographs (SITC 763), Telecommunication equipments and parts (SITC 764), electric
Machinery nes (SITC 778), household equipment (SITC 775), electric power machinery (SITC
771) and television receivers (SITC 761). Transistors and valves (SITC 776) and Parts and
accessories for SITC 751 and 752 (SITC 759) switches etc (SITC 772) and parts and components
of non-electric machinery (SITC 749) are main items of components which have gained CA over
the same period. Base metal manufactures (SITC 699) is also an intermediate products with
gaining CA over 1992/3-2004/5 period.
The electric/electronic products which gained comparative advantage over 1992/3-2004/5
(11 items) together accounted for over 40 per cent of the country’s exports in 2004/5. In all these
products, except SITC 775 and 778, the country has continued to gain significant advantage in
exports during 2000/1-2004/5, after the accession, particularly for data processing equipment and
the parts and components for electric products.
By contrast, the indices of change in RCA are less than unity almost for all labour
intensive products (except for furniture, and women man-made fibber fabrics) for both
1992/3-2004/5 and 2000/1-1992/3-2004/5 period indicating that these categories of goods have been losing
ground in favour of capital/technology intensive products.
Electric and electronic products and other capital/technology intensive products, which
constitute the bulk of products in which the country is gaining CA in exports, are both among
demand dynamic (enjoy rapid growth of demand in international market) and supply dynamic
(provide linkages with other industries). Hence, China seems to have a favourable pattern of
exports. But has it also gained CA in production of finished capital/technology intensive products
RCA applied to imports
We will first study the RCA indicators for main import items of the country.Subsequently, the
evolution of RCA for imports of the main capital/technology export items in which China has
shown RCA for exports. Further, in order to investigate whether the country has achieved CA in
production of capital/technology items which do not figure among its main import items we will
examine RCA in “other import” items. We are interested only in evolution in CA of
capital/technology intensive items as they are products which contribute to the upgrading of
production structure. After all, the country has had CA in labour intensive products.
Insert table 7 here
The data on indicators of import RCA applied to main import items of China, which
together account for over two-third of imports of the country, are shown in table 7. Accordingly,
first of all, intermediate products, including parts and components, (19 items out of 27)
constituted the bulk of imports of the country17 in 2004/5. In fact, the first seven items, with the
exception of petroleum and optical instruments, consist of parts and components which together
constitute about a third of total imports of the country18 in the same year. Secondly, China has
CA in assembly operation in all items of components, parts and intermediate products shown in
the table with the exception of parts and accessories for automotive industries (SITC 784).
Thirdly, the country’s advantage in assembly operation has increased for most components shown
in the table. Nevertheless, it has reduced its advantage in assembly operations (improved its
advantage in production) continuously in 3 components and intermediate products
(polymerization, etc, iron and steel plate and sheets, petroleum products) during 1992/3-2004/5.
Nevertheless, after the accession to WTO, it has improved CA in production of 3 components and
6 other intermediate products. Among finished products, the country has CA in production in
both data processing (SITC 752), and aircrafts (SITC 792) which includes also components).
Further, over 1992/3-2004/5, it has continuously improved its advantage in production of SITC
advance in technology thus the need for imports. Some of these items also figure among the main
export items of the country.
Overall, China has been more successful in improving CA in production of main import
items of intermediate goods, including components, than main finished products. How about main
exported items?
Insert table 8 here
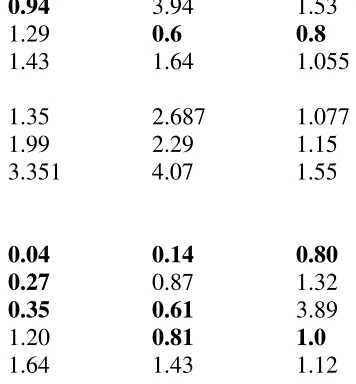
Table 8 shows the evolution of RCA indicators applied to imports of Capital/technology
intensive items in which China had CA in exports 2004/5. Accordingly, the results are mixed.
The country had CAin production of 4, out of 8 items of finished goods, in three of which it lost
some advantage after the accession to WTO. On the other hand, it improved its advantage in two
items (SITC 764 and 741) over time.
In the case of SITC 764, which includes both finished products and components,
unfortunately, we can not calculate the RCA at 4 digit levels, due to the lack of necessary data at
the world level, to separate the effects of finished products and components. Nevertheless, some
inferences can be made with the help of available data provided in table A.3. Accordingly, it
seems that the gain in CA is basically due to production rather than assembly operation. While
growth of exports of both finished products and components accelerated noticeably during
2000/01-2004/5, growth of imports of finished products decelerated significantly. At the same
time although the growth of imports of components also accelerated, the trade balance of
components turned positive. Therefore, the growth of exports of finished products must have been
based mainly on production of domestic components.
Regarding other parts and components, table 8 indicates that the same items in which the
country has gained CA in exports are also those in which the country has advantage in assembly
operation. This phenomenon is not however a paradox. The items shown are at 3 digit levels. It is
possible that at more disaggregate levels (4 or 5 digits) some products which are imported for use
that they are components of different marks of the same products. What is clear, however, is that
while the country is still engaged heavily in assembly operation, jugged by the indicators of RCA
for finished products and components shown in tables 8 and 6, it has developed, or improved, CA
in production and exports of some components noticeably..
So far we have studied main import and export items. How about those import items
which do not appear as main imported items perhaps because the country has developed CA in
their production?
To shed some light on this question, we have shown the indicators of RCA for other
capital/technology items in table 9. Development in CA in these products is of our interest
because they contribute to the upgrading of production structure. The table indicates that indeed,
the performance of the country is highly impressive. In 2004/05, out of 21 finished items and 6
components, China shows CA in 15 finished products and 3 components. Furthermore, for the
majority of the products included in the table (including some of those in which it does not still
have CA in production) it has improved its CA in production even after the accession to WTO.
Insert table 9 here
In short, China has CA mostly in production of non-electronics capital/technology
intensive products and in exports of assembled electronics products. Nevertheless, it has also
reduced its disadvantage (improved its advantage) in production of components and finished
items of electronics products, and some other intermediate goods particularly in more recent
years. The non-electric products are basically produced by SOEs, not foreign firms, and are based
on industries which were initiated through import substitutions, but must have reacted positively
to gradual trade liberalization.
Mexico
Corresponding data on the indicators of trade and RCA for main exports and import items of
Mexico at 3 digit product levels for the 1992/3-2004/5 are shown in tables 10 and 11.
than in the case of China. 16, 0ut of 26 items included in the table, are capital/technology
intensive products which constitute nearly half of total exports of Mexico in 2004/5. 6
Resource-based products, mainly petroleum, constitute about 19 per cent of exports of the country which
takes a higher proportion of total exports than the case of China. Only 4 low technology/labour
intensive products appear in the list of main exports. Automotive products and electronics and
electric products are among the first 10 items of non-oil exports which account for 19 % and 28
% of non-oil exports of the country in 2004/5, respectively.
Insert tables 10 and 11 here
In 2004/5, with the exception of for two components items (SITC 759 and 776) and
refined petroleum, Mexico shows CA in exports of all products shown in the table, including four
items of parts and components (SITC784, 772, 713 and 749).However, in contrast to China, the
country has lost advantage in a number of finished capital/technology intensive items (11 out of
16) either over 1992/3-2004/5 period (7 cases), or during 2001/1-2004/5 (4 cases) or in both
periods (4 cases). Moreover, unlike China, it has gained advantage in resource-based goods,
except SITC 699) and labour intensive products (SITC821, 842) continuously during
19992/3-2004/5. Among parts and components, only SITC 784 (motor vehicle parts) has shown
continuous gain in advantage over time. Some improvements are also noticed in the case of
internal combustion piston engine (SITC 713 ) ,another automotive component during
2001/2-2004/5. Otherwise, all other items of components have lost CA either continuously over both
periods (SITC 772,776) or in the latest period (SITC 759, 749).
In similarity with China, intermediate and parts and components constitute the bulk, 16
out of 26 items, of main imports of Mexico (table 11). Nevertheless, in 2004/5, Mexico had CA in
production only in refined petroleum products and paper and paper board. Even in this case, the
CA of the country in production has deteriorated over time. With respect to finished products,
Mexico shows CA in production in two products passenger motor cars (SITC781) and medical
advantage continuously in the first product over 1992/3-2004/5, and in the second one over
200/01-2004/5. Furthermore, it has gained further CA in assembly operation in all other finished
products included in the table except for three items in which its CA disadvantage in production
has reduced during 1992/3-2004/5. These include base metal manufactures nes (SITC 699)
electric machinery, etc. (SITC 778), equipment for distributing electricity (SITC 773) some of
which also figure in main export items of the country.
The RCA indicators applied to imports of capital/technology intensive products which
have shown CA in exports in 2004/5 are shown in table 12. Accordingly, passenger cars (SITC
781), TV receivers (SITC 761) and household equipments (SITC 775) are the only three items in
which the country shows CA in production in 2004/05. In the later two cases, CA has also
improved continuously over time, but the related RCA indicators of change are not as strong as
those of China. In addition to two electronic products (SITC 778 and 773), in more recent period
some improvement has taken place in non-electric components such as car components, (SITC
784 and 713), switch gear (SITC 772) and in electric power machinery.
Insert table 12 here
Regarding other import products, we have shown the necessary data in table 13. To be
able to make the comparison with China easier, we have reported the products in the same order
as the corresponding table for China (see table 9). It appears that there are minor differences
between the two countries as far as CA in production of “other import” items is concerned.
Overall, in 2004/5, Mexico has achieved CA in production of 15, out of 24 (62%) products shown
in the table, which is slightly less than the corresponding figure for China i.e. 19 out of 27 (70%)
(based on table 9). The Chinese superiority in this respect is basically due to better performance
of China in finished goods. Moreover, in more recent years (2000/01-2004/5), China has
performed better in terms of improvement in CA in production in 70 per cent of the number of
products as against 63 per cent for Mexico.
In both the cases, most of the products which show RCA indicators greater than unity, i.e.
bear CA in production, are among those which had started during the import substitution era and
survived trade liberalization well as they were near the state of maturity (for the case of Mexico
see Shafaeddin, 2005.a:69-73)19.
The evolution of CA in thee main export item of Mexico
We will examine in more details the performance of three main manufacturing export
items of Mexico which operate in both maquila and non-maquila sectors together with their
components. These are automotive products, automatic data processing equipments and office
machines, and telecommunication equipments. The data for RCA indicators are readily available
for the first two items as shown in table 14. But for telecommunication equipments we have to
make some inferences due to the lack of the necessary data as mentioned earlier. We have
included SITC 751 and 722 in the table, even though they do not figure among main export item,
because they use parts and components which are also used for production of other items.
According to table 14,there are some similarities and some difference in the performance of the
two groups shown in the table. In both cases:
¾ The trade balance of the components declined (and became negative for 759) at the end
of the period implying that the growth rate of their imports was significantly greater than
the growth of their exports.
¾ Imports of components increased faster than exports of all items of finished products.
¾ Similarly, except for SITC 751, trade balance of finished goods was positive at the end
of the period and the reliance on imports of finished products has increased.
In other words, achievement in gaining CA in production has been limited.
Insert table 14 here
However, the difference between the two groups is that on the whole, trade balance of both
Moreover, in 2004/05, the automotive products show better indicators of both exports and
production. Nevertheless, even in this case the only item in which the country shows a very
strong and continuous gain in advantage both in production and exports is SITC (783) the value
of exports of which is not very large. For more important automotive items, it has been losing
advantage in production (SITC 782) and significantly in both exports and production for
passenger cars (SITC781). Regarding passenger cars which is the most important manufacturing
export item of the country one would have expected that the abolishment of the special
programme for cars in 2004 should not have resulted in such a drastic decline in advantage in
production as the industry has had long experience since its establishment. But it seems the
sudden, rather than gradual, removal of support may have caused such a drastic loss in advantage
in production and exports of finished automotive products. By contrast, production of
components has reacted more positively to liberalization of 2004 than the finished products.
Explanation of this phenomenon requires further investigation.
Mexico, has gained increasing advantage in exports of SITC 752 (automotive data
processing products), but, unlike China, it does not have CA in production and has not been able
to reduces its disadvantage in production of this group of products over time. The change in
advantage in favour of assembly operation is particularly evident by the data on R and CR, for
imports and exports of components (SITC 759). The only similarity with China is that in both
cases the advantage in production has declined perhaps for the reasons explained earlier in this
paper in the case of China. The country does not show CA in exports of office machines, despite
its increasing advantage in production. In other words, the country did not use its advantage in
production for expansion of exports the value of which declined over time.
Regarding telecommunication equipments, it appears that not only the growth rates of
exports of both finished products and components have decelerated sharply in recent years (see
table A.3), but also in contrast to the experience of China, the reliance of the assembly operation
growth of imports of parts and components as well as the fact that the trade balance of parts and
components have turned negative (Table A.3). The deceleration in imports of finished products
must have been due to reduced demand as a result of slow-down in general economic activities of
the country.
V. Conclusions
China and Mexico have developed some processing industries (assembly operations),
particularly in electronics industries, based on imported inputs, for exports in recent
decades. Meanwhile, both countries embarked on the process of trade liberalization after
a period of pursuing traditional strategy of import substitution industrialization. In both
cases the objective of the Government was to increase domestic value added in
export-oriented industries by substituting domestically produced parts and components for
imported inputs.
In this study, we have examined the comparative experience of these countries in
achieving this objective. At he same time, we have examined the evolution, after their
trade liberalization, of their industries which had been initiated through import
substitution. To gauge on development in their competitive advantage in exports and
production, we have applied, inter alia, the Revealed Comparative Advantage (RCA)
indices to both exports and imports of both countries a la Ng and Yeats (1999) and
Shafaeddin (2004)
One striking common features of China and Mexico is that both countries,
particularly China, have developed competitive advantage in production of most
capital/technology intensive industries which had been established during the import
substitution era. In both cases most of these industries have also reacted positively to
value added in export oriented industries. Mexico, like China, managed to expand its
exports of manufactured goods rapidly during 198os and 1990s; but unlike China, its
exports came to a halt in early 2000s before picking up slightly in recent years. By
contrast, China has managed to continue expanding its exports of manufactured goods
fast. More importantly, in the case of China, unlike Mexico, expansion of exports was
accompanied with rapid expansion of manufactured value added in general, including
value added in its processing industries. By contrast, the share of “retained value added”
in the output of maquila sector has dropped significantly and the contribution of domestic
inputs to production has increased little. Yet the reliance of the sector on imported inputs
has continuously increased. The linkage of the non-maquila sector with the domestic
economy of Mexico was significantly greater than that of the maquila sector at the end of
the study period (2005/6). Nevertheless, the reliance of non-maquilsa industries, on
imports has also increases since coming into effects of the NAFTA in 1995. By contrast,
the trade liberalization resulting from the accession to WTO has not influenced
manufacturing industries of China negatively. The trade balance ratio, (X-M)/X, of the
processing industries of Mexico, which had been relatively high, has declined
considerably after the accession of the country into WTO in 1987, particularly since
1995. By contrast, the corresponding ratio for China has improved rapidly until 1999 and
remained more or less the same despite some fluctuations.
A similar observation is noted in the trade balance of parts and components
(P&C) of the two countries. A better trade balance in P&C alone, however, would not
necessarily indicate a better production capacity; P&C could be used partly in production
of the two countries in exports and production, we have applied the indicators of revealed
comparative advantage (RCA) to main exports and import items of the two countries. To
examine their potential for upgrading, we have also applied these indices to imports of
other capital/technology intensive products. Both countries have shown RCA in finished
capital/technology products and a tendency towards increasing exports of these items.
Nevertheless, the evolution of their RCA was different. China has shown improvement in
RCA in its exports of capital/technology intensive items, mostly finished products (10 out
of 14), the bulk of which included electric/electronic products (11). These items
accounted for over 40 per cent of the country’s exports in 2004/5. When we applied the
RCA indicators to main import items of the country and imports of capital/technology
items in which the country showed CA in exports, it became clear that: the country has
shown CA in assembly operation in almost all main items of imports of intermediate
products and parts and components, except the components for automotive industries.
Nevertheless, it has improved RCA in 6 intermediate products and 3 components (out of
19) and 3 (out of 8) finished products particularly after the accession to WTO. Moreover,
it shows CA in production of 5 finished products (out of 8) for which it also have CA in
exports. While advantage in production of declined for some of electronic equipments, it
increased for some others. In short, while the country is still engaged in assembly
operations in its main items of exports and imports, it has improved its RCA in
production of finished goods and, in particular, components.
By contrast, Mexico’s performance in achieving CA is not as promising either in
production or in exports of its main export items. Unlike China it has lost CA in exports
but gained competitive advantage in resource based and labour intensive products. Motor
vehicle parts (SITC 784) is the only item of part and components with continuous
improvement in CA in exports. Further, as far as CA in production is concerned, TV
receivers and household equipments are the only two main export products, with
sustained CA in production. Some improvement is also seen in car components,
unspecified electric machinery (SITC 778), switch and electric distribution equipment
gear in more recent years. The situation is not however comparable with China. Mexico
has also shown declines in CA in production of three main import items, in which it had
CA (passenger cars and pharmaceuticals and paper and paper board) either continuously,
in the first two products, or in more recent years in the case of the last item.
We have also examined in more details the prospects for CA in production of
finished goods and components of three main export items of Mexico. These are
automotive, automatic data processing and office machines, and telecommunication
equipments. It became clear that in two products the country has CA in both exports and
production. One is road motor vehicle not specified (SITC 783) the value of exports of
which is small; the other one is finished telecommunication products (SITC (764-7549)
for which the CA in export has declined in recent years. Components of automotive
products are the only item which has reacted to trade liberalization positively. Otherwise,
its advantage in assembly operation has improved in all other items.
As mentioned earlier, an important similarity between the trade performance of
China and Mexico is that both have developed CA in production of many
capital/technology intensive which had been initiated through import substitution. Most
The results obtained raise a number of questions requiring further research?
What explains better performance of China in export oriented (processing) industries in
terms of increase in value added? Why these industries reacted better to trade
liberalization in China than in Mexico? To what extent could difference in trade and
industrial policies and Government treatment of TNCs in the two countries explain the
divergence in their performance? Has product sharing at regional level contributed to the
better performance of China? Some of these issues are subject of our research in the
Table 1: Comparative Economic Performance of China and Mexico (1965-2005)
China Mexico
Growth rates 65-80 80-90
90-2000
2000-2006 2005 2006 60-80 80-90
90-2000
2000-2006 2005 2006
Manufacturing value Added 10.5 10.8 12.7 10.8 12.11 7.9 6.3 1.5 4.3 0.8 1.4 4.7
Gross Domestic Product 6.6 10.3 10.6 9.8 10.2 10.7 6.3 1.1 3.1 2.3 2.8 4.8
Gross Fixed Capital Formation 9.7 9.5 14 13.8 14.8 15.9 7.7 -2.7 4.1 3.28 7.6 10
Total Exports 14.7 12.8 14.5 27.4 28.5 27.2 17.3 5.9 16.1 7.33 14 16.7
Exports of manufactures 17.4 16.7 28.4 29.1 27.7 18.1 24.3 19.8 5.7 11 9.9
memeo:
(Xman-Mman)/Xman. Initial period(%).a -40.8 4.7 22.7 29.6 35.4 -603 -128.2 -11.2 -12.7 -12
Ratios 70/71 80/81 90/91 04/05 05/06 70/71 80/81 90/91 04/05 05/06
MVA/GDP 34.4 39.5 32.8 32.9 32.1 23.1 22.1 20.7 17.9 17.9
GFCF/GDP 24.5 28.4 27.1 41.4 41 19.0 25.6 18.3 19.5 19.7
FDI/GDP 0.1 1.2 3.2 3.5 0.8 1.2 1.2 2.6 2.5
Exports of Manufactures / Total world
exports of Manufactures 0.8 1.9 8.3 9.9 0.24 0.18 0.8 2.2 2.1
MVA / Total World MVA 3.7 2.6 2.5 9.2 9.8 0.93 1.6 1.1 1.6 1.6
Sources: World Bank: World Development Indicators on-line, UNCTAD, World Investment Report, various issues
Table2: Indicators of Maquiladora Export Industry of Mexico (1974-2006)
--- 1974 1985 1998 2000 2001 2002 2003 2004 2005 2006 Ratios
1985/74 1998/85 2004/98 2006/98
---
No. of firms 455 729 3130 3590 3630 3003 2860 2810 2816 2810 1.6 4.3 0.9 0.9
No. of workers (1000) 76 218 1039 1291 1199 1071 1062 1115 1166 1202 2.9 4.8 1.1 1.2
Gross output ($billions) 0.01 1.3 445.1 669 659 692 794 938 1003 1139 120 341 2.1 2.6
Percentages in gross output:
Local input 0.9a 0.7 2.2 2.4 2.6 2.9 2.5 2.4 2.7 2.8 0.8 2.4 1.1 1.3
Value added: of which 36.3 24.9 21.7 22.1 24.2 23.4 22.6 20.7 20.9 20.4 0.69 0.6 1.0 0.9
Wages 22.4 12.8 10.6 12.4 13.5 12.8 11.5 10.7 10.9 10.5 0.57 0.47 1.0 1.0
Others 13.9 12.1 11.1 9.6 10.8 10.6 11.0 10.0 9.9 10.0 0.87 0.8 0.9 0.9
Imported inputs 64.3 75.1 78.3 75.6 73.1 73.7 75.0 76.9 76.4 76.7 1.17 1.22 1.0 1.0
Retained Value 37.2 25.6 23.9 24.5 26.8 26.3 25.1 23.1 23.6 23.2 0.69 0.93 1.0 1.0
---
Table 3: Evolution of processing trade of China (1981-2005)
---
Year Processing trade ($100million) Share (%)
--- --- ---
Xp Mp Xp - Mp Xp / Xm (Xp - Mp) /Xp
---
1981 11.3 15.0 -3.7 5(a) -32.1
1982 0.53 2.76 -2.23 n.a -420
1983 19.4 22.7 -3.3 n.a -17
1984 29.3 31.5 -2.2 n.a -7.5
1985 33.2 42.7 -9.5 8.3 -22.2
1986 56.2 67.0 -10.8 n.a -19.2
1987 89.9 101.9 -12 n.a -13.3
1988 140.6 151.1 -10.5 n.a -7.5
1989 197.9 171.6 26.3 8.8 13.2
1990 254.2 187.6 66.6 55 26.1
1991 324.3 250.3 74 58.2 29.1
1992 396.2 315.4 80.8 58.3 20.4
1993 442.5 363.7 78.8 58.9 17.8
1994 569.8 475.7 94.1 56.2 16.5
1995 737.0 583.7 153.3 57.9 20.8
1996 843.3 622.7 220.6 65.3 26.2
1997 996.0 702.0 294 62.7 34.8
1998 1044.5 686.0 358.5 65.7 34.3
1999 1108.8 735.8 273 63.3 33.6
2000 1376.5 925.6 450.9 61.5 32.8
2001 1474.3 940.0 534.3 61.5 36.2
2002 1799.3 1222.0 577.3 60.6 32.1
2003 2518.5 1629.0 8895 62.4 35.3
2004 3279.7 2216.9 1063 59.3 32.4
2005 4164.0 2740.1 1423.9 58.4 34.1
Source: Based on China Statistical Yearbook, 2006: tables 18-4 and 18-5
Notations: Xp= processing export; Mp= processing imports; Xm=exports of manufactured
goods
Table 4: Evolution of processing trade of Mexico (1980-2005)
---
Year Processing trade ($100million) Share (%)
--- --- ---
Xp Mp Xp - Mp Xp / Xm (Xp - Mp) /Xp
---
1980 25.2 17.5 7.7 45.3 30.5
1985 50.9 33.3 17.6 50.5 34.5
1986 56.5 43.5 13 43.8 23.0
1987 71.1 55.1 16 42.2 22.5
1990 138.7 103.2 35.5 49.8 25.6
1994 262.2 204.7 57.7 52.6 21.9
1995 311 261.8 49.2 47.3 15.8
2000 794.6 617.1 177.5 54.9 22.3
2005 974 756.8 217.2 55.6 22.2
2006 1118.8 875 243.8 55.1 21.7
Table 5: Trade in parts and components of manufactured good; China and Mexico (1992-2005)
---
92/ 97/ 2001/ 2004/ An.av growth rates
93 98 02 05 92/3 92/3 01/2
04/5) 01/2 04/5
---
China:
Value ($b)
Exports 3.5 11.6 23.6 78 29.5 23.6 48.9
Imports 10.2 19.1 32 79.3 41.8 44 35.3
Balance -6.7 -7.5 -8.4 -1.3
Shares of components ina :
Total exports 5.3 7.9 11 13.2
Total imports 15.6 20.1 21.4 20.3
Mexico:
Value($b)
Exports 6.4 14.8 23 29.8 13.6 15.2 9
Imports 6.6 19.6 30.6 37.8 15.7 18.5 7.3
Balance -0.2 -4.8 -7.6 -8
Shares of components ina :
Total export 19.1 16.5 17.5 19.8
Total imports 16.2 22.1 23 24.5
Mimeo: balance of man. trade ($b):
China -5.8 46.7 47.1 160.9
Mexico -10.7 -5.3 -11.3 -18.5
---
Source: Based on UN COMTRADE database
Table 6: RCA Indicators forMain Exports of China (1992-3/2004-5)
Change in RCA
SITC at 3 digit levels
Share in country 2004-05 Share in world 2004-05 RCA 2004-05 Rank RCA 2004-05 2004-05 / 1992-93 2004-05 / 2000-01
752 Automatic data processing equip 10.05 2.78 3.62 14 18.680 2.398 764 Telecom equip, parts, acces 7.84 3.46 2.27 37 2.882 1.470 759 Office, adp machy parts, acces 4.03 2.04 1.97 47 4.792 1.744 845 Outer garments knit nonelastic 2.80 0.70 4.01 11 1.084 0.895 894 Toys, sporting goods, etc 2.72 0.66 4.12 10 0.919 0.816 776 Transistors, valves, etc 2.70 3.81 0.71 109 4.914 1.584 763 Sound recorders, phonographs 2.68 0.63 4.23 9 5.510 1.376 851 Footwear 2.44 0.57 4.25 7 0.819 0.774 843 Women's outwear non-knit 2.32 0.69 3.35 20 0.603 0.795 778 Electrical machinery nes 2.23 1.51 1.47 57 1.942 0.940 821 Furniture and parts thereof 2.16 1.01 2.15 40 2.006 1.154 775 Household type equip nes 2.00 0.69 2.88 26 1.723 0.959 842 Men's outwear non-knit 1.56 0.45 3.51 15 0.590 0.754 893 Articles of plastic nes 1.55 0.92 1.67 53 1.162 0.793 772 Switchgear etc, parts nes 1.43 1.44 0.99 88 1.767 1.091 871 Optical instruments 1.39 0.41 3.37 19 2.804 1.942 658 Textile articles nes 1.33 0.30 4.36 5 0.682 0.879 846 Under garments knitted 1.26 0.48 2.61 29 0.688 0.868 699 Base metal manufactures nes 1.15 0.84 1.37 68 1.255 1.048 653 Woven man-made fib fabric 1.15 0.36 3.18 22 1.771 1.271 848 Headgear, non-textile clothing 1.15 0.22 5.25 3 0.896 0.775 771 Electric power machinery nes 1.14 0.46 2.46 32 1.662 1.005 761 Television receivers 1.03 0.56 1.82 51 1.169 1.511 831 Travel goods, handbags, etc 1.01 0.24 4.28 6 0.753 0.749 786 Trailers, non-motor vehicl nes 0.97 0.23 4.23 8 2.269 0.718 652 Cotton fabrics, woven 0.97 0.31 3.14 23 0.648 0.923 749 Non-electr machy parts, acces 0.95 1.11 0.86 97 2.316 1.025 741 Heating, cooling equipment 0.92 0.68 1.35 69 14.997 1.591
Total above 62.93
Total value of exports (billions USD) 678
Table 7: RCA Indicators for Main Import Items of China (1992-3/2004-5)
Change in RCA
SITC at 3 digit levels
Share in country 2004-05 Share in world 2004-05 RCA 2004-05 Rank on RCA 2004-05 2004-05 / 1992-03 2004-05 / 2000-01
776 Transistors, valves, etc 13.90 3.81 3.25 12 4.072 1.555 333 Crude petroleum 6.68 5.25 0.94 79 2.313 0.962 871 Optical instruments 4.45 0.41 9.56 1 19.251 3.524 764 Telecom equip, parts, acces 4.15 3.46 1.29 62 0.629 0.802 583 Polymerization, etc, prdts 3.20 1.53 2.21 28 0.820 0.660 772 Switchgear etc, parts nes 2.72 1.44 1.99 35 2.290 1.150 752 Automatic data processing equip 2.66 2.78 0.94 80 3.949 1.532 759 Office, adp machy parts, acces 2.64 2.04 1.35 59 2.687 1.097 281 Iron ore and concentrates 2.54 0.24 7.00 2 2.288 1.530 728 Oth machy for spec industries 2.38 1.06 2.36 26 0.572 0.934 674 Iron, steel univ, plate, sheet 2.19 1.07 2.13 31 0.795 0.702 778 Electrical machinery nes 2.11 1.51 1.43 57 1.640 1.065 334 Petroleum products, refined 1.68 3.09 0.58 112 0.580 0.849 874 Measuring, controlg instruments 1.50 1.17 1.32 61 1.222 1.090 287 Base metals ores, conc nes 1.40 0.44 2.86 19 2.370 1.121 682 Copper 1.40 0.60 2.42 24 1.135 0.800 582 Prdts of condensation, etc 1.27 0.72 1.76 40 1.479 0.904 222 Seeds for soft fixed oils 1.24 0.22 4.76 6 46.556 0.908 749 Non-electr machy parts, acces 1.20 1.11 1.09 71 1.229 0.999 513 Carboxylic acids, etc 1.16 0.33 3.27 11 2.828 1.042 784 Motor vehicl parts, acces nes 1.15 2.39 0.50 118 1.132 1.135 511 Hydrocarbons nes, derivtives 1.11 0.49 2.17 29 2.239 0.971 736 Metal working machy, tools 1.09 0.46 2.49 23 0.879 1.224 672 Iron, steel primary forms 1.05 0.66 1.55 47 0.402 0.596 512 Alcohols, phenols, etc 1.00 0.28 3.13 15 2.741 1.092 792 Aircraft, etc 0.95 1.30 0.87 84 0.661 0.909 251 Pulp and waste paper 0.94 0.27 3.13 14 3.534 1.043
total above 67.78
Total value of exports (billions USD) 611
Table 8: Evolution of RCA indicators of imports for main capital/technology intensive export items with RCA greater than unity in 2004/5(China: 1992/2-2004/5)
---
RCA Change in RCA
(2004-5) 2004-5/ 2004-5/
SITC Products 1992/3 2001/2
A. Products which also appear as main import item in table 7
Finished products:
752 Automatic data processing 0.94 3.94 1.53
764 Telecom.equipments parts and access. 1.29 0.6 0.8
778 Electric machinery nes. 1.43 1.64 1.055
Parts & components:
759 Office machinery parts and components 1.35 2.687 1.077
772 Switch gear etc parts nes. 1.99 2.29 1.15
776 Transistors, valves 3.351 4.07 1.55
B. Products not included in main import items:
761 TV receivers 0.04 0.14 0.80
775 Household type equipments nes. 0.27 0.87 1.32
763 Sound recorders, phonographs 0.35 0.61 3.89
741 Heating. Cooling equip. 1.20 0.81 1.0
771 Electric power machinery nes. 1.64 1.43 1.12
---