Determining t in t-closeness using Multiple Sensitive
Attributes
Debaditya Roy
Department of Computer Science and Engineering NIT Rourkela
Sanjay Kumar Jena
Department of Computer Science and Engineering NIT Rourkela
ABSTRACT
Over the years, t-closeness has been dealt with in great detail in Privacy Preserving Data Publishing and Mining. Other methods like k-anonymity fail in terms of attribute disclosure and background knowledge attack as demonstrated by many papers in this field. l-diversity also fails in case of skewness attack. t-closenesstakes care of all these shortcomings and is the most robust privacy model known till date. However, till now t-closeness was only applied upon a single sensitive attribute. Here, a novel way in determining t and applying t-closeness for multiple sensitive attributes is presented. The only information required beforehand is the partitioning classes of Sensitive Attribute(s). Since, t-closeness is generally applied on anonymized datasets, it is imperative to know the t values beforehand so as to unnecessarily anonymize data beyond requirement. The rationale of using the measure of determining t is discussed with conclusive proof and speedup achieved is also shown.
General Terms
Privacy Preserving Data Mining
Keywords
Privacy Preserving Data Mining,Privacy Preserving Data Publishing, t-closeness, Multiple Sensitive Attributes
1.
INTRODUCTION
Many government agencies and other organizations often need to publish microdata, e.g., medical data or census data, for research and other purposes. Typically, such data is stored in a table, and each record (row) corresponds to one individual. Each record has a number of attributes, which can be divided into the following three categories. (1) Attributes that clearly identify individuals. These are known as explicit identifiers and include Social Security Number, Address, and Name, and so on. (2) Attributes whose values when taken together can potentially identify an individual. These are known as quasi-identifiers (QI), and may include, e.g., Zip-code, Birthdate, and Gender. (3) Attributes that are considered sensitive, such as Disease and Salary are known as Sensitive Attributes (SA). When releasing microdata, it is necessary to preventthe sensitive information of the individuals from being disclosed.
While the released table gives useful information to researchers, it presents disclosure risk to the individuals whose data are in the table. Therefore, the objective is to limitthe disclosure risk to an acceptable level while maximizing the utility. This is achieved by anonymizing the data before release. The first step of anonymization is to remove explicit identifiers. However, this is not enough, as an adversary may already know the quasi-identifier values of some individuals in the table. This knowledge can be either from personal knowledge (e.g., knowing a particular individual in person), or from other publicly-available
databases (e.g., a voter registration list) that include both explicit identifiers and quasi-identifiers. A common anonymization approach is generalization, which replaces quasi-identifier values with values that are less-specific but semantically consistent. As a result, more records will have the same set of QI values. An equivalence class of an anonymized table and of the sensitive attributeis defined as a set of records that have the same values for all the QIs.Another is suppression, which suppresses the value of an attribute if that value causes the overall k-anonymity or any other privacy measure to fail. But the suppression is minimized using the suppression count or percentage.
Models like k-anonymity [1, 2], l-diversity [3], t-closeness [4]etc.have been proposed over the years which are collectively known as Privacy Preserving Data Publishing models. In [1, 2] k-anonymitywas introduced as the property that each record is indistinguishable with at leastk-1 other records with respectto the quasi-identifier. In [3] a new notion of privacy was introduced, called l-diversity, which requires thatthe distribution of a sensitive attribute in each equivalence class has at least “well represented” values.
In [4], t-closenesswas proposed that formalizes the idea of global background knowledge by requiring thatthe distribution of a sensitive attribute in any equivalence class is close to the distribution of the attribute in the overall table (i.e., the distance between the two distributions should be no more than a threshold t). Furthermore, the t-closeness approach tends to be more effective than many other privacy-preserving data mining methods for the case of numeric attributes.However, all the above methods were applied on datasets where only a single sensitive attribute was considered.
In this paper, a novel way of calculating t using multiple sensitive attributes is presented. The partitioning of sensitive attributes (SA) into classes and finding the overlapping areasgives a way to find t.Ast-closeness is an NP-Hard problem[5],execution time can be saved if applicationof any t-closenessalgorithm is carried out for one value of t. Once this is accomplished, the verification can be done using the results obtained by checking with the degradation in data quality.
2.
RELATED WORK
2.1
Concept of
t-closeness
Privacy gain is measured by the information gain of an observer [4]. Before seeing the released table the observer has some prior belief B0 about the sensitive attribute of an
individual. If the observer sees a table that is completely generalized (quasi identifier are either removed or generalized equivalently) then the belief becomes B1 which is influenced
identifier(s) of the table the observer is able to learn about P, the distribution of the sensitive attribute of the table, his belief changes to B2.
In order for the public information to be Q, do not limiting the gain between B0 and B1 is not prevented. Rather, the distance
between P and Q is limited and the closer they are B2 does not
vary much from B1 and the gained knowledge from the
released table is quite less. This results in maintaining privacy for the participants of the data.
2.2
Distance Measures
Till now, two distance metrics for calculating t in t-closenessare used.
(1)The Earth Movers Distance (EMD)[6] measures the distance between two distributions, in this case the distance between the distribution of SA in an equivalence class and the overall distribution of that SA in the table or dataset. The EMD is based on the minimal amount of workneeded to transform one distribution to another by movingdistribution mass between each other. This distance is different for both numerical and categorical attributes. The forms describing them are given as follows.
For numerical attributes,let , then the EMD between P and Q can be calculated as:
(2)Hellinger distance [7] as the distance measure for calculating t was proposed in [8] is calculated for two distributions P and Q as follows:
where is Bhattacharya’s Coefficient[19].
2.3
Multiple Sensitive Attributes (MSA)
The problem of MSA was first tackled in [9] based on k-anonymity[1] andl-diversity[3], where it was determined that generalization is not the solution in this case. Further, a framework known as Decompose was given in [10] which was based on l-diversity[3] was given to tackle the MSA in any given table. In [11], an improved framework known as Decompose+ was given with implementations on real-life scenarios.
Another model for MSA was given in [12], which was based on (n, t)closeness [4] stating the limitations of l-diversity.
2.4
Information Loss Metrics
To measure theloss in data quality occurring when we generalize the microdata the following the metrics were proposed.
(1)The Discernibility Metric (DM) [13], measuresthe cardinality of the equivalence class.Itassigns a penalty to eachtuple based on how many tuples in the transformed dataset are indistinguishablefrom it. Let t be a tuple from the
original table
, and let
be theset of tuples in an
anonymized table indistinguishable from t or the set oftuples in equivalent to the anonymized value of t. Then, is defined asfollows:
(2)
The precision[13] of ageneralization scheme is then 1 - the average height of a generalization (measuredover all cells). The precision is 1 if there is no generalization and is 0 ifall values are generalized.(3)Given a set of tuples S and the class labels cls involved inS, the entropy[14] is defined as:
where is the number of tuples containing class in
These metrics together along with others give an idea about the available information utility after generalization.
3.
PROPOSED SCHEME
3.1
Determining
t
in
t-closeness
While determining the optimal value of tthe following problems are encountered. (1) In known literature, there is no mention of any method for determining t. All the authors [16] suggest is to match the heuristics based on earlier experiments to verify the results and this involves a lot of randomness in the experiments. (2) If the optimum value of thas to be determined using the utility vs. privacy curve it is not possible do so because of the inherent nature of the curve i.e. diverging.
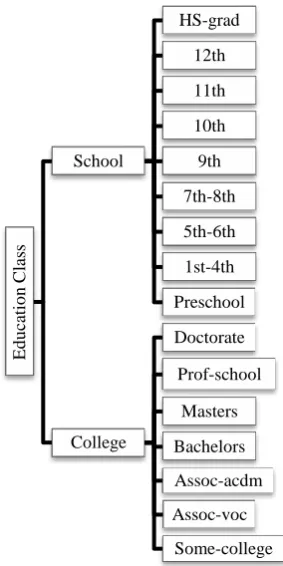
So, instead a method based on the partitioning of sensitive attributes into classes is employed. The sensitive attributes to be considered for this exercise can vary according to the necessity of the data disseminating body in question [1].
Figure 1 Partitioning of Education Class
The value obtained (x) is then subtracted from 1 to getthe value of t.
………(1)
3.2
Detailed Inference
In this section, the detailed inference to the formula that is applied (1) in the earlier section togetthe t-value is provided. The definition of t-closeness [4] states:
[image:3.595.318.539.115.290.2]“An equivalence class is said to have t-closeness if the distance between the distribution of a sensitive attribute in this class and the distribution of the attribute in the whole table is no more than a threshold t. A table is said to have t-closeness if all equivalence classes have t-t-closeness.” From the above definitiontwo things can be inferred. First, the lower the value oft i.e. t →0; the more diverse the original data is and the equivalenceclass is required to be as close to original data as possible to give the required anonymization.
Secondly, the higher the value of t i.e. t →1 , the less diverse the originaldata and the equivalence class is required to be as different as possible from theoriginal data to give the appropriate anonymization.
From these two inferences it can be saidthat if it is possible to capture the diversity oftwo or more sensitive attribute by the diversity of their equivalence classes andthen it can be used to get a common diversity measure by comparing the Niche Overlap[20]between the two distributions.
Since, t-closeness refers to similarity between thedistributions and hencethe need to subtractthe Niche Overlap value from 1.Thus, it can be inferredthatthe formula to calculate t is indeed correct.
4.
EXPERIMENT AND RESULTS
For verifying the value of t obtained in [4], the CUPS and ADULT dataset [15] were used.
Figure 2 Area of overlap of Disease and Salary in CUPS dataset
For the CUPS datasetthe experimentwas performed using two sensitive attributes - Disease and Salary. The individual closeness values as given in [4]are 0.167 for Disease(categorical) and 0.278 for Salary(numerical). When a scattered plot of both Disease and Salary is taken the results are obtained as shown in Figure 2.
From the dataset it can be seen that maximum anonymization for both Disease and Salary are reached as the value of t = 0.20 gives least data degradation while preserving data utility[4]. So the bound of t that is obtained is pretty close to the actual value for optimum t.
Similar experiment was conducted on the ADULT dataset and the sensitive attributes chosen were [11] – hours-per-week (continuous), education class (categorical), relationship status (categorical) and workclass (categorical).
Table 1Percentage overlap of SAs in ADULT dataset
Sensitive Attribute Group Niche Overlap
Hours-per-week-relationship-workclass 89%
Hours-per-week-relationship-education 85%
Hours-per-week-relationship-workclass 79%
education-relationship-workclass 30%
The area of overlap calculated in terms of Niche Overlap [20] which gives the area of overlap between two discrete distributions between the attributes provided for any SA Si where Kgives all possible discrete values Sitakes. Since all the SA distributions are converted to SND the criteria is met. The detailed Niche Overlap values are shown in Table 1 and the scattered plots are given in Figure 3.
The trio of education class-relationship status-workclass gives such low value of overlap because of the high mismatch in the
Ed
u
ca
ti
o
n
Clas
s
School
HS-grad
12th
11th
10th
9th
7th-8th
5th-6th
1st-4th
Preschool
College
Doctorate
Prof-school
Masters
Bachelors
Assoc-acdm
Assoc-voc
[image:3.595.320.537.533.648.2]number of classes of the participating attributes. Hence, it can be safely considered that 79% or 0.79 is the minimum overlap value and the value of t corresponding to it 0.21.
Figure 3 Areas of overlap of SA of ADULT dataset
Figure 4t-values vs Information Loss Metrics (ADULT Dataset)
The ARX-Flash Anonymization Toolbox[18] was used to verify the results obtained and it can be clearly seen from Figure 4 that Information Loss metrics used give least Information Loss on or before the bound for t=0.21 is reached. So, it reduces the effort of checking for higher values of t saving precious execution time.
5.
CONCLUSION AND FUTURE WORK
The proposed scheme utilizes the Multiple Sensitive Attributes in any given dataset to determine t. The experiments have been conducted on two well-known datasets ADULT and CUPS to obtain the values of t which correspond to good bounds on the actual t-values which are used for
anonymization purposes. The effectiveness of our method can be measured in terms of time saved while determining t for yet unknown datasets which have to be anonymized. However, if any dataset has only 1 sensitive attribute then our method for determining t cannot be employed to determine t for that particular dataset.
which differ in number of partitioning classes.
6.
REFERENCES
[1] Sweeney, L. 2002. K-anonymity: A model for protecting privacy. Int. J. Uncertain. Fuzz., 10(5):557–570.
[2] Samarati, P. 2001. Protecting respondents’ identities in microdata release. In IEEE Transactions on Knowledge and Data Engineering.
[3] Machanavajjhala, A., Gehrke, J., Kifer, D. and Venkitasubramaniam, M., 2006. l-diversity: Privacy beyond k-anonymity. In Proc. 22nd Intnl. Conf. Data Engg. (ICDE):24.
[4] Li, N., Li, T., Venkatasubramanian, S., 2007.t-closeness: Privacy beyondk-anonymity and l-diversity. In Proceedings of ICDE (2007).
[5] Liang, H. and Yuan, H. 2013. On the Complexity of t-closeness Anonymization and Related Problems. arXiv preprint arXiv:1301.1751 (2013).
[6] Rubner, Y.,Tomasi, C., and Guibas, L. J., 2000. The earth mover’s distance as a metric for image retrieval. Int. J. Comput. Vision, 40(2):99–121.
[7] Nikulin, M.S., 2001. Hellinger distance. Encyclopedia of Mathematics, Springer. ISBN 978-1556080104.
[8] Khaitan, P., Korra, S. B., Jena, S. K. and Majhi, B., 2009. Approximation algorithms for optimizing privacy and utility. In Proceedings of 2nd International Conference on Computer Science and its Applications CSA, South Korea:59-64.
[9]
Gal, T. S., Chen, Z., Gangopadhyay, A., 2008, July-September.A Privacy Protection Model forPatient Data with Multiple Sensitive Attributes. International Journal of Information Security and Privacy, 2(3):28-44.[10]Ye, Y., Liu, Y., Wang, C., Lv, D. and Feng, J., 2009, January. Decomposition: Privacy preservation for multiple sensitive attributes. In Database Systems for Advanced Applications, Springer Berlin Heidelberg: 486-490.
[11]Das, D. and Bhattacharyya, D. K., 2012. Decomposition+: Improving ℓ-Diversity for Multiple Sensitive Attributes. In Advances in Computer Science and Information Technology. Computer Science and Engineering, Springer Berlin Heidelberg: 403-412.
[12]NarasimhaRao, M. V. R.,VenuGopalkrisna,J.S., Vishnu Murthy, R.N.V.,Ramesh, C. R.,2012,Mar-Apr. Closeness: privacy measure for data publishing using Multiple Sensitive Attributes.In International Journal of Engineering Science and Advanced Technology .ISSN: 2250–3676[IJESAT] 2(2): 278 – 284.
[13]Bayardo, R. J. and Agrawal, R., 2005. Data Privacy through Optimal k-Anonymization. In Proc. of ICDE(2005):217–228.
[14]Shannon, C. E., 1949. The Mathematical Theory of Communication, University of Illinois Press.
[15]Venkatasubramanian, S., 2010. Closeness: A New Privacy Measure for Data Publishing.IEEE Trans. on Knowledge and Data Engineering 22 (2010): 943-956.
[16]Fung, B.C.M., Wang, K., Chen, R., Yu, P.S., 2010. Privacy-preserving data publishing:A Survey of Recent Developments. ACM Computing Surveys 42 (2010):1-53.
[17]U. C. Irvine, “Machine Learning Repository”, http://www.ics.uci.edu/mlearn/mlrepository.html.
[18]ARX – Powerful Data Anonymization http://arx.deidentifier.org/
[19]Bhattacharyya, A., 1943. On a measure of divergence between two statistical populations defined by their probability distributions.Bulletin of the Calcutta Mathematical Society 35: 99–109. MR0010358.