Improving the Network Lifetime in WSN through
Enhanced LEACH
Roopali Garg
Coordinator (I.T.) Astt.Professor, U.I.E.T Panjab University, Chandigarh
Deepika Gupta
Research Scholar (I.T.) U.I.E.T, Panjab University
Chandigarh
ABSTRACT
Wireless sensor network is a network of energy constrained nodes with the capability of sensing and communication covering a large area. Although WSNs have significant advancements in many areas; maximizing the lifetime of the whole network remains a major obstruction. Various protocols and approaches have been into existence to overcome this drawback. One of the approaches is optimizing the angle by which sensors are placed in the grid formation. Here, in this paper we are going to implement this new approach through enhanced LEACH to have better network lifetime and enhance our results.
Keywords
Wireless Sensor Network, LEACH, network lifetime, cluster head, Time division multiple access
1. INTRODUCTION
A sensor node generally consists of sensors, actuators, memory, a processor and they communicate through a wireless medium.WSNs are deployed to carry out various applications, such as environmental monitoring [1], wildlife habitat monitoring [2], acoustic monitoring [3], and battlefield surveillance [4]. But these applications raise a few challenges like improving the network lifetime by making the sensor nodes functional for a longer period of time. Figure1 represents a typical wireless sensor network. The sensor nodes(SN) send the data packet to the respective cluster heads(CH) which further sends data to the sink or the base station. The nodes can vary from hundreds to thousands.
Figure 1: A typical wireless sensor network [5]
LEACH (Low Energy Adaptive Clustering Hierarchy) protocol is the basic and the most important protocol in wireless sensor network which uses cluster based broadcasting technique [6]. It is the first hierarchical cluster-based routing protocol for wireless sensor network .Still, LEACH needs improvement against the neglect of residual energy, location and the non-uniformity distribution in the selection of the cluster head [7]. Further, it also needs improvement against single-hop transmission [8]. Energy-LEACH protocol improves the cluster head selection procedure. It makes residual energy of node as the main criterion which decides whether the nodes turn into CH or not after the first round [9]. LEACH-C protocol is the further improvement over LEACH protocol. LEACH-C protocol uses a centralized clustering algorithm to determine good clusters. In addition to this, the sink also calculates the average node energy to have energy load uniformly distributed among all the nodes by determining which nodes have energy below this average [7]. In EE-LEACH-MIMO, both the location and the residual energy are taken into criteria for choosing the cluster head for clustering and cooperative nodes for the MIMO system [10]. In this paper an enhanced LEACH has been proposed in which the angle is optimized for partioning the sensor nodes. The square network is plotted; location and residual energy of the nodes are considered for choosing the cluster head effectively.
The rest of the paper is organized as follows: Section 2 describes the proposed enhanced LEACH protocol. In section 3, energy consumption model is discussed. Section 4 shows the simulation done. Section5 presents the results and comparison. Section 6 concludes the paper.
2. ENHANCED LEACH PROTOCOL
In clustering, the network is divided into many clusters; each cluster consists of cluster head and many other member nodes. LEACH protocol is one of the clustering protocols. The process of LEACH is divided into rounds and each round consists of two phases: cluster setup and data transmission. In the cluster setup phase, clusters are formed and the cluster head is generated randomly. In data transmission phase, the member nodes send data to the cluster head; cluster head fuses the data and sends it to the sink.
randomly distributed in S×S region space. The sink is located far from the monitoring area.
In this scheme, operations are performed in respective stages: area partition, cluster head generation and data transmission.
2.1 Area partition
In our scheme, firstly, the network is partitioned by the sink by applying the optimum angle: that forms different clusters. Then, further is splitted into by the following strategy:
0≤ ≤ -1 (1)
here varies from 0: .1: -1
2.2 Cluster head generation
In the network based on clustering, cluster head is responsible for coordinating the operations among other sensor nodes in the cluster, collecting and fusing the data and then sending it to the sink. Thus, the load on cluster head is more and it consumes more energy. So during the generation of cluster head, both the position and the residual energy of the node are considered to balance the energy.
In the first round, node whose position is close to the sink is chosen as the cluster head. In the following rounds, the member node can be the cluster head if it follows two conditions: 1) The location of the node must be close to the sink.2) The residual energy of the nodes must be greater than the threshold. Then the strategy followed is[10]:
(2) (j) (3)
where dj is the distance from the member node j to the sink, (j) is its residual energy and is the threshold energy. The threshold energy is set to be the average residual energy of all the alive nodes in the cluster.
2.3 Data Transmission
After the above phases, data transmission takes place: nodes send their data during their allocated TDMA (time division multiple access) slot to the cluster head [11]-[12]. Then CH creates and broadcasts its own TDMA schedule which includes time slots for data transmission from member nodes to the cluster head and then from the cluster head to the sink. CH fuses the data packet received from member nodes and then transfer it to the sink.
3. ENERGY CONSUMPTION MODEL
The energy consumed in the network depends upon various factors: 1. Data transmission from the member nodes to the cluster head and then from the cluster head to the sink.2.Data received.3. Energy consumed in fusing the data by the cluster head. The energy consumption model is introduced in [10]. The energy consumption for transmitting and receiving the l bit message covering a distance of d meters in the m -th power path-loss channel respectively are:
(l,d)= + (4) (l)= (5)
where and presents the transmitter and the receiver circuit energy consumption per bit respectively. denotes the effect of antenna, amplifier and carrier frequency with the prescribed bit error rate (BER).
4. SIMULATION
This section covers the simulation done for Enhanced LEACH in matlab. We use the number of rounds before the first node dies (FND), half nodes die (HND) and last node dies (LND) for examining the lifetime of the network. The parameters taken for the simulation work are presented in Table1.
Table1. System Parameters
Parameters Values
Sensor nodes 100
Simulation Area 100*100
10°, 30°, 60°, 90°
Sink position (50,175)
Data packet 2000 bits
Initial energy 0.5 J
100pJ/bit/m2
50nJ/bit
50nJ/bit
Energy for data fusing 5nJ/bit
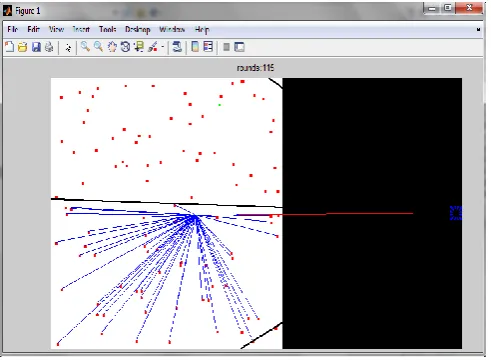
Figure 2: Simulation window showing deployment of 100 nodes in 100*100 area at 10° angle
Figure 3: Simulation window showing deployment of 100 nodes in 100*100 area at 30° angle
Figure 4: Simulation window showing deployment of 100 nodes in 100*100 area at 60° angle
Figure 5: Simulation window showing deployment of 100 nodes in 100*100 area at 90° angle
Figures 2, 3, 4 and 5 are random snapshots of the network taken at different rounds.
5. RESULTS AND COMPARISON
Figure6: FND, HND and LND obtained at 10° angle
Figure6. shows the values obtained for FND, HND and LND when 100 nodes were deployed in 100*100 field at 10° angle.
Figure7: FND, HND and LND obtained at 30° angle
Figure7. shows the values obtained for FND, HND and LND when 100 nodes were deployed in 100*100 field at 30° angle.
Figure8: FND, HND and LND obtained at 60° angle
Figure9: FND, HND and LND obtained at 90° angle
Figure9. shows the values obtained for FND, HND and LND when 100 nodes were deployed in 100*100 field at 90° angle.
Table2. FND, HND, LND of Enhanced LEACH at different clustering angles
10°
30°
60°
90°
FND
1437
1475
2017
2003
HND
2193
2237
2250
2242
LND
2413
2460
2475
2463
Simulation results are shown in the Table2 and Figures 6, 7, 8 and 9. In comparison to 10°, 30° and 90°; (60°) gives the maximum number of rounds for the nodes to be alive.
Figure10: FND, HND, LND for different clustering angles
By comparison with 10°, FND, HND, LND of 60° prolong by 40%(approx), 2.6%(approx) and 2.6%(approx) respectively. In contrast to 30°, for 60°, lifetime prolong by 36.7%, 0.58% and 0.60% and in comparison with 90°; 0.69%,
0.35% and 0.48% improvements can be seen when deploying 100 sensor nodes at 100*100 field at 60° clustering angle.
6. CONCLUSION
In the proposed method, Enhanced LEACH was implemented that uses both the location and the residual energy of the node in the selection of the cluster head. Network is partitioned by the sink by applying the optimum angle. The network is a square area having square grids formation to centrally place all the nodes. Partitioning the area at 60° provides the maximum lifetime. For the future work, the simulation area can be varied. Angles other than 10°, 30°, 60° and 90° can be applied.
7. REFERENCES
[1] T. D. R¨aty, “Survey on contemporary remote surveillance systems for public safety”, IEEE Trans. Syst., Man, Cybern., Part C, vol. 40, no. 5, pp. 493–515, Sep. 2010. [2] A. Mainwaring, D. Culler, J. Polastre, R. Szewczyk, and J.
Aderson, “Wireless sensor networks for habitat monitoring”. In Proc. ACM International Workshop on Wireless Sensor Networks and Applications, (2002), pp. 88–97.
[3] H. Wang (2006). “Wireless Sensor Networks for Acoustic Monitoring”, Doctoral Thesis, (2006), SBN: 978-0-542-79693-7.
[4] K. R¨omer, F.Mattern, and E. Zurich, “The design space of wireless sensor networks” ,IEEE Wireless Commun., vol. 11, no. 6, pp. 54–61, Dec. 2004.
[5]Murad A. Rassam, Anazida Zainal, Mohd Aizaini Maarof, “An adaptive and efficient dimension reduction model for multivariate wireless sensor networks applications”, Journal of Applied Soft Computing, Vol 13 issue 4, April 2013, pp. 1978-1996
[6] Wendi Rabiner Heinzelman, Anantha Chandrakasan, and Hari Balakrishnan, “Energy-Efficient Communication Protocol for Wireless Microsensor Networks” Copyright 2000 IEEE. Published in the Proceedings of the Hawaii International Conference on System Sciences, January 4-7, 2000, Maui, Hawaii
[7] W. B. Heinzelman, A. P. Chandrakasan, and H. Balakrishnan, “AnApplication-Specific Protocol Architecture for Wireless Microsensor Networks”, IEEE Transactions on Wireless Communications, vol. 1,Oct, 2002, pp. 660-670, doi:10.1109/TWC.2002.804190. [8] F. M. Omer, D. A. Basit, and S. G. Asadullah, “Multi-hop
Routing with Low Energy Adaptive Clustering Hierarchy,” Proc. International Conference. Sensor Technologies and Applications (SENSORCOMM 10), IEEE Press, July, 2010, pp. 262-268, doi: 10.1109/SENSORCOMM.2010.48.
[9]Fan Xiangning, Song Yulin. “Improvement on LEACH Protocol of Wireless Sensor Network”, Sensor Technologies and applications, 2007, SensorComm, 2007
[11]L. Clare, G. Pottie, and J. Agre, “Self-organizing distributed sensor networks,” in Proc. SPIE Conf. Unattended Ground Sensor Technologies and Applications, vol. 3713, Orlando, FL, Apr. 1999, pp. 229–237.