Citation:
Johnston, DK and Farmer, D and Miles-Shenton, D (2016) Quantifying the aggregate thermal
performance of UK holiday homes. Building Services Engineering Research and Technology. ISSN
1477-0849 DOI: https://doi.org/10.1177/0143624416681614
Link to Leeds Beckett Repository record:
http://eprints.leedsbeckett.ac.uk/3253/
Document Version:
Article
The aim of the Leeds Beckett Repository is to provide open access to our research, as required by
funder policies and permitted by publishers and copyright law.
The Leeds Beckett repository holds a wide range of publications, each of which has been
checked for copyright and the relevant embargo period has been applied by the Research Services
team.
We operate on a standard take-down policy.
If you are the author or publisher of an output
and you would like it removed from the repository, please
contact us
and we will investigate on a
case-by-case basis.
Quantifying the aggregate thermal performance of UK holiday homes
Professor David Johnston
1BEng (Hons) MSc PhD
*,
David Farmer
1BSc (Hons),
Dominic
Miles-Shenton
1BSc (Hons)
1
Centre for the Built Environment Group, Leeds Sustainability Institute, Broadcasting Place Building
A, Leeds Beckett University, City Campus, Leeds LS2 9EN, UK.
*[email protected] 01138127638
Abstract
In the UK, there are approximately 330,000 holiday homes spread across a large number of mainly privately owned sites. These homes are often sited in exposed locations, are poorly insulated and are generally heated using expensive fuels, such as electricity or LPG. There is also a lack of empirical evidence available on the in situ energy performance of these homes. Consequently, it is not possible, given the existing evidence base, to determine whether these homes suffer from the same scale of building fabric thermal ‘performance gaps’ (between assumed and realised in situ performance) that have been documented for new build UK housing. This paper presents the results obtained from undertaking detailed in situ thermal fabric tests on five new holiday homes. Whilst sample size reported here is small, the results indicate that a ‘performance gap’ exists for all of these homes. Results obtained indicate that this gap appears narrower than that documented for new build UK housing. The results also suggest that the scale of the ‘gap’ may be more a consequence of the way in which the design intent of these homes has been determined, i.e. a ‘prediction gap’.
Keywords: coheating, heat flux measurement, holiday homes, in situ testing, park homes.
Practical application
assumed and realised in situ performance. These results could be used by industry to develop more appropriate prediction tools that are relevant to holiday homes.
1 Context
In the UK, and in most other industrialised countries, the thermal performance of the building fabric is very rarely tested or measured in the field, so traditionally it has been assumed that the building fabric performs thermally as the design originally intended (design intent). However, in recent years, a growing and well-founded body of evidence has emerged, both in the UK and internationally, that indicates that the building fabric of new and refurbished buildings does not always perform as the design intended. Empirical data obtained from the field indicate that the measured in situ thermal performance of the building fabric as-built is often much greater than the steady-state predicted thermal performance of the building fabric as-built(1, 2, 3,4)
.
This difference between the measured and the predicted performance is commonly referred to as the building fabric ‘performance gap’. This ‘performance gap’ has been observed at an elemental and at an aggregate level and differences between the measured and predicted performance of the building fabric of more than 100% have been documented(5). Such large discrepancies in performance are likely to have a detrimental effect on the energetic function of the dwellings concerned and their occupants comfort and health.Set within this context, this paper is concerned with investigating the thermal performance of the building fabric of new holiday homes in the UK only. Despite this, the findings and a number of the learnings from this paper are likely to be equally applicable to similar building types both within the UK and abroad.
2 Introduction
Holiday homes, also known as static caravans, are structures that have either been designed or adapted for human habitation. In order to comply with the definition of a caravan, they must not exceed certain size limits and must be capable of being transported by road from one place to another, in no more than two separately constructed sections, and then assembled on site(6). They are normally prefabricated in a factory on a wheeled chassis (although skids have been used) and then transported by road to the site on the back of a transporter or trailer.
for permanent residence. Holiday homes, as the name suggests, are specifically designed to be used seasonally on a temporary basis. The National Caravan Council (NCC) estimate that there are approximately 330,000 holiday homes in the UK(8), equivalent to just over 1% of all of the current number of households in the UK(9).However, as not all of the manufacturers of holiday homes are members of the NCC, this figure is based more upon anecdotal evidence, rather than any verifiable empirical data(8). The NCC also log data on the number of new holiday homes manufactured each year by their members. In 2015, almost 17,000 (16,872) new holiday homes were manufactured in the UK by NCC members(10).
The majority of the sites in which holiday homes are located are privately owned and are situated in rural and coastal areas that are not generally connected to the mains gas network. Consequently, space heating, water heating and cooking are most commonly provided using some of the most expensive fuels, namely electricity or bulk or bottled LPG which are currently 200% and 60% more expensive than mains gas per kWh, respectively(11). As a large proportion of these holiday homes tend to be located in exposed locations (e.g. near the coast), they can be particularly vulnerable to adverse weather conditions, so can be hard and costly to heat. In addition, as most of the parks are privately owned, the park owner is responsible for providing all of the infrastructure and services associated with the site. It is therefore common for there to be no sub-metering of electricity use on-site. Instead, one aggregate electricity meter may serve the entire park and the bill is equally shared by all of the residents of the site. As there is no direct relationship between the amount of electricity consumed by the occupants of the holiday homes and the amount billed, there is a risk that the occupants of these homes may be more energy profligate than the general population as a whole. This is particularly likely to be the case when the holiday home is used by holidaymakers, rather than private owners, as holidaymakers do not tend to be directly charged for the amount of electricity consumed. Instead, a notional cost for the amount of gas or electricity consumed will be factored into the cost of the holiday.
to this standard since its introduction in 1970(16, 17, 18, 19). As can be seen from Tables 1 and 2, the thermal insulation requirements of new holiday homes are not particularly onerous and are considerably poorer than those required for park homes. It is also clear that the current thermal performance standards for holiday homes are significantly below that contained within Part L1A of the Building Regulations(20). Consequently, new holiday homes tend to be poorly insulated compared to their domestic and park home counterparts. In addition, as the requirements of BS EN 1647 only apply to new holiday homes, a significant proportion of existing holiday homes are likely to have been built to much lower thermal insulation standards, so consequently will be even more costly to heat.
It is also clear from the available literature that there is a distinct lack of empirical evidence available on the in situ energy performance of holiday or park homes. Although some data are available on park homes, this tends to present the overall reductions in energy use that have been achieved by applying specific solutions, such as external wall insulation or higher performance windows (for instance, see(21, 22)). Very few published studies are available that have measured the in situ performance of the building fabric in any detail either prior to or post refurbishment. Of the studies that have, the most detailed was undertaken in the United States almost 40 years ago, which investigated the difference between the measured and predicted heat loss of a two-bedroom mobile home using a number of different coheating tests(23). This work found that when the outside temperatures were low, the measured heat loss was 5 to 17% greater than the predicted values depending upon the test undertaken, illustrating the presence of a building fabric thermal ‘performance gap’. Part of the reason for this discrepancy in performance was attributed to a thermal bypass occurring within the external wall of the mobile home. Other work undertaken in the UK as part of the UK Governments Carbon Emission Reduction Target (CERT) programme, investigated the thermal performance of 100 existing park homes, and then 20 of these homes following the application of two different types of external wall insulation systems(24). The in situ U-value measurements undertaken as part of this work prior to the upgrading work revealed that in a large number of cases, the measured in situ U-values were much greater than those contained within the relevant British Standard (BS 3632) that the home was manufactured to, signifying a ‘performance gap’ between the measured and predicted building fabric of these park homes. Consequently, it is not possible, given the existing evidence base, to determine how the building fabric of UK holiday homes performs as a whole and whether they are likely to suffer from the same scale of building fabric thermal ‘performance gap’ that has been documented for new build UK housing (see(5)).
to characterise the aggregate building fabric thermal performance of these homes. Secondly, to enable a comparison to be undertaken between the design intent heat loss coefficient and that measured in situ. Thirdly, to establish whether a building fabric thermal ‘performance gap’ exists within these holiday homes.
3 Test method
In order to characterise the thermal performance of the building fabric of the holiday homes as-built, a series of in situ building fabric tests were undertaken on a small number of case study holiday homes (hereafter referred to as test caravans). All of these tests formed part of much larger project undertaken for Bourne Leisure Limited, on one the largest holiday home park operators in the UK, the aim of which was to determine the optimum levels of insulation (and U-values) that should be specified for the main external elements of their fleet hire caravans (see(25)). Only three of the tests undertaken on the test caravans will be discussed within this paper, namely:
Air pressure tests and leakage detection – These tests were undertaken to determine the intrinsic airtightness of each test caravan and to enable an approximation to be made of each test caravan’s background ventilation heat loss. Leakage detection, using thermal imaging, was also undertaken in order to identify the main air leakage points and paths within each test caravan. All of the pressure tests were performed along the lines of ATTMA Technical Standard L1 testing protocol for building envelopes (dwellings)(26). The tests were undertaken using an Energy Conservatory Minneapolis Duct Blaster® System with a DG700 dual-channel pressure gauge. The overall uncertainty in the tests is less than 10%(27). In accordance with the advice given in CIBSE TM 23(28), both a pressurisation and depressurisation test were undertaken on each test caravan and the results averaged. This ensured that equal weight was given to both the pressurisation and depressurisation test result.
CO2 tracer gas decay measurements –A series of CO2 tracer gas decay measurements were undertaken
estimates were calculated in accordance with the method described within Roulet and Forandini(29).This test method has an uncertainty of less than 10%(30), based upon laboratory measurements.
Electric coheating test – The measured in situ heat loss of each of the test caravans was obtained by performing an electric coheating test. An electric coheating test is quasi steady-state aggregate test method that has been developed to measure the aggregate in situ heat loss (both fabric and background ventilation) of an unoccupied dwelling in W/K (see (31)). All of the electric coheating tests were undertaken based upon a modified version of the Leeds Beckett University (formerly Leeds Metropolitan University) whole house heat loss test method (coheating) protocol (see(32)). As the test caravans are of a lightweight construction and consequently have very low thermal mass, the test method was modified such that the heat loss coefficient (HLC) was estimated from a time period thought not to be influenced by direct or previously stored solar radiation, namely 18:00 – 05:59 inclusive (the tests were undertaken in February where sunrise and sunset was approximately 08:00 and 17:00, respectively). In addition, due to the limited time period associated with each test (approximately 1 week per test) and the fact that any thermal lag between a change in ΔT and the resultant change in heating power is likely to be minimal (due to the low thermal mass of the caravans), the electric coheating data was aggregated into hourly mean time intervals for the analysis. The uncertainty associated with the coheating test varies depending upon the test conditions.
4 Test caravans
The in situ measurements were undertaken on five unoccupied new build hire fleet caravans, each produced by a different manufacturer. Four of the caravans tested were 35 x 12ft models, with the remaining caravan being a 40 x 14ft model. Dimensions of the caravans tested are contained within Table 3. To ensure that the performance of the caravans was representative of the model selected for testing, none of the manufacturers were informed of the particular caravan that was to be tested prior to the commencement of the in situ measurements.
All of the tested caravans were located next to one another on the same site in North Yorkshire. The test caravans were orientated north/south (A-frame facing north and master bedroom facing south), to minimise solar gain through the large proportion of glazing located on the front elevation of the test caravans, and positioned in such a way that they all had as similar levels of exposure as was practically possible (see Figure 1).
5 Results and discussion of the building fabric tests
5.1 Air pressure tests and leakage identification
5.1.1 Air permeability and air leakage rates
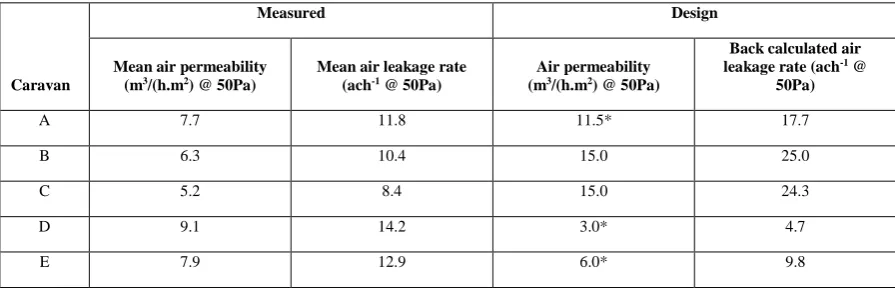
The results of the air pressure tests undertaken on the test caravans are summarised in Table 4. For context and comparative purposes, the measured air permeability and air leakage values have been compared against the design figures that have been inserted into the appropriate national calculation methodology (In the UK, the Government’s Standard Assessment Procedure (SAP)(33) is used for new dwellings). For park and holiday homes, this is version 12 of theNCC’s Energy Efficiency Rating Calculator for Park and Caravan Holiday Homes(34). The values contained within this calculator thus represent the original design intent for each of the test caravans. Table 4 also includes the corresponding extrapolated design air leakage rate for each test caravan based upon the design air permeability value inserted within the NCC Energy Efficiency Rating Calculator. These air leakage rates have been included to illustrate the size of the difference that can exist.
For caravans, A, B and C, the measured air permeability values obtained when all of the purpose provided ventilation and gas drop out points1 were sealed are significantly lower than the design intent. For caravans B and C, this can be attributed to the fact that the manufacturers of these caravans claimed that no airtightness test had been undertaken on a suitably tested caravan, so the air permeability figure used for the design intent was the default value of 15 m3/(h.m2) @ 50Pa contained within the NCC Energy Efficiency Rating Calculator. This figure is artificially high to encourage manufacturers to undertake an air pressure test on their caravans.
For caravan A, the measured figure obtained during the air pressure test was significantly lower than the measured value inserted into the NCC Energy Efficiency Calculator (7.7 as opposed to 11.5 m3/(h.m2) @ 50Pa). For caravans D and E, the opposite is true, with the measured air permeability values being significantly greater than the design intent. In the case of caravan D, the measured air permeability is over 300% greater than the design intent value, representing a significant performance gap. In caravan E, the discrepancy between the measured and design air permeability values was much smaller, with the measured air permeability being just over 30% greater
1 These consist of holes in the floor located beneath gas appliances that enable any leakage of gas, which is heavier than air, to escape from
than the design intent air permeability. However, this still represents a significant performance gap. Part of the reason for the discrepancies in air permeability may be attributable to the fact that the NCC Energy Efficiency Calculator allows the manufacturers to use an air permeability test result that has been obtained from a different sized caravan as long as it is of the same construction. However, they do ask that the manufacturer tests a caravan that is likely to be the worst case scenario for a particular construction, which is generally the smallest model built using that construction. Although this may explain some of the difference in the air permeability results, it is unlikely to explain the large difference in measured air permeability for caravan D.
The results also illustrate that the air permeability of the caravans varies significantly, from just over 5 m3/(h.m2) @ 50 Pa for caravan C to just over 9 m3/(h.m2) @ 50 Pa for caravan D. On average, the air permeability of the test caravans was just over 7 m3/(h.m2) @ 50 Pa. This level of air permeability is lower than the minimum standard of 10 m3/(h.m2) @ 50 Pa that is contained within Part L1A of the Building Regulations(20) and is comparable to that achieved in new build housing in the UK. Interestingly, all of the test caravans achieved significantly lower levels of air permeability than the default value of 15 m3/(h.m2) @ 50 Pa contained within the NCC Energy Efficiency Calculator, suggesting that this default figure may be too high.
It is also clear from Table 4 that there is significant difference between the two different metrics used to measure the airtightness of the test caravans, namely air permeability (based on exposed envelope area) and air leakage rate (based on internal volume). In all cases, the air leakage rate is more 50% greater than the air permeability figure. The reason for this is that the air permeability metric favours those buildings that have a high surface to volume ratio. In other words, for tall or long, narrow buildings, a large difference will exist between the air permeability and air leakage rate metrics, with the air permeability being the smaller metric of the two. In contrast, for a near cubic building, the difference between these two metrics will be negligible. As holiday homes generally have a long, narrow form (a high surface to volume ratio), much lower figures will be obtained using the air permeability as opposed to the air leakage rate metric.
5.1.2 Leakage identification
of air leakage were detected during depressurisation using thermal imaging. Thermal imaging was used as it not only highlights areas of direct infiltration, but can also indicate areas of indirect air leakage, such as air leakage through and between layers and voids in the construction. The main areas of direct air leakage identified within the caravans were where the services penetrated through the floor, wall or roof, such as at waste pipes, water pipes, central heating system pipes and at the gas entry point. As the majority of these penetrations are located beneath the kitchen cupboards, or beneath/behind sanitary fittings, in the main they are either hidden or obscured from view. In addition, direct and indirect leakage was also identified at the interfaces between different elements, such as the external wall/ground floor junction, the external wall corners, the external wall/roof junction and around door and window frames.
5.2 CO2 tracer gas decay measurements
The average air change rates obtained for each of the test periods in which CO2 tracer gas decay measurements were undertaken are summarised within Table 5. The results illustrate that a wide range of background ventilation rates (expressed in volumetric air changes per hour (ach-1)) were experienced for the test caravans over the electric coheating test period, ranging from as low as 0.24 ach-1 for caravan C to as high as 0.79 ach-1 for caravan D. As the external wind conditions varied significantly over the testing period, the nightly mean background ventilation rate obtained from the decay measurements has also been compared against the average wind speed recorded over the same time period (see Figure 2). This analysis indicates that for all of the test caravans, changes in the background ventilation rate appear to be generally consistent with changes in daily average wind speed, with the highest ventilation rates corresponding with the highest wind speeds. The average wind speed measured over the testing period was just over 5.0 ms-1, which is comparable with the figure contained within Appendix U of SAP(33) for February relating to the North East of England (5.2 ms-1).
[insert Figure 2.]
Sherman(35)) and was based upon a large number of results obtained from dwellings in North American in the late 1980’s. Therefore, it is not known whether the devisor of ‘20’ is directly applicable to dwellings constructed in a different country, such as the UK. Secondly, this ‘rule of thumb’ was originally applied to air changes per hour (ach-1 @ 50 Pa, rather than permeability in m3/(h.m2) @ 50 Pa, thus taking better account of the dwellings’ geometry. The consequence of applying this divisor to air permeability, rather than air leakage, is that it favours those dwellings that have a high surface to volume ratio. In other words, for dwellings of similar volume and similar overall levels of airtightness, a much lower background ventilation rate is attributed to narrower, taller dwellings than to a more cubic building. As the average dwelling in the UK is a two storey 3 bedroom semi-detached property, which is nearly cubic in form, the difference between using Q50/20 or n50/20 is marginal. However, in the case of the test caravans, which have a very long and narrow built form, the difference between using Q50/20 or n50/20 to approximate the average annual background ventilation rate is likely to be significant. The scale of this difference is illustrated in Table 5, and is significant, with the n50 values being consistently higher than those obtained using the Q50 ‘rule of thumb’. This illustrates the existence of a potentially significant prediction gap. The comparison also reveals that for three of the four test caravans (B, C and E), the ventilation rates approximated using the n50/20 ‘rule of thumb’ are greater than those measured from the CO2 tracer gas decay. This suggests that the devisor of 20 may be too small. To be able to determine a more appropriate figure, the tracer gas decay and measured air leakage rates for each test caravan have been used to obtain a ‘rule of thumb’ devisor (see Table 6). The results contained within Table 6 suggest a range a devisors for the test caravans ranging from 18 to 35, with a mean of 25. The mean of 25 is 25% greater than the devisor that is currently contained within the latest version of the NCC Energy Efficiency Rating Calculator relating to Q50, suggesting that the devisor incorporated within this calculator is too low. It is also much lower than the devisor of 40 derived by Miles-Shenton, Farmer and Johnston(22) from measurements of two previously tested holiday homes.
5.3 Electric coheating tests
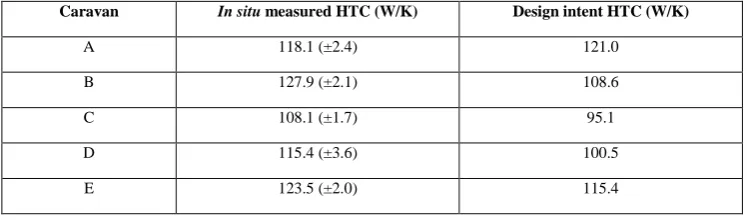
The electric coheating test results for all five test caravans are illustrated in Figure 3 and Table 7.For comparative purposes, the in situ measured Heat Transfer Coefficient (HTC) obtained from the electric coheating tests has also been compared against the design intent steady state HTC. The design intent HTC has been obtained directly from the NCC Energy Efficiency Calculator. Consequently, the background ventilation rate incorporated within these calculations is based upon the design intent air permeability figure (see Table 4).
It is clear from Figure 3 and Table 7 that a range of performance exists between all of the tested caravans, with the in situ measured HTC ranging from 108 W/K to just under 128 W/K. To add context to these figures, this magnitude of HTC is approximately equivalent to that recently measured in two 90m2 three bedroom two storey semi-detached masonry cavity dwellings (115.2 and 126.6 W/K), both of which were built to Code for Sustainable Homes (CSH) Level 5(36) and have a floor area almost three times that of the holiday homes.Table 7 also illustrates that the highest HTC was achieved in caravan B. This is despite the fact that caravan A is much larger and has a much greater heat loss area than caravan B.
It is also apparent from Table 7 and Figure 3 that, in the majority of cases, the in situ measured HTC is greater than the design intent HTC, indicating a building fabric thermal ‘performance gap’. The only instance where this is not the case is in caravan A, where the in situ measured HTC is comparable to the design intent HTC. However, undertaking such a comparison can be misleading, as although the design intent HTC figure does take into account repeating thermal bridges when calculating the building fabric plane element U-values, it does not take into account non-repeating thermal bridges when calculating the total building fabric heat loss. The design intent HTC figure also incorporates background ventilation heat losses which have been approximated based upon the air permeability figures incorporated with the NCC Energy Efficiency Calculator, rather than those measured in situ. In all of the tested caravans, a difference was observed between the air permeability figures measured in situ and those contained within the NCC calculator and, in some cases, this difference was considerable. Furthermore, the background ventilation rate of each caravan has been approximated using the Q50/20 ‘rule of thumb’, which is unlikely to be appropriate for the test caravans.
A more appropriate comparison would be to compare the in situ measurements with a predicted HTC, where the predicted HTC is derived from the in situ measured air leakage rate for each caravan (n50) and the background ventilation rate that has been approximated using the average devisor obtained during the CO2 tracer gas decay measurements; in this case 25. The result of this analysis is illustrated in Figure 4. This comparison shows that the measured HTC is much greater than the predicted HTC for test caravans B and C (28.2 and 24.5 W/K, respectively). For caravans A, D and E the difference between the measured and predicted HTC is marginal (0.4, 3.0 and 2.1 W/K respectively). However, it should be noted that test caravan A is larger than all of the other test caravans and was not subject to any CO2 tracer gas decay measurements. Therefore, it may be that the devisor of 25 is not appropriate for this test caravan.
As previously discussed in the introduction, there is a distinct lack of empirical evidence available on the in situ performance of holiday or park homes, particularly the aggregate performance of the building fabric. Therefore, in order to be able to determine whether the scale of the performance gap measured for the test caravans is comparable to that measured within other sectors, the electric coheating test results have been compared against the new build dwellings data that are contained within one of the largest and most comprehensive databases of electric coheating data currently available in the UK, the Leeds Beckett Coheating Database. The results of this comparison are illustrated in Figure 5 and Figure 6. This database contains the results obtained from 27 new build dwellings, all of which were originally designed to meet, or in some cases significantly exceed, the building fabric thermal performance requirements contained within Part L1A of the UK Building Regulations 2006. Whilst the sample size reported here is very small, highlighting the practical difficulties associated with obtaining aggregate whole dwelling performance data on dwellings in the UK, the results suggest that in percentage terms, the average difference between the in situ measured and the predicted HTC for the new build dwellings is 44% (in absolute terms 44 W/K), compared to only 13% (in absolute terms 12 W/K) for the test caravans.This suggests that, based upon the limited amount of empirical data available, the building fabric performance gap associated with holiday homes appears to be narrower than that documented for new build UK housing. Part of the reason for this may be attributable to the fact that the holiday homes are constructed within a process controlled factory environment.
[insert Figure 5.]
[insert Figure 6.]
6.0 Conclusions
possible reasons why this performance gap is much smaller for the holiday homes may be attributable to the fact that these homes are mass produced within a process controlled factory environment.
Another important key finding that has emerged from this study relates to the way in which the design intent performance of the holiday homes is currently determined. In terms of the building fabric heat losses, although the current version of the NCC Calculator does account for the additional heat loss attributable to repeating thermal bridges, it does not account for the additional heat loss attributable to non-repeating thermal bridges, unlikeSAP which is used for energy rating dwellings(33). In SAP, non-repeating thermal bridges are accounted for either by adopting Accredited Construction Details(37), numerical modelling, using individual default values or using an aggregate default value. It is suggested that in any future revisions to the NCC Energy Efficiency Calculator, an aggregate default value or a series of accredited construction details are devised to account for non-repeating thermal bridges. With respect to the air pressure tests, the results revealed that all of the holiday homes achieved measured air permeability figures that were significantly different to the figures that were used within the NCC Energy Efficiency Calculator to predict their design intent building fabric thermal performance. In addition, the CO2 tracer gas decay measurements revealed that the current devisor of 20 that is incorporated within the NCC Energy Efficiency Calculator to approximate the average annual background ventilation rate is likely to be too low. Instead, the decay measurements revealed that the average devisor for the holiday homes is more likely to be around 25, some 25% greater than the devisor that is currently contained within the NCC Energy Efficiency Calculator.Further air pressure tests and CO2 tracer gas decay measurements should be undertaken to determine the range of devisors that are likely to be applicable to various geometries of holiday homes. Furthermore, the devisor that is currently incorporated within the calculator also relates to air permeability (Q50), rather than air leakage rate (n50) from which the ‘rule of thumb’ devisor was originally devised. In terms of the holiday homes, this is important, as the air pressure test results revealed that the difference between the n50 and Q50 value can be significant due to the holiday homes form factor (high surface area to volume ratio). These results suggest that the scale of the ‘performance gap’ that has been measured by the electric coheating tests may, in part, be more a consequence of the way in which the design intent of these homes has been determined, i.e. a ‘prediction gap’, rather than a reflection of an actual ‘gap’ between assumed and realised in situ performance.
References
1 Stafford, A. Bell, M. and Gorse, C. Building confidence - A working paper. Centre for Low Carbon Futures Report No. 008, March 2012 [Internet]. York, The Centre for Low Carbon Futures. Available from: < http://www.lowcarbonfutures.org/reports/research-reports?page=1> [Accessed:24th March 2014]
2 Thomsen, K. E. Schultz, J.M. Poel, B. Measured performance of 12 demonstration projects - IEA Task 13 "Advanced solar low energy buildings". Energy and Buildings. 2005, Volume 37, Issue 2, pp 111-119.
3 Zero Carbon Hub. Closing the gap between design and as-built performance: Evidence review report, March 2014. [Internet] London, Zero Carbon Hub, Available from: <
http://www.zerocarbonhub.org/sites/default/files/resources/reports/Design_vs_As_Built_Performance_Gap_End
_of_Term_Report_0.pdf> [Accessed: 21st July 2016].
4 Zero Carbon Hub. Carbon compliance for tomorrow’s new homes: A review of the modelling tool and assumptions. Topic 4: Closing the gap between designed and built performance. August 2010. [Internet] London,
Zero Carbon Hub, Available from: <
http://www.zerocarbonhub.org/sites/default/files/resources/reports/Carbon_Compliance_Topic%204_Closing_t
he_Gap_Between_DvAB.pdf > [Accessed: 21st July 2016].
5 Johnston, D. Miles-Shenton, D. and Farmer, D. (2015) Quantifying the domestic building fabric ‘performance gap’. Building Services Engineering Research & Technology (BSER&T). 2015, Volume 36, No.5, September 2015, pp.614–627. DOI:10.1177/014362441557034.
6 DCLG. Mobile Homes Act 2013: A best practice guide for local authorities on enforcement of the new site licensing regime. March 2015, London, Department for Communities and Local Government, 2015.
7 DECC. Call for evidence on energy issues affecting park homes. 22 July 2014, URN 14D/275. London, Department of Energy & Climate Change, 2014.
9 Office for National Statistics. Statistical bulletin: Families and households: 2015. Trends in living arrangements including families (with and without dependent children), people living alone and people in shared accommodation, broken down by size and type of household. 5th November 2015. [Internet] London, Office for
National Statistics. Available from:
http://www.ons.gov.uk/peoplepopulationandcommunity/birthsdeathsandmarriages/families/bulletins/familiesand
households/2015-11-05 [Accessed: 12th July 2016].
10 NCC. Market brief: Holiday homes. Issue 70, December 2015. Aldershot, National Caravan Council, 2015.
11 Energy Saving Trust. Our calculations: Fuel prices and carbon intensity, 2016 [Internet] London, Energy Saving Trust. Available from: http://www.energysavingtrust.org.uk/about-us/our-calculations. [Accessed: 8th July 2016].
12 BSI. BS EN 1647:2012 Leisure accommodation vehicles – Caravan holiday homes – Habitation requirements relating to health and safety. July 2012. London, British Standards Institution, 2012.
13 BSI. BS EN 1647:2004 + A1:2008 Incorporating Amendment Nos. 1 and 2. Leisure accommodation vehicles – Caravan holiday homes – Habitation requirements relating to health and safety. July 2008. London, British Standards Institution, 2008.
14 BSI. BS EN 1647:1999 Incorporating Amendment Nos. 1 and 2. Leisure accommodation vehicles – Caravan holiday homes – Habitation requirements relating to health and safety. May 2002. London, British Standards Institution, 2002.
15 BSI. BS 3632:2015 Residential park homes – Specification. November 2015. London, British Standards Institution, 2015.
16 BSI. BS 3632:1970 Specification for permanent residential caravans. London, British Standards Institution, 1970.
17 BSI. BS 3632:1981 Specification for mobile homes. London, British Standards Institution, 1981.
18 BSI. BS 3632:1995 Specification for residential park homes. London, British Standards Institution, 1995.
20 NBS. The Building Regulations 2010 Approved Document L1A: Conservation of fuel and power in new dwellings. 2013 Edition. London, NBS, 2013.
21 Community Energy Plus. Cornwall park home insulation scheme 2013-2014. [Internet] Truro, Community Energy Plus. Available from: https://cep.org.uk/wp-content/uploads/2015/12/8W11252-Park-Home-Insulation-Project-Report-web.pdf. [Accessed: 7th October 2016].
22Miles-Shenton, D. Farmer, D. and Johnston, D. Investigation into the In Situ Thermal Performance of 2 Static Caravans - Assessing the Change in Heat Loss Behaviour due to Thermally Superior Replacement Windows. 2015 [Internet]. Leeds, Leeds Sustainability Institute, Leeds Metropolitan University. Available from: <
http://eprints.leedsbeckett.ac.uk/1810/ > [Accessed: 27th September 2016].
23 Tietsma, G.J. and Peavy, B.A. The thermal performance of a two-bedroom mobile home. NBS Building Science Series 102. Washington DC, USA, National Bureau of Standards, 1978.
24 Alba Building Sciences. CERT Demonstration action insulation improvements to residential park homes. Scheme Ref: SSEN09132, Alba Report 21050, June 2011. Perth, UK, Alba Building Sciences Ltd, 2011.
25 Johnston, D. Farmer, D. and Miles-Shenton, D. Bourne Leisure Ltd. Thermal Performance Measurement Report. Centre for the Built Environment, Leeds Sustainability Institute, May 2016. Leeds, UK, Leeds Beckett University, 2016.
26 ATTMA. ATTMA Technical Standard L1. Measuring the Air Permeability of Building Envelopes
(Dwellings). October 2010 Issue. Northampton, UK, Air Tightness Testing and Measurement Association, 2010.
27 BSI. BS EN ISO 9972:2015. Thermal performance of buildings — Determination of air permeability of buildings - Fan pressurization method. British Standards Institution, London, 2015.
28 CIBSE. Testing buildings for air leakage: CIBSE Technical Memoranda TM23: 2000. London, The Chartered Institute of Building Services Engineers, 2000.
30 Stavova (Barankova), P. Melikov, A.K. Sundell, J. and Naydenov, K.G. A New Approach for Ventilation Measurement in Homes Based on CO2 Produced by People – Laboratory Study. In Proceedings of the 17th Air Conditioning and Ventilation Conference, 2006, Prague 2006, pp. 291-296.
31 Bauwens, G. Standaert, P. Delcuve, F. and Roels, S. Reliabilty of co-heating measurements. In Proceedings of BSO12: IBPSA-England First Building Simulation and Optimisation Conference 2012 (BSO12), 10-11th September 2012, Loughborough, UK, pp. 348-355.
32 Wingfield, J. Johnston, D. Miles-Shenton, D. and Bell, M. Whole house heat loss test method (Coheating). 2010 [Internet]. 2010, Leeds, Leeds Metropolitan University. Available from: <
http://www.leedsbeckett.ac.uk/as/cebe/projects/coheating_test_protocol.pdf > [Accessed 9th September 2016].
33 BRE. SAP 2012: The Government’s Standard Assessment Procedure for Energy Rating of Dwellings. 2012 Edition. Garston, Watford, Building Research Establishment, 2014.
34 NCC. NCC Energy Rating Calculator. 2016 [Internet]. Aldershot, National Caravan Council (NCC). Available from: < http://www.thencc.org.uk/energy-rating-calculator.aspx > [Accessed on: 21st July 2016].
35 Sherman, M. Estimation of Infiltration for Leakage and Climate Indicators. Energy and Buildings, 1987, 10 pp. 81-86.
36 Johnston, D. and Fletcher, M. Innovate UK, Building Performance Evaluation - Lea Field Court, York - Final Report, Domestic Buildings, Phase 1: Post construction and early occupation. 2014 [Internet]. UK, Building Data
Exchange, Digital Catapult. Available from: <
https://buildingdataexchange.org.uk/report/Lea+Field+Court%2C+York/868/ >
[
Accessed on: 16th September 2016].37 Planning Portal. Part L- Conservation of fuel and power. Accredited Construction Details. 2016 [Internet]. UK,
Planning Portal. Available from: <
Figure 1 Orientation of the test caravans on-site.
Figure 2 Relationship between nightly mean background ventilation rate and average wind speed for each test.
Figure 3 Comparison of the electric coheating test results with the design intent HTCs.
Figure 4 Comparison of the electric coheating test results with the predicted HTCs using measured n50/25.
[image:20.595.74.521.546.684.2]Figure 5 Measured HTC versus steady-state predicted HTC of the test caravans and the Leeds Beckett new-build coheating database.
[image:20.595.77.525.547.682.2]Figure 6 Difference in the measured versus steady-state predicted HTCs of the test caravans and the Leeds Beckett new-build coheating database.
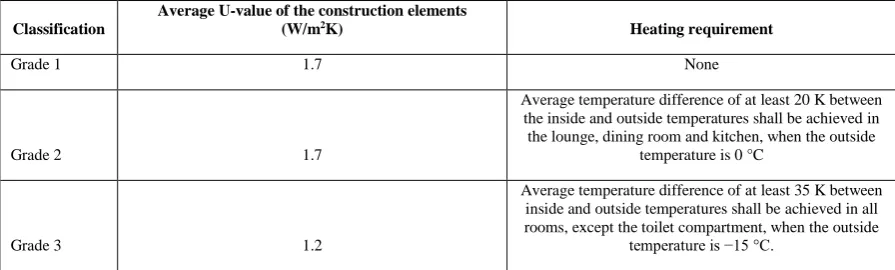
Table 1 Classification of thermal insulation and heating for holiday homes according to BS EN 1647:2012.
Classification
Average U-value of the construction elements
(W/m2K) Heating requirement
Grade 1 1.7 None
Grade 2 1.7
Average temperature difference of at least 20 K between the inside and outside temperatures shall be achieved in the lounge, dining room and kitchen, when the outside
temperature is 0 °C
Grade 3 1.2
Average temperature difference of at least 35 K between inside and outside temperatures shall be achieved in all rooms, except the toilet compartment, when the outside
Table 2 Maximum average U-values according to BS EN 3632 (for park homes) and Part L1A of the Building Regulations 2013 Edition (for new dwellings).
Standard
Maximum average U-value of the construction elements (W/m2K)
External wall Floor Roof Windows & doors
BS 3632:1970 1.70 1.70 1.70 -
BS 3632:1981 1.00 1.00 0.60
Overall external wall U-value (including windows and doors) 1.8
BS 3632:1989 1.00 1.00 0.60
Overall external wall U-value (including windows and doors) 1.8
BS 3632:1995 0.60 0.60 0.35
Overall external wall U-value (including windows and doors) 1.0
BS 3632:2005 0.50 0.50 0.30 2.00
BS 3632:2015 0.35 0.35 0.20 1.60 (including frames)
[image:21.595.75.408.381.491.2]Part L1A 2010 0.30 0.25 0.20 2.00
Table 3 Dimensions of the case study caravans.
Caravan External caravan size (ft) Internal volume (m3)
A 40 x 14 99.1
B 35 x 12 81.2
C 35 x 12 84.1
D 35 x 12 87.3
E 35 x 12 84.4
Table 4 Air pressure test results for the test caravans (all gas drop-out points and purpose provided ventilation openings sealed).
Caravan
Measured Design
Mean air permeability (m3/(h.m2) @ 50Pa)
Mean air leakage rate (ach-1 @ 50Pa)
Air permeability (m3/(h.m2) @ 50Pa)
Back calculated air leakage rate (ach-1 @
50Pa)
A 7.7 11.8 11.5* 17.7
B 6.3 10.4 15.0 25.0
C 5.2 8.4 15.0 24.3
D 9.1 14.2 3.0* 4.7
E 7.9 12.9 6.0* 9.8
[image:21.595.77.525.576.720.2]Table 5 Summary of the approximated background ventilation rates.
Background ventilation rate (ach-1)
Caravan Measured in situ Approximated using Q50/20 Approximated using n50/20
B 0.40 0.32 0.52
C 0.24 0.26 0.42
D 0.79 0.46 0.71
[image:22.595.74.287.276.387.2]E 0.61 0.40 0.64
Table 6 ‘Rule of thumb’ devisor based upon tracer gas decay measurements.
Caravan ‘Rule of thumb’ devisor
B 25.8
C 34.9
D 17.9
E 21.2
Average 25.0
Table 7 Summary of the electric coheating test results.
Caravan In situ measured HTC (W/K) Design intent HTC (W/K)
A 118.1 (±2.4) 121.0
B 127.9 (±2.1) 108.6
C 108.1 (±1.7) 95.1
D 115.4 (±3.6) 100.5
[image:22.595.76.450.450.560.2]