GE-International Journal of Management Research
Vol. 4, Issue 4, April 2016 IF- 4.88 ISSN: (2321-1709)© Associated Asia Research Foundation (AARF)
Website: www.aarf.asia Email : [email protected] , [email protected]CAPITAL STRUCTURE ANALYSIS AND ITS IMPACT ON EPS: A
STUDY ON TOP TEN IT COMPANIES IN INDIA
Rahul Sarkar
Lecturer: Seth Anandaram Jaipuria College_University of Calcutta
ABSTRACT
The main objective of this paper has been to analyse and understand the impact of capital
structure practices on profitability of top ten Information Technology (IT) companies in India.
This paper investigates the relationship between Capital Structure Ratios (Equity Ratio, Long
Term Debt Ratio, and Leverage Ratio) and Profitability Measures (Earning Per Share, Return on
Equity) for a period from 2011 to 2015. Descriptive Statistics have been used to throw light on
the basic features of the data in Sample. From Descriptive Statistics it is found that IT industry in
India is Equity Oriented. Correlation and Regression analysis have been performed to show the
relationship between Response (Dependent) variables and Independent Variables. The results of
both Correlation and Regression analysis have supported Equity Orientation of IT industry by
showing positive association between Equity Ratio and EPS.
KEY WORDS: Capital Structure, Leverage, Profitability, Earning Per Share, Return on
Equity.
I. INTRODUCTION
The corporate finance pattern is of vital importance for financial well-being of companies
(Mishra, 2011). The Finance Manager of a company is to find solution of three major
decision problems of financial operations of a firm, viz. Financing Decision, Investment
Decision and Dividend Decisions. Of these three decisions the foremost decision is the choice
of appropriate Debt-Equity mix with due concern for financial risk factor for capital structure
Capital structure refers to composition of capitalization i.e. the proportion between debt and
equity which makes up firms‟ capitalization. Pattern of Capital Structure can be consist of:
Capital Structure with equity shares only.
Capital Structure with equity and preference.
Capital Structure with equity and debentures.
Capital Structure with equity, preference shares and debentures.
These financing pattern decision of Capital Structure is not a static one rather it is a
continuous process.
In India, capital structure patterns are peculiar to specific industries. They vary from industry
to industry but follows a homogenous pattern in the same Industry. For example, Utilities,
transportation companies and capital-intensive manufacturing firms have high debt- equity
ratios as compared to service firms, mining companies and technology – based manufacturing
firms which employ very little long-term debt. (Kapil, 2011).
The modern theory of capital structure began with the introduction of irrelevance theory of
Modigliani and Miller (1958), which argues that Debt-Equity mix do not affect Firms‟ value,
and optimum Capital Structure do not exist. The three conflicting theories of capital structure,
such as Agency Cost Theory (Jensen and Meckling, 1976), Trade-off Theory (Bradley et al.,
1984), and Pecking Order Theory (Myers and Majluf, 1984) have been developed after the establishment of Modigliani and Miller‟s theory. The basic underlying concept of these three
theories differ from that of Modigliani-Miller theory, where they argue Capital structure
affects Cost of capital, Net profit, Earning per Share, Dividend pay-out Ratio, and liquidity
position of the firm. All of these in turn affect market value of the firm and these variables
coupled with a number of other factors determine the value of the firm. Therefore, capital
Structure Decision is a very important to the value of the firm and Optimum Capital Structure
do exist.
In this study attempts have been made to study the capital structure and its impact on the EPS
of Top 10 Information Technology companies for a period of five years from 2011 to 2015.
II. LITERATURE REVIEW
The Risk-Return trade-off theory argues that firms trade off the costs of debt & equity
financing and benefits received by employing those funds in profitable investment projects
and reach to an optimal capital structure even with the market imperfections such as taxes,
because after that the profitability and the value of the firm will decrease due to interaction of
bankruptcy costs and agency costs.
Myers and Majluf (1984): In contrast to trade-off theory, they introduced the Pecking order
theory which states that optimal capital structure does not exist. They argued that to minimize the problem of asymmetric information between firms‟ managers and outside investors,
financial pecking order; i.e. a hierarchy of financing that begins with retained earnings, which
is followed by debt, and finally new stock issues takes place as “last resort”.
Kaur, Jatinder (2007): Following „Pecking Order Theory‟, she, in her study focused on the
preferred hierarchy among debt and equity by the corporates and differences in capital
structure practices followed by private sector undertakings. She studied the Magnitudes of
short term debt, long term debt and major changes in capital structure practices of private
corporate companies in view of economic LPG Scenario in India using data of top 25
companies. It was found from the study that since the early 1990s significant structural
changes in Indian capital market, in particular in equity market have accelerated Indian firms‟
flexibility in choosing their capital structure optimally
A.M. Goya 2013: This paper attempts to study the impact of capital structure on profitability
of public sector banks in India listed on National Stock Exchange during 2008 to 2012. For
the Analysis of capital structure-profitability association Regression Analysis has been used
for establishing relationship between Return on Equity, Return on Assets & EPS with capital
structure. Results reveal positive relationship of short term debt with profitability as
measured by ROE, ROA & EPS.
Margaritis and Psillaki (2010): They observed a significant positive correlation between leverage and firms‟ performance. They took a sample of both low and high growth French
firms for the period 2003-2005. The result showed that leverage have positive effect on firms‟ efficiency over the entire sample period.
Samuel (2013): He used panel data consisting of 257 South African firms for a period
ranging from 1998 to 2009, and investigated the association between capital structure and
firm performance. To test the relationship, he used GMM regression approach and found a
positive and significant relation between financial leverage and firm‟s performance.
Aliakbar, Seyed and Pejman (2013): They also found a significant positive association
Rajan and Zingales (1995): In contrast, a rigorous study was performed by them to
investigate the capital structure-profitability association of 48 firms from the U.S. during the
period 1981–1990. Result revealed that there is a negative association between debt-level and
profitability, and this relationship would be more visible if firm size gets bigger.
Fama and French (2002): A negative relation between capital structure and firm‟s
performance was also witnessed by them. They observed that firms with high profitability
and lower risk of financial distress are actually less levered which contradicts with the
trade-off theory.
III. Research Objective
In this study attempts have been made:
To identify and analyse the Capital Structure of IT Industry in India.
To analyse and interpret the impact of Capital Structure on EPS of IT Industry
in India.
IV. RESEARCH METHODOLOGY
To investigate the capital structure and its impact on EPS of IT sector companies in India, the
study adopted the methodology used in earlier research work on the issue. Analysis of data in
this research is proposed to be done through Descriptive Statistics, Correlation matrix and
Regression models.
4.1 Data and Sample: This research is essentially a quantitative research in which in which
published / secondary data is used. The data for the research is collected mainly from
Summary Financial Statements available in moneycontrol and ndtv and various other reliable
sources.
All those IT companies operating in India are the population of the study. Sample of
the study include top 10 Indian IT companies based on their market capitalisation. And the
4.2 Variables:
4.2.1 Equity Ratio: The equity ratio is an investment leverage or solvency ratio that measures the amount of assets that are financed by owners‟ investment and is calculated as
follows –
ER = Net Worth / Total Assets
4.2.2 Long Term Debt Ratio: LTDR measures the percentage of a corporation‟s assets that
are financed with loans and financial obligations lasting more than one year and is calculated
as follows-
LTDR = Long Term Debt / Total Assets
4.2.3 Leverage Ratio: Companies rely on a mixture of owners‟ equity and debt to finance
their operations. LR can be computed in various ways. In this research LR is calculated as
follows-
LR = Long Term Debt / Net Worth
4.2.4 Earnings per Share: EPS is the portion of a company‟s profit allocated to each outstanding shares of common stock. EPS serves as an indicator of a company‟s profitability
and is calculated as follow-
EPS = Earnings Available to Equity Shareholders / No. of outstanding Equity
Shares
4.2.5 Return on Equity: RoE is the amount of net income returned as a percentage of shareholders equity. It measures corporations‟ profitability by revealing how much profit a
company generates with the money shareholders have invested. It is expressed as a
percentage and is calculated as follows-
RoE = Net Income / Shareholders Equity Capital Structure
(Independent Variables)
Equity Ratio (ER)
Long Term Debt Ratio (LTDR)
Leverage ratio (LR)
Profitability Measures
(Dependent Variables)
Earnings Per Share (EPS)
4.3 Research Hypothesis: The following hypothesis are developed to know the relationship
between Capital structure characteristics and profitability measures:
H0 : There is no linear relationship between capital structure characteristics and EPS.
H1 : There is linear relationship between capital structure characteristics and EPS.
4.4 Model Specification: Two simple regression model one between ER and EPS, one
between LTDR and EPS and one multiple regression model among ER, LTDR and EPS is
used to find out association between Capital structure characteristics and EPS of IT
companies in India. The base model is as follows –
Yit = a + bXit + eit
Where: Yit is the dependent variable of ith company at period t
a is intercept
b is regression coefficient
Xit is the independent variable of ith company at period t
eit iserror term
4.4.1 Simple Regression Models:
EPSit = a + bERit + eit
EPSit= a + bLTDR + eit
4.4.2 Multiple Regression Model:
EPSit = a + b1ERit +b2LTDR + eit
4.5 Case Analysis: ER and LTDR Data of TCS has been taken to validate the results of
Statistical Analysis, as performed using Descriptive Statistics, Correlation and Regression
Analysis.
V. RESULT AND ANALYSIS
5.1Descriptive Statistics: This study conducted Descriptive statistics (Table 1) to describe
the basic features of the data in sample. The value of mean, standard deviation, maximum and
minimum values of independent variables ( ER, LTDR, LR ); dependent variables ( EPS,
RoE ) of sample of Top 10 Information Technology (IT) companies are calculated from
The profitability as measured by Return on Equity (RoE) & Earning per Share (EPS) reveals
an average of 27.09 percent and Rs. 58.30 respectively, which suggest good performance
during the period under study. Their respective standard deviations, which indicates how
large the spread of distribution is around the central value (mean) are 10.88 & 47.11.
Long Term Debt Ratio (LTDR) indicate the extent of company‟s assets financed by Long
Term Debt. The mean of LTDR is 0.0166 with standard deviation and minimum value being
0.0367 & 0 respectively. This indicate that the industry is less dependent on borrowed
capital.
As Equity Ratio (ER) shows the extent of company‟s assets financed by Equity Capital. The
average of ER is 0.6894 and standard deviation is 0.1092. The minimum & maximum values
of ER are 0.3701 & 0.856, which clearly indicates that the IT industry in India is more of
Equity Oriented.
5.2 Correlation Analysis: Table 2 shows the Correlation Matrix which tells us relationship
amongst variables in this Study. Correlation can also be defined as dependence of one
variable upon other(s).
RoE has negative correlation with all the three independent variables (ER, LTDR, and LR).
EPS has a positive correlation with Equity Ratio and their magnitude is moderate (0.3588),
but EPS has negative correlation with both LTDR and LR. This implies that an increase in
long term debt is associated with a decrease in Earning per Share. This is explained by the
fact that debts are relatively more expensive than equity and therefore employing higher
proportion of debt could lead to lower profitability in terms of EPS. This result contradicts
the theoretical foundation of Leverage Theory (Which says more the debt more will be the
EPS upto a certain level). Again this result suggest that profitable firms of IT industry in
India depends more on equity as their main financing option. So by the fact, it is well
justified the Equity Orientation of IT industry in India.
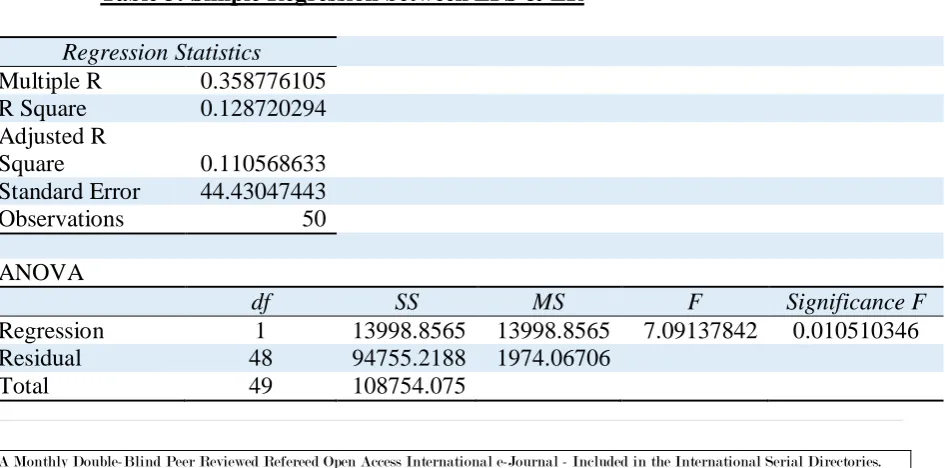
5.3 Regression Analysis: Table 3 represent Simple Regression result between Earning per
Share (EPS) and Equity Ratio (ER), where R Square (0.1287) indicates that 12.87% of
variation in EPS can be explained by ER, remaining 87.13% variance in EPS is related to
other variables. And the fitted line is EPS = - 45.4097 + 154.7835ER, Positive beta
coefficient of ER shows that with an increase in ER will cause EPS to increase. And this
Here calculated F value (7.0914) > critical F value (4.0426) at 5% level of significance. Here
Alternative hypothesis is accepted with 95% confidence level. So there exist a linear
relationship between EPS and ER.
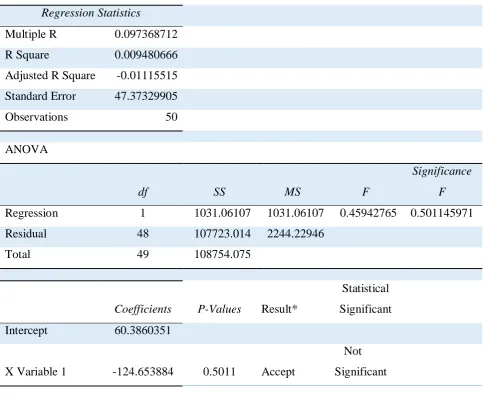
Table 4 represent Simple Regression result between Earning per Share (EPS) and Long Term
Debt Ratio (LTDR), where R Square (0.00948) indicates that 0.948% of variation in EPS can
be explained by LTDR only, remaining 99.052% variation in EPS is related to other
variables. And the fitted regression line is EPS = 60.3860 – 124.6538LTDR, Here a
negative beta coefficient of LTDR is observed that indicate a negative association between
EPS & LTDR and which once again supported Equity Orientation of IT industry in India, as
an increase in Debt would cause decrease in EPS is supported by the regression line.
Here calculated F value (0.4594) < critical F value (4.0426) at 5% level of significance.
Hence there do not exist a linear relationship between EPS & LTDR.
Table 5 presents Multiple Regression result among EPS and ER & LTDR. And the fitted
regression line is EPS = - 53.5656 + 161.0389ER + 50.6122LTDR The positive coefficient
of ER with a high magnitude, once again explained that an increase in Equity will bring an
increase in EPS and the result is statistically significant at 5% level of significance [ Since,
Pcal (0.0140) < 0.05 ].
It also shows when an optimum amount of debt is mixed with equity then coefficient of
LTDR becomes positive, which indicate an increase in LTDR is associated with an increase
in EPS. Though this result is not statistically significant either at 1% level of significance or
even at 5% level of significance.
CASE ANALYSIS: Equity Ratio and Long Term Debt Ratio of TCS is taken for 2011
and 2015 and the data are fitted in all the three industry regression equation to verify the
conformity of results.
2011: ER = 0.7533. LTDR= 0.0053
(1) Putting ER= 0.7533 in Regression Equation: EPS = - 48.4097 + 154.7835ER,
EPS = -48.4097 + 154.7835 * .7533 = 68.1887
(2) Putting LTDR = 0.0053 in Regression Equation: EPS = 60.3860 –
124.6538LTDR,
(3) Putting both ER= 0.7533 and LTDR= 0.0053 in Multiple Regression Equation:
EPS = - 53.5656 + 161.0389ER +50.6122LTDR,
EPS = -53.5656 +161.0389 * 0.7533 + 50.6122 * 0.0053 =71.0132
2015: ER =0.7236. LTDR = 0.0115
(1) Putting ER = 0.7236 in Regression Equation: EPS = - 48.4097 + 154.7836ER,
EPS = -48.4097 + 154.7835 * 0.7236 = 63.5916
(2) Putting LTDR = 0.0115 in Regression Equation: EPS = 60.3680 –
124.6538LTDR,
EPS = 60.3680 – 124.6538 * 0.0115 = 58.9344
(3) Putting both ER = 0.7236 and LTDR = 0.0115 in Multiple Regression
Equation: EPS = -53.5656 +161.0389 * 0.7236 + 50.6122 * 0.0115 = 63.5441
So from the above analysis it is clear that over the research period 2011-2015 TCS has
increased its Debt content in the Capital Structure substantially , as a result its EPS could
have been fall by Rs. 7.4732, had other variables remains same. So increase in Debt has a
negative impact on Earnings of the company.
VI. CONCLUSION
The endeavour was given throughout the study to give an empirical evidence reflecting
Capital Structure composition and its impact on profitability (in terms of EPS and RoE) of
Information Technology industry in India. In this study Descriptive Statistics, Correlation
Analysis and Regression Analysis were used. The test results clearly shows that IT industry
in India is Equity Oriented, that is they depends more on Equity than Debt to finance their
projects, though this contradict „Pecking Order Theory‟ of preferring Debt first to Equity.
However, it is found that there exist a positive correlation between EPS and ER, which
justifies their preference for Equity Financing over Debt financing. Finally a Case Analysis
have been performed to validate the results. The Case Analysis also shows a negative
The possible reason for negative association between EPS and Leverage Ratio of and
subsequently not capable of using cheap source fund i.e. debt by IT industry in India, can be
either-
Explained by the fact that in this industry debts are relatively more expensive than
that of equity and therefore high proportions of them could lead to low profitability.
Or,
As firms tries to minimise the overall risk , which is the product of Business Risk (
risk associated with Cost Structure ) and Financial Risk ( risk associated with Capital
Structure ) ; so in order to keep overall risk at a minimum acceptable level , the firms
with high business risk tends towards less financial risk. So instead of debt financing
they opt for equity financing.
Appendices
Table 1: Descriptive Statistics
Variables ER LTDR LR EPS ROE
Mean 0.689476 0.016656 0.030802 58.3098 27.0904 Standard Deviation 0.1092 0.0367992 0.067967 47.11126 10.88797
Minimum 0.3701 0 0 6.74 5.91
Maximum 0.856 0.1648 0.2994 178.22 49.62
[image:10.595.73.546.542.776.2]Count 50 50 50 50 50
Table 2: Correlation Matrix
ER LTDR LR
EPS 0.35887 -0.11843 -0.0851
ROE -0.0305 -0.04715 0.02555
Table 3: Simple Regression between EPS & ER
Regression Statistics
Multiple R 0.358776105
R Square 0.128720294
Adjusted R
Square 0.110568633
Standard Error 44.43047443
Observations 50
ANOVA
df SS MS F Significance F
Regression 1 13998.8565 13998.8565 7.09137842 0.010510346 Residual 48 94755.2188 1974.06706
Coefficients P-Values Result* Statistical Significant
Intercept
-48.40977224
[image:11.595.67.551.159.557.2]
X Variable 1 154.7835925 0.0105 Reject Significant
Table 4: Simple Regression between EPS & LTDR
Regression Statistics
Multiple R 0.097368712
R Square 0.009480666
Adjusted R Square -0.01115515
Standard Error 47.37329905
Observations 50
ANOVA
df SS MS F
Significance
F
Regression 1 1031.06107 1031.06107 0.45942765 0.501145971
Residual 48 107723.014 2244.22946
Total 49 108754.075
Coefficients P-Values
Result*
Statistical
Significant
Intercept 60.3860351
X Variable 1 -124.653884 0.5011
Accept
Not
Significant
Table 5: Multiple Regression Analysis
Regression Statistics
Multiple R 0.36065633
R Square 0.130072988
Adjusted R Square 0.093054817
Standard Error 44.86578276
Observations 50
ANOVA
df SS MS F Significance F
Regression 2 14145.9675 7072.98377 3.51376055 0.037830857
Residual 47 94608.1078 2012.93846
Total 49 108754.075
Coefficients
P-Values
Result * Statistical Significant
Intercept -53.56569882
X Variable 1 161.0389638 0.0140
Reject Significant
X Variable 2 50.6122833 0.7880
Accept Not Significant
Note: * = At 5% Lever of Significance.
Reference
A.M. Goyal (2013), “Impact of Capital Structure on Performance of Listed Public Sector Banks in India”, International Journal of Business and Management Invention,
Vol. 2, pp. 35-43.
Aloke Gupta and Debasish Sur (2013), “Business and Financial Risks in Hindustan Unilever Ltd.: An Empirical Analysis”, Asia-Pacific Finance and Accounting Review,
Vol.1, pp. 77-93.
Anup Chowdhury, Suman Paul Chowdhury, “Impact of Capital Structure on Firm‟s Value: Evidence From Bangladesh”, BEH-Business and Economic Horizons, Vol.3,
pp. 111-122.
Ashok Kumar Panigrahi (2010), “Capital Structure of Indian Corporate: Changing Trends”, Asian Journal of Management Research, pp. 283-298.
DR. Sukhdev Singh; Rajni Luthara (2013), “A Comparative Study of Trends in Corporate Capital Structure Pattern of Refinery and Metal Industry”, Asia Pacific
Journal of Marketing and Management Review, Vol. 2 (6), pp. 11-21.
Fama, F.E. & French, K.R. (2005) Financing decisions: who issues stock? Journal of
financial economics. 76, 549‐582.
I M Pandey, “Financial Management”, 10 edition by Vikash publishing house Pvt.
Margaritis, D., & Psillaki, M. (2010). Capital structure, equity ownership and firm
performance. Journal of Banking & Finance, 34(3), 621–632.
Modigliani, F. & Miller, M. (1958). The cost of capital, corporation finance and the
theory of investment. The American Economic Review, 48: 261-297.
Myers, S. & Majluf. (1984). Corporate financing and investment decisions when
firms have information that investors do not have. Journal of Financial
Economics,13(2): 187-221.
N.Sivathaasan and S.Rathika (2013), “Capital Structure and EPS: A Study on
Selected Financial Institutions Listed on Colombo Stock Exchange (CSE) in Sri
Lanka”, European Journal of Business and Management, Vol.5, pp. 69-73.
Nilesh P. Movalia(2015), “A Study on Capital Structure Analysis and Profitability of
Indian Tyre Industry”, Pacific Business Review International, Vol.8, pp. 78-82.
Rajan, R. G., & Zingales, L. (1995). “What do we know about capital structure? Some
evidence from international data. Journal of Finance,” 50(5), pp. 1421–1460.
William R. Cline (2015), “Testing the Modigliani-Miller Theorem of Capital Structure Irrelevance for Banks”, Peterson Institute for International Economics.
https://en.m.wikipedia.org/wiki/List_of_Indian_IT_companies
https://www.ndtv.com/business