International Research Journal of Mathematics, Engineering and IT Vol. 3, Issue 7, July 2016 IF- 3.563 ISSN: (2349-0322)
© Associated Asia Research Foundation (AARF)
Website: www.aarf.asiaEmail : [email protected] , [email protected]
TWO STAGE LIU REGRESSION ESTIMATOR
Issam Dawoud1 and Selahattin Kaçıranlar1
1
Department of Statistics, Faculty Science and Letters, Çukurova University, Adana, Turkey.
ABSTRACT
This paper introduces a new estimator for multicollinearity and autocorrelated errors. We
propose the Two Stages Liu estimator (TL) for the multiple linear regression model which suffers
from autocorrelation AR(1) and multicollinearity problems. We use a mixed method to apply the
two stages least squares procedure (TS) for deriving the TL estimator. Furthermore, a Monte
Carlo study and a real data are carried out to investigate the performance of the proposed
estimator over the others.
Keywords: Two Stages Estimator; Multicollinearity; Matrix Mean Square Error; Autocorrelated
Errors; General Linear Models
1. Introduction
Consider a multiple linear regression model of the form
) , 0 ( ~
, 2 n
X
Y (1)
where Y is an n ×1 vector of observations on the dependent variable, X is an n × p known design matrix of rank p, is an p × 1 vector of unknown parameters, and is an n × 1 vector of random errors with zero mean and variance 2n , where n is an identity matrix of order n.
ˆ (X'X)1X'Y. (2)
Both the OLS estimator and its covariance matrix heavily depend on the characteristics of the
X
X' matrix. If X'X is ill-conditioned, i.e. the column vectors of X are linearly dependent, the OLS estimators are sensitive to a number of errors. For example, some of the regression coefficients may be statistically insignificant or have the wrong sign, and they may result in wide confidence intervals for individual parameters. With ill conditioned X'X matrix, it is difficult to make valid statistical inferences about the regression parameters. One of the most popular estimator dealing with multicollinearity is the ordinary ridge regression (ORR) estimator proposed by Hoerl and Kennard (1970a) and is defined as
ˆk (X'X kp)1X'Y (p k(X'X)1)1ˆ, (3)
where the constant k 0 is known as the biasing parameter.
Another biased estimator is Stein (SLS) estimator which is given as (see, Stein (1956), James and Stein (1961)):
ˆ c ˆ
s , (4)
which it is a linear function of c and 0c1, where ) ˆ ' ˆ
) ˆ (
)' ˆ (
1 (
X X
X Y X Y n a c
and a0
is the shrinkage factor.
The Liu estimator (LE) is defined, see for example Liu (1993), Akdeniz and Kaçıranlar (1995) and Kaçıranlar et. al. (1999), as follows
ˆ ( ' ) 1( ' ˆ) ( ' ) 1( ' )ˆ
p p
p
d X X X Y d X X X X d
(5)
The advantage of the LE estimator over the ORR estimator is that the LE estimator is a linear function of d, so it is easy to choose d than to choose k in the ORR estimator.
Since the matrix X'X is symmetric, it exists an orthogonal matrix U [U1,U2,...,Up], such that U'(X'X)U diag(1,2,...,p), where the i is the i
th
eigenvalue of X'X , and the columns of U are normalized eigenvectors associated with eigenvalues. Thus, the model
X
Y can be written in the canonical form as:
Y Z , (6)
where Z XU and U'. The OLS, ORR, SLS and LE estimators for (6) are respectively given as:
ˆ ) (
) (
ˆ
ˆ ˆ
ˆ ) (
ˆ
' ˆ
1 1 1
p p
d S
p k
d c
k Y Z
. (7)
Let us consider the multiple linear regression model
) , 0 ( ~
, 2V X
Y . (8)
Aitken (1935) derived the generalized least squares (GLS) estimator as:
GLS X V X X V Y 1 1 1
' ) ' (
ˆ
, (9)
where V is a known positive definite (p.d.) matrix .
GRR X V X k p X V Y 1 1 1 ' ) ' (
ˆ
. (10)
He concluded that the Ridge Regression estimators which take the autocorrelation into account can perform better than the other methods when V matrix is known.
Stein (1975) proposed the Generalized Stein (GS) estimator of in the general linear regression model as:
GLS GS f
ˆ ˆ , (11)
which it is a linear function of 0 f 1, where )
ˆ ' ˆ ) ˆ ( )' ˆ ( 1 ( 1 1 GLS GLS GLS GLS X V X X Y V X Y n a f .
Kaçıranlar (2003) combined the Liu estimator of Equation (5) with the GLS of Equation (9) to obtain the Generalized Liu estimator (GLE) which is defined as:
ˆGLE (X'V1X p)1(X'V1X dp)ˆGLS. (12)
So, the problem of multicollinearity has also been discussed when the violation of the assumption of the autocorrelation of errors is also faced by many researchers, see for example, Gosling et al. (1982), Firinguetti (1989), Bayhan and Bayhan (1998), Kaçıranlar (2003), Özkale (2008), Alheety and Kibria (2009), Güler and Kaçıranlar (2009), Şiray et al. (2014) and Özkale (2014).
Using the canonical form, The GLS, GRR, GS and GLE are respectively given as:
GLS p p GLE GLS GS GLS p GRR GLS d f k Y V X Q ˆ ) ( ) ( ˆ ˆ ˆ ˆ ) ( ˆ ˆ 1 1 1 1
where Q'(X'V1X)Qdiag(1,2,...,p), i is the ith eigenvalue of X'V1X.
In this paper, we introduce a new estimator which is called the Two Stages Liu estimator (TL) by mixing the Two Stages procedure (TS) with the LE estimator. So, we examine the multicollinearity and autocorrelation problems simultaneously, define the TL estimator in the linear regression model with AR(1) correlated errors, and find the characteristics of this estimator in Sect. 2. Then, in Sect. 3, some interesting transforms of the TL estimator will be discussed. Then, we give a simulation study in Sect. 4. Finally, we give an application of a real data in Sect. 5.
2. The Two Stages Liu Estimator (TL)
The model with first order autoregressive process AR(1) has the form:
n t
t t
t 1 , 2,3,...,
(14)
where is the autocorrelation parameter (coefficient) (||1), t is a normal distributed random variable, which satisfies
. ,
0
0 ,
) ( ), , 0 ( ~
2 2
else s if E
N t t s t
(15)
If V is an nn known p.d. symmetric matrix, the simplest solution to the estimated model (8) when plagued with the problems of multicollinearity and autocorrelation in errors, is the use of GLS as in (9), but V matrixis seldom known. If V matrix is unknown, it is common in practice to use the estimated matrix of V in order to find the estimated generalized least square estimator (EGLSE) or Two Stages method estimator that is more efficient than the GLSE.
Using the matrix P to transform the model in (8) yields
P P
PY X ,
which is equivalent to
Y* X **, (16)
where E(*)0 and Cov(*)2n. Therefore, the OLS estimator for the model (16) is:
* *' *) *' ( ˆ 1 Y X X X TS
(17)
where n Y Y Y Y Y 2 1 2 1 0 0 0 1 0 0 0 1 0 0 0 1 : * P 1 2 1 1 2 22 21 1 1 12 11 2 1 1 1 1 0 0 0 1 0 0 0 1 0 0 0 1 : * np n n p p X X X X X X X X X X X P
1 0 0 1 0 1 0 1 0 0 1 ' : 2 2 2 1 P P
V (18)
and Vˆ1 is the estimated matrix that is in (18) with replaced by ˆ .
A number of ˆ ’s alternatives have been used in the literature, Judge, et. al. (1985):
1. The sample correlation coefficient. In this case, the estimator is
n t t n t t t r 1 2 2 1 1 ˆ ˆ ˆ , (19)
where the disturbances (t's), because they are unobservable, have been replaced by the OLS residuals ˆt Yt Yˆt Yt xtˆ,t 1,2,...,n, where xt is the symbol of a (1p) vector containing the t-th observation on p predictors.
2. The Durbin-Watson Statistic. This statistic,
n t t n t t t d 1 2 2 2 1 ˆ ) ˆ ˆ ( . (20)
An estimator for that is approximately equal to r1, namely d 5 . 0 1 ˆ
. (21)
So, after estimated by ˆ , we can find Vˆ1. And then, the TS is given as (Prais and Winsten (1954)):
TS X V X X V Y 1 1 1 ˆ ' ) ˆ ' (
ˆ
. (22)
Eledum and Zahri (2013) proposed the TR estimator of in the general linear regression model as:
TR X V 1X k p 1X Vˆ 1Y ' ) ˆ
' (
ˆ
. (23)
Chaturvedi and Shukla (1990) proposed the Two Stages Stein (STS) estimator of in the general linear regression model as:
TS STS f
ˆ ˆˆ , (24)
which it is a linear function of fˆ and 0 fˆ 1, where ) ˆ ˆ ' ˆ ) ˆ ( ˆ )' ˆ ( 1 ( ˆ 1 1 TS TS TS TS X V X X Y V X Y n a f .
To estimate the linear model with both multicollinearity and autocorrelation AR(1) problems simultaneously, we propose the mixed estimator, which is developed by mixing Equation (5) with (22). Therefore, the TL estimator is
TS p p TS p p TS p p TL d X V X X V X d X X X X d X X X X ˆ ) ˆ ' ( ) ˆ ' ( ˆ ) ' ' ( ) ' ' ( ˆ ) * *' ( ) * *' ( ˆ 1 1 1 1 1 P P P
where 0d1 and Vˆ1 is the estimated V1 matrix which it is defined in (18).
In order to compare the performance of any estimator with others, a criterion for measuring the goodness of an estimator is required. For this purpose, the matrix mean square error (MMSE) criterion is used to measure the goodness of an estimator. We note that for any estimator ~ of
, its MMSE is defined as
) ~ ( ) ~ ( ) ~ ( ) ~ )( ~ ( ) ~
( E Cov Bias Bias
MSE (26)
and the scalar mean square error (mse) is obtained as follows )) ~ tr(MSE( ) ~ (
mse . (27)
3. Some Interesting Transforms of the TL Estimator
In this section, we use some properties of the symmetrical matrices to improve the results above by using the eigenvalues and the eigenvectors. Recall that X'Vˆ1X is a symmetric matrix (correlation form), therefore it exists an orthogonal matrix Q such that
ˆ ) ˆ ,..., ˆ , ˆ ( ) ˆ ' (
' 1 2
1 p diag Q X V X
Q , (28)
where ˆi is the i
th
eigenvalue of the matrix X'Vˆ1X , the columns of Q are normalized eigenvectors associated with the eigenvalues. Thus, Eledum and Zahri (2013) rewrote the TS estimator and the TR estimator respectively as follows:
, ˆ ' ˆ ˆ * * 1 ' 1 * * 1 Y X p i j j i Y X
TS Q Q r
Q Q r
(29)
* * 1 ' 1 * * 1 ) ˆ ( ' ) ˆ ( ˆ Y X p i j j i Y X p
TR Q k Q r
k Q Q r where rX*Y* is the correlation matrix between X* and Y*and Qj represents the jth column of the orthogonal matrix Q.
Thus, we can rewrite the STS estimator and the proposed TL estimator respectively as follows: * * 1 ' 1 * *
1 ˆ ˆ
' ˆ ˆ ˆ Y X p i j j i Y X
STS f Q Q r f
Q Q r
, (31)
* * 1 ' 1 1 * * 1 1 ˆ ) ˆ ( ) 1 ˆ ( ' ˆ ) ˆ ( ) ˆ ( ˆ Y X p i j j i i i Y X p p
TL Q d Q r
d Q Q r
. (32)
Using canonical form:
Y*Z**, (33)
where Z X *Q and *Q'. Thus, Eledum and Zahri (2013) rewrote the TS estimator and the TR estimator respectively as follows:
TS Z Z Z Y QX V Y 1 1
1
* ˆ ˆ
* ' ) ' (
ˆ
, (34)
TR k p X V Y C1Y
1 1 * ˆ ) ˆ (
ˆ
. (35)
The STS estimator rewrite as follows:
* * ˆ ˆ
ˆSTS fTS
. (36)
Thus, we can rewrite the proposed TL estimator as follows:
* 1 * ˆ ) ˆ ( ) ˆ (
ˆTL p d p TS
, (37)
Y C Y V X d p p TL 2 1 1 1
* ˆ ˆ
) ˆ ( ) ˆ (
ˆ
For practical purposes, we have to replace these unknown parameters by some suitable estimates. Liu (1993) gave the estimates of d by analogy with the estimate of k in ridge estimators. Following the method of Liu (1993), some of these estimates are defined as
p i i TSi pi i i TS mm d 1 2 2 * 1 2 ) 1 ˆ ( ˆ ) 1 ˆ ( ˆ 1 ˆ 1 ˆ
, (39)
p i i TSi pi i i TS mmh h d 1 2 2 * 1 2 ) 1 ˆ ( ˆ ) 1 ˆ ( ˆ 1 ˆ 1 ˆ
, (40)
p i i TSi i p i i TS CL d 1 2 2 * 1 2 ) 1 ˆ ( ˆ ˆ ) 1 ˆ ( 1 ˆ 1 ˆ , (41)
p i i TSi i p i i TS CLh h d 1 2 2 * 1 2 ) 1 ˆ ( ˆ ˆ ) 1 ˆ ( 1 ˆ 1 ˆ , (42)
where h0 and ˆ*
TS
and 2
TS
are the TS estimates of and 2.
A very important issue in the study of ridge regression is how to find an appropriate parameter k. When k is estimated from the data the ridge estimator is called the operational ridge estimator. Hoerl and Kennard (1970 a, b), Hoerl, Kennard and Baldwin (1975) and Lawless and Wang (1976) suggested some of the operational ridge parameters. Following them, some of these estimates are defined as
p i TSi TS HK k 1 2 * 2 ˆ ˆ ˆ , (43)
p i TSi TS HKB p k 1 2 * 2 ˆ ˆ ˆ , (44)
p i TSi i TS LW p k 1 2 * 2 ˆ ˆ ˆ ˆ 4. The Monte Carlo Simulation Study
In this section, we will discuss the simulation study to compare the performances of the OLS, TS, ORR, TR, SLS, STS, Liu and TL estimators. MATLAB is used for the simulation experiment. Following McDonald and Galarneau (1975) and Kibria (2003), the explanatory variables are generated by
p j
n i
z z
xij (1 ) ij ip 1 , 1,2,..., , 1,2,..., 2
/ 1
2
(46)
where z ij are independent standard normal pseudo-random numbers, is specified so that the correlation between any two explanatory variables is given by 2. Following Kibria (2003), three different sets of correlation are considered, corresponding to 0.7,0.8,0.9. The explanatory variables are then standardized so that X 'X is in the correlation form. The Vˆ1
matrix is the estimated V1 matrix which is defined in (18). Using the second method of ’s estimation in AR(1), five values of Durbin-Watson statistic are taken as d 0.2,0.6,1.0,1.4,1.8. So, the estimated five different values of are ˆ 0.1,0.3,0.5,0.7,0.9. Following Şiray et al. (2014), we choose the as the eigenvector corresponding to the largest and the smallest eigenvalue of the matrix X'Vˆ1X . Observations on the dependent variable are determined by
n i
x x
x
yi 01 i12 i2p ip i, 1,2,, (47)
where i are independent normal pseudo-random numbers with mean 0 and variance Vˆ
2
and
0
Chaturvedi, et. al., 2001). In this study, we choose n =20 and 60 and p =4. Then the experiment is replicated 5,000 times by generating new error terms.
We use the SMSE criterion to investigate the performance of the OLS, TS, ORR, TR, SLS, STS, Liu and TL estimators. The estimated SMSE for any estimator ˆ* is calculated as follows:
MCN r
r r
MCN e
s m
1
) * ˆ ( ' ) * ˆ ( 1
ˆ (48)
where ˆr* is the computed value of ˆ* for the rth replication of the experiment and MCN is the number of replications, which is taken 5000 for this experiment.
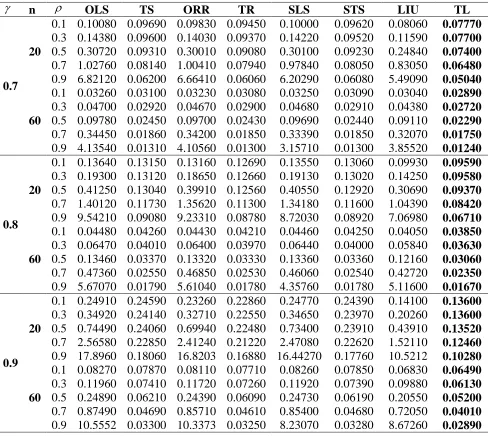
The results of the simulation study are summarized in Tables 1–6. We have the following comments. Note that for each case we chose the best k in ORR and TR estimators and the best
d in Liu and TL estimators among all suggested k’s and d’s which give the smallest SMSE.
Firstly, we comment about . As increases, the estimated SMSEs of the mentioned estimators also increase as expected (e.g. for ˆ 0.1, 0.8,n20,60, the SMSEs of the suggested estimators at 1 are larger than the SMSEs of the suggested estimators at 0.1). As increases, the estimated SMSEs of the mentioned estimators also increase as expected (e.g. for ˆ 0.1,n20,60, 1, the SMSEs of the suggested estimators at 0.8 are larger than the SMSEs of the suggested estimators at 0.7). As n increases, the estimated SMSEs of the mentioned estimators decrease as expected (e.g. for ˆ 0.1, 0.7, 1, the SMSEs of the suggested estimators at n60 are smaller than the SMSEs of the suggested estimators at
20
than the TR estimator. So, we can say that the STS estimator gives closed or better results than the TL estimator according to SMSE values for larger values of .
5. The Real Life Data Study
To illustrate the performance of the estimators, we consider the famous Portland cement data originally due to Woods et al. (1932). This data have been analyzed by several researchers: Hald (1952, pp. 635–652), Hamaker (1962), Gorman and Toman (1966, pp. 35–36), Daniel and Wood (1980, pp. 89–91, 106 107), Nomura (1988, pp. 735), Piepel and Redgate (1998) and Kaçıranlar et. al. (1999), Liu (2003), Sakallıoglu and Kaçıranlar (2008), and very recently, Muniz and Kibria (2009), among others. The data came from an experimental investigation of the heat evolved during the setting and hardening of Portland cement of varied composition and the dependence of this heat on the percentages of four compounds in the clinkers from which the cement was made. There are four explanatory variables: X1: amount of tricalcium aluminate,
2
X : amount of ticalcium silicate, X3: amount of tetracalcium alumino ferrite, and X4: amount
of dicalcium silicate. The response variable is Y: heat evolved in calories per gram of cement.
Consider the following linear regression model:
0 1X1 2X2 3X3 4X4
Y , (49)
where Y represents the dependent variable and Xi for i= 1, 2, 3 and 4 are the independent variables.
The fitted model is:
4 3
2
1 0.5102 0.1019 - 0.1441
1.5511 62.4054
ˆ X X X X
Table 7. Output using original data
n p ˆ2 dl du DW
1
VIF VIF2 VIF3 VIF4
0.05 13 4 5.983 0.574 2.094 2.053 38.496 254.423 46.868 282.513
where VIFi for each i= 1, 2, 3 represents the Variance Inflation Factors.
Table 7 shows that dlDW du, that means, the test is inconclusive. So, we took the residuals of the estimated model and we created the model of the residuals by its lags such that the best model of residuals is AR(1) model with ˆ 0.081 or by using eq.(19). So, the model suffers from first order autoregressive scheme and since all VIFs 4, the model also suffers from multicollinearity.
The X'X (correlation form) is:
1 030
. 0 973 . 0 245 . 0
030 . 0 1
139 . 0 824 . 0
973 . 0 139 . 0 1
229 . 0
245 . 0 824 . 0 229 . 0 1
'X X
[image:15.612.190.424.355.425.2]r
Table 8. Output using transformed data
1
VIF VIF2 VIF3 VIF4
11.322 102.586 12.575 116.204
So, we solved the autocorrelated error using TS estimator, where the new ˆ2 5.923 of a transformed data. Table 8 shows that all VIFs 4, that means, the model still suffers from the multicollinearity problem.
1 012
. 0 980 . 0 269 . 0
012 . 0 1
071 . 0 788 . 0
980 . 0 071 . 0 1
245 . 0
269 . 0 788 . 0 245 . 0 1
1
ˆ 'V X X
r
Since the model still suffers from the multicollinearity problem. We will use the TR estimator and the proposed TL estimator as the alternatives to solve this problem
[image:16.612.185.429.37.111.2]
Table 9 summarizes the interesting comparisons for the estimators subject to this study. See Table 10 and 11 in Appendices for the complete comparisons.
Table 9. Comparison of Estimators
Estimator Var 2
Bias mse k or d
OLS
ˆ 4912.100 0.000000 4912.100000
---TS
ˆ 4647.422 0.000000 4647.422000
---k
ˆ 57.97370 3096.800 3154.774000 k0.01
TR
ˆ 59.44948 2321.100 2380.549000 k0.01
S
ˆ 4911.800 0.000004 4911.800004 ---
STS
ˆ 4649.600 0.000002 4649.600002 ---
d
ˆ 788.8650 1399.700 2188.565000 d 0.4
TL
ˆ 746.4901 1059.600 1806.090000 d 0.4
[image:16.612.83.531.301.540.2]According to the Tables 10 and 11 in Appendices, ˆ is better than the other estimators in TL general and it is better than ˆ when TR d 0.2,0.3,0.4,0.5,0.6 in terms of the mse criterion.
Table 12. Comparisons between the ORR and the TR estimators with different estimated biasing
parameter k
Estimator
The estimated
biasing parameter
k
Var 2
Bias mse
k ˆ
0015 . 0
ˆ
HK
k 961.4145 1211.70000 2173.11450000
0077 . 0
ˆ
HKB
k 92.18690 2902.80000 2994.98690000
7
10 4889 . 1
ˆ
LW
k 4910.90 0.00005821 4910.90005821
TR ˆ
0020 . 0
ˆ
HK
k 703.5970 1105.10000 1808.69700000
01 . 0
ˆ
HKB
k 59.37540 2329.20000 2388.57540000
7
10 7136 . 1
ˆ
LW
[image:17.612.110.502.190.419.2]k 4648.600 0.00005355 4648.60005355
Table 12 shows that the mse values for the ORR and the TR estimator such that the mse values of the TR estimator are always smaller than the mse values of the ORR estimator for the three estimated biasing parameter k. (i.e. for kˆ , the mse value of the TR estimator is smaller than HK
the mse value of the ORR estimator and etc.)
Table 13. Comparisons between the Liu and the TL estimators with different estimated biasing
parameter d
Estimator
The estimated
biasing
parameter d
Var 2
Bias mse
d
[image:17.612.70.531.570.716.2]9724 . 0 ˆ
) 5 . 4 (h mm
d 4644.700 2.96870 4647.6687
8702 . 0
ˆ
CL
d 3721.400 65.4625 3786.8625
4161 . 0 ˆ
) 45 . 0 (h CL
d 853.4019 1325.60 2179.0019
TL ˆ
9920 . 0
ˆ
mm
d 4575.800 0.18920 4575.9892
9640 . 0 ˆ
) 5 . 4 (h mm
d 4321.300 3.83120 4325.1312
8303 . 0 ˆ
CL
d 3207.300 85.0348 3292.3348
2364 . 0 ˆ
) 5 . 4 (h CL
[image:18.612.135.475.37.225.2]d 261.9467 1722.00 1983.000
Table 13 shows that the mse values for the Liu and the TL estimator such that the mse values of the TL estimator are always smaller than the mse values of the Liu estimator for the four estimated biasing parameter d. (i.e. for dˆ , the mse value of the TL estimator is smaller than CL
the mse value of the Liu estimator and etc.).
Finally, according to the Tables 9, 12, and 13, we see that the TL estimator is the best estimator which gives the smallest mse value when d 0.4 comparing to the other mentioned estimators and then the TR estimator when kˆHK 0.0020 and so on.
Conclusions:
In this paper, we have examined the multicollinearity and autocorrelation problem simultaneously and defined the TL estimator in the linear regression model with AR(1)
correlated errors. Also, the results of our simulation and real life dataset suggest us that the mse of the TL estimator is smaller than the mentioned estimators but when gets larger, the STS estimator gives closed or better results than the TL estimator according to mse values.
References
Akdeniz F., Kaciranlar S., (1995). On the almost unbiased generalized Liu estimator and unbiased estimation of the bias and MSE. Communications in Statistics – Theory and Methods, 24, 1789-1797.
Alheety, M. and Kibria, B. M. (2009). On The Liu And Almost Unbiased Liu Estimators in The Presence Of Multicollinearity With Heteroscedastic Or Correlated Errors. Surveys in Mathematics and its Applications, 4, 155-167.
Bayhan, G. M. and Bayhan, M. (1998). Forecasting using autocorrelated errors and multicollinear predictor variables. Comp. Ind. Eng. 34, 2, 413–421.
Chaturvedi, A. and Shukla, G. (1990). Stein rule estimation in linear model with nonscalar error covariance matrix. Sankhya, 52, B, 293-304.
Chaturvedi, A., Wan, A. and Singh, Sh. (2001). Stein rule restricted regression estimator in a linear model with non spherical disturbances. Communication in Statistics-Theory and Methods, 30, 1, 55-68.
Daniel, C., Wood, F. S. (1980). Fitting equations to data. Computer analysis of multifactor data, Second Edition, with the assistance of JohnW. Gorman,Wiley, New York.
Eldum. H. and Zahri M., (2013). Relaxation Method For Two Stages Ridge Regression Estimator. International Journal of Pure and Applied Mathematics, Volume 85, 4, 653-667. Firinguetti, L. (1989). A simulation study of ridge regression estimators with autocorrelated
errors. Communications in Statistics – Simulation and Computation, 18, 2, 673-702.
Gorman, J. W., Toman, R. J. (1966). Selection of variables for fitting equations to data. Technometrics, 8, 27–51.
Gosling, B. J., Hsu, J. J. and Puterman, M. L. (1982). Ridge Estimation in Regression Problems with Autocorrelated Errors. Working paper no. 810. Faculty of Commerce and Business Administration. Vancouver: University of British Columbia.
Güler, H. and Kaçıranlar, S. (2009). A comparison of mixed and ridge estimators of linear models. Commun. Stat. Simul. Comput., 38, 2, 368–401.
Hald, A. (1952). Statistical theory with engineering applications, Wiley, New York. Hamaker, H.C. (1962). On multiple regression analysis. Statistica Neerlandica, 16, 31-56.
Hoerl, A. E., Kennard, R. W. (1970a). Ridge regression: Biased estimation for nonorthogonal problems. Technometrics, 12, 55–67.
Hoerl A.E., R.W. Kennard, K.F. Baldwin, (1975). Ridge regression: Some simulations. Communications in Statistics – Simulation and Computation, 4, 105-123.
James, W., Stein, C. (1961). Estimation with quadratic loss. Proceedings of the Fourth Berkeley Symposium on Mathematical Statistics and Probability. Berkeley, University of California Press. 361-379.
Judge, G. C., Griffiths, W. E., Hill, R. C., Lütkepohl, H., Lee, T. C. (1985). The Theory and Practice of Econometrics. 2nd ed. New York: John Wiley & Sons.
Kaçıranlar S., (2003). Liu estimator in the general linear regression model. Journal of Applied Statistical Science, 13, 229-234.
Kaçıranlar S., Sakallıoğlu, S., Akdeniz F., Styan, G.P.H., Werner, H.J., (1999). A new biased estimator in linear regression and detailed analysis of the widely-analysed dataset on Portland cement, Sankhya B, 61 , 443-459.
Kibria, B. M. G. (2003). Performance of some new ridge regression estimators. Commun. Stat. Simul. Comput., 32, 2, 419–435.
Lawless, J. F., Wang, P. (1976). A simulation study of ridge and other regression estimators. Communications in Statistics-Theory and Methods, 4, 307–323.
Liu, K. (1993). A New Class of Biased Estimate in Linear Regression. Communications in Statistics-Theory and Methods, 22, 2, 393-402.
Liu, K. (2003). Using Liu-type estimator to combat collinearity. Communications in Statistics— Theory and Methods, 32:1009–1020.
McDonald, G. C. and Galarneau, D. I. (1975). A monte carlo evaluation of some ridge-type estimators. J. Am. Stat. Assoc., 20, 407–416.
Muniz, G., Kibria, B. M. G. (2009). On Some Ridge Regression Estimators: An Empirical Comparisons. Communications in Statistics - Simulation and Computation, 3, 621- 630. Nomura, M. (1988). On the almost unbiased ridge regression estimator. Communications in
Statistics- Simulation and Computation, 17, 729–743.
Özkale, M. R. (2008). A jackknifed ridge estimator in the linear regression model with heteroscedastic or correlated errors. Statistics and Probability Letters, 78, 3159-3169. Özkale, M. R. (2014). Monte Carlo Simulation Study of Biased Estimators in the Linear
Piegel, G., Redgate, T. (1998). A mixture experiment analysis of the Hald cement data. The American Statistician, 1, 23–30.
Prais, S. J. and Winsten, C. B. (1954). Trend Estimators and Serial Correlation. Chicago: Cowles Commission.
Sakallıoğlu, S., Kacıranlar, S., Akdeniz, F. (2001). Mean Squared Error Comparisons of Some Biased Regression Estimators. Communications in Statistics - Theory and Methods, 2, 347-361.
Sakallıoğlu, S., Kacıranlar, S. (2008). A new biased estimator based on ridge estimation. Statistical Papers, 49:669–689.
Stein, C. (1956). Inadmissibility of usual estimator for the mean of a multivariate Normal distribution. Proceedings of the Third Berkeley Symposium on Mathmatical Statistics and Probability. Berkeley, University of California Press. 197-206.
Stein, C. (1975). Estimation of a covariance matrix. Rietz lecture, 39th Annual Meeting IMS. Atlanta, Georgia.
Şiray, G. U., Kaçıranlar, S. and Sakallıoğlu, S. (2014). r − k Class estimator in the linear regression model with correlated errors. Statistical Papers, 55, 393-407.
Trenkler, G. (1980). Generalized Mean Square Error Comparisons of Biased Regression Estimators. Communications in Statistics-Theory and Methods, 12, 1247–1259.
Trenkler, G. (1984). On the performance of biased estimators in the linear regression model with correlated or heteroscedastic errors, Journal of Econometrics, 25, 179-190.
Appendices
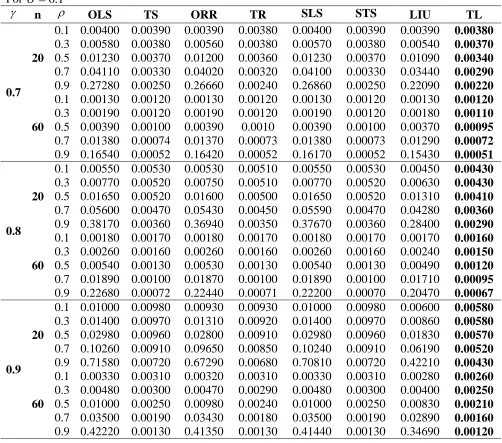
Table 1 For 0.1
n OLS TS ORR TR SLS STS LIU TL
0.7 20
0.1 0.00400 0.00390 0.00390 0.00380 0.00400 0.00390 0.00390 0.00380 0.3 0.00580 0.00380 0.00560 0.00380 0.00570 0.00380 0.00540 0.00370 0.5 0.01230 0.00370 0.01200 0.00360 0.01230 0.00370 0.01090 0.00340 0.7 0.04110 0.00330 0.04020 0.00320 0.04100 0.00330 0.03440 0.00290 0.9 0.27280 0.00250 0.26660 0.00240 0.26860 0.00250 0.22090 0.00220
60
0.1 0.00130 0.00120 0.00130 0.00120 0.00130 0.00120 0.00130 0.00120 0.3 0.00190 0.00120 0.00190 0.00120 0.00190 0.00120 0.00180 0.00110 0.5 0.00390 0.00100 0.00390 0.0010 0.00390 0.00100 0.00370 0.00095 0.7 0.01380 0.00074 0.01370 0.00073 0.01380 0.00073 0.01290 0.00072 0.9 0.16540 0.00052 0.16420 0.00052 0.16170 0.00052 0.15430 0.00051
0.8 20
0.1 0.00550 0.00530 0.00530 0.00510 0.00550 0.00530 0.00450 0.00430 0.3 0.00770 0.00520 0.00750 0.00510 0.00770 0.00520 0.00630 0.00430 0.5 0.01650 0.00520 0.01600 0.00500 0.01650 0.00520 0.01310 0.00410 0.7 0.05600 0.00470 0.05430 0.00450 0.05590 0.00470 0.04280 0.00360 0.9 0.38170 0.00360 0.36940 0.00350 0.37670 0.00360 0.28400 0.00290
60
0.1 0.00180 0.00170 0.00180 0.00170 0.00180 0.00170 0.00170 0.00160 0.3 0.00260 0.00160 0.00260 0.00160 0.00260 0.00160 0.00240 0.00150 0.5 0.00540 0.00130 0.00530 0.00130 0.00540 0.00130 0.00490 0.00120 0.7 0.01890 0.00100 0.01870 0.00100 0.01890 0.00100 0.01710 0.00095 0.9 0.22680 0.00072 0.22440 0.00071 0.22200 0.00070 0.20470 0.00067
0.9 20
0.1 0.01000 0.00980 0.00930 0.00930 0.01000 0.00980 0.00600 0.00580 0.3 0.01400 0.00970 0.01310 0.00920 0.01400 0.00970 0.00860 0.00580 0.5 0.02980 0.00960 0.02800 0.00910 0.02980 0.00960 0.01830 0.00570 0.7 0.10260 0.00910 0.09650 0.00850 0.10240 0.00910 0.06190 0.00520 0.9 0.71580 0.00720 0.67290 0.00680 0.70810 0.00720 0.42210 0.00430
60
Table 2 For 0.5
n OLS TS ORR TR SLS STS LIU TL
0.7 20
0.1 0.10080 0.09690 0.09830 0.09450 0.10000 0.09620 0.08060 0.07770 0.3 0.14380 0.09600 0.14030 0.09370 0.14220 0.09520 0.11590 0.07700 0.5 0.30720 0.09310 0.30010 0.09080 0.30100 0.09230 0.24840 0.07400 0.7 1.02760 0.08140 1.00410 0.07940 0.97840 0.08050 0.83050 0.06480 0.9 6.82120 0.06200 6.66410 0.06060 6.20290 0.06080 5.49090 0.05040
60
0.1 0.03260 0.03100 0.03230 0.03080 0.03250 0.03090 0.03040 0.02890 0.3 0.04700 0.02920 0.04670 0.02900 0.04680 0.02910 0.04380 0.02720 0.5 0.09780 0.02450 0.09700 0.02430 0.09690 0.02440 0.09110 0.02290 0.7 0.34450 0.01860 0.34200 0.01850 0.33390 0.01850 0.32070 0.01750 0.9 4.13540 0.01310 4.10560 0.01300 3.15710 0.01300 3.85520 0.01240
0.8 20
0.1 0.13640 0.13150 0.13160 0.12690 0.13550 0.13060 0.09930 0.09590 0.3 0.19300 0.13120 0.18650 0.12660 0.19130 0.13020 0.14250 0.09580 0.5 0.41250 0.13040 0.39910 0.12560 0.40550 0.12920 0.30690 0.09370 0.7 1.40120 0.11730 1.35620 0.11300 1.34180 0.11600 1.04390 0.08420 0.9 9.54210 0.09080 9.23310 0.08780 8.72030 0.08920 7.06980 0.06710
60
0.1 0.04480 0.04260 0.04430 0.04210 0.04460 0.04250 0.04050 0.03850 0.3 0.06470 0.04010 0.06400 0.03970 0.06440 0.04000 0.05840 0.03630 0.5 0.13460 0.03370 0.13320 0.03330 0.13360 0.03360 0.12160 0.03060 0.7 0.47360 0.02550 0.46850 0.02530 0.46060 0.02540 0.42720 0.02350 0.9 5.67070 0.01790 5.61040 0.01780 4.35760 0.01780 5.11600 0.01670
0.9 20
0.1 0.24910 0.24590 0.23260 0.22860 0.24770 0.24390 0.14100 0.13600 0.3 0.34920 0.24140 0.32710 0.22550 0.34650 0.23970 0.20260 0.13600 0.5 0.74490 0.24060 0.69940 0.22480 0.73400 0.23910 0.43910 0.13520 0.7 2.56580 0.22850 2.41240 0.21220 2.47080 0.22620 1.52110 0.12460 0.9 17.8960 0.18060 16.8203 0.16880 16.44270 0.17760 10.5212 0.10280
60
Table 3 For 1
n OLS TS ORR TR SLS STS LIU TL
0.7 20
0.1 0.40310 0.38780 0.39300 0.37820 0.39110 0.37620 0.32020 0.30850 0.3 0.57500 0.38410 0.56130 0.37470 0.55250 0.37220 0.46120 0.30600 0.5 1.22890 0.37260 1.20050 0.36310 1.15100 0.35940 0.99070 0.29440 0.7 4.11050 0.32580 4.01650 0.31760 3.70320 0.31120 3.31830 0.25820 0.9 27.2847 0.24780 26.6562 0.24220 24.2084 0.23070 21.9590 0.20090
60
0.1 0.13030 0.12390 0.12940 0.12300 0.12870 0.12250 0.12140 0.11530 0.3 0.18810 0.11680 0.18670 0.11590 0.18490 0.11540 0.17520 0.10870 0.5 0.39110 0.09800 0.38820 0.09740 0.37810 0.09680 0.36410 0.09170 0.7 1.37810 0.07430 1.36790 0.07380 1.23580 0.07320 1.28240 0.07000 0.9 16.5416 0.05230 16.4223 0.05200 11.7350 0.05110 15.4206 0.04970
0.8 20
0.1 0.54570 0.52600 0.52630 0.50750 0.53110 0.51180 0.39550 0.38210 0.3 0.77220 0.52470 0.74610 0.50640 0.74550 0.50970 0.56820 0.38170 0.5 1.65020 0.52140 1.59640 0.50230 1.55590 0.50420 1.22510 0.37380 0.7 5.60480 0.46930 5.42490 0.45200 5.07920 0.44930 4.17220 0.33610 0.9 38.1682 0.36330 36.9321 0.35120 33.9684 0.33890 28.2746 0.26780
60
0.1 0.17910 0.17030 0.17720 0.16850 0.17710 0.16860 0.16170 0.15370 0.3 0.25870 0.16050 0.25600 0.15890 0.25490 0.15890 0.23370 0.14510 0.5 0.53840 0.13470 0.53270 0.13340 0.52260 0.13320 0.48620 0.12250 0.7 1.89430 0.10200 1.87410 0.10110 1.71750 0.10070 1.70880 0.09380 0.9 22.6829 0.07180 22.4416 0.07120 15.9184 0.07020 20.4639 0.06680
0.9 20
0.1 0.99660 0.98340 0.93020 0.91460 0.97330 0.95370 0.56280 0.54610 0.3 1.39670 0.96540 1.30830 0.90200 1.35480 0.94040 0.80890 0.54470 0.5 2.97940 0.96230 2.79760 0.89900 2.82820 0.93940 1.75390 0.54000 0.7 10.2633 0.91410 9.64970 0.84890 9.35990 0.87800 6.08090 0.49760 0.9 71.5838 0.72250 67.2808 0.67510 63.8998 0.67640 42.0796 0.41080
60
Table 4 For 4
n OLS TS ORR TR SLS STS LIU TL
0.7 20
0.1 6.44980 6.20420 6.28790 6.05030 5.07820 4.86230 5.11030 4.92450 0.3 9.20050 6.14540 8.98090 5.99500 7.36510 4.77360 7.36780 4.88810 0.5 19.6632 5.96110 19.2077 5.80970 16.0776 4.45090 15.8372 4.70450 0.7 65.7674 5.21270 64.2639 5.08190 55.5152 3.51680 53.0740 4.12640 0.9 436.555 3.96500 426.498 3.87570 382.422 2.17510 351.316 3.21080
60
0.1 2.08500 1.98280 2.06970 1.96810 1.78630 1.70550 1.94080 1.84440 0.3 3.00990 1.86850 2.98770 1.85480 2.50190 1.60480 2.80180 1.73950 0.5 6.25700 1.56860 6.21090 1.55770 4.88030 1.32880 5.82370 1.46650 0.7 22.0498 1.18850 21.8867 1.18120 16.0425 0.96750 20.5168 1.11950 0.9 264.665 0.83710 262.757 0.83280 181.628 0.61470 246.727 0.79570
0.8 20
0.1 8.73120 8.41550 8.42020 8.11950 6.31950 6.10450 6.93530 6.65150 0.3 12.3546 8.39530 11.9375 8.10270 9.08270 6.10050 9.93780 6.58410 0.5 26.4031 8.34310 25.5421 8.03710 19.5893 5.97500 21.7634 6.28810 0.7 89.6762 7.50850 86.7975 7.23230 75.9630 5.12120 66.7379 5.37400 0.9 610.691 5.81240 590.911 5.61840 536.198 3.17970 452.363 4.28200
60
0.1 2.86490 2.72500 2.83470 2.69600 2.48270 2.36980 2.58670 2.45830 0.3 4.13940 2.56860 4.09580 2.54180 3.47990 2.23060 3.73800 2.32120 0.5 8.61410 2.15530 8.52330 2.13420 6.79570 1.85200 7.77750 1.96030 0.7 30.3085 1.63180 29.9858 1.61760 22.0855 1.34970 27.3386 1.50020 0.9 362.926 1.14830 359.064 1.13990 244.336 0.83460 327.421 1.06930
0.9 20
0.1 15.9454 15.7347 14.8830 14.6333 8.99870 8.73250 12.8012 12.3038 0.3 22.3479 15.4469 20.9331 14.4320 12.9362 8.70930 18.0908 12.2405 0.5 47.6711 15.3974 44.7620 14.3837 28.0504 8.63590 39.3592 12.0052 0.7 164.213 14.6261 154.393 13.5825 97.2736 7.95820 139.464 10.1408 0.9 1145.30 11.6000 1076.50 10.8000 673.200 6.30000 1007.40 6.60000
60
Table 5 For 9
n OLS TS ORR TR SLS STS LIU TL
0.7 20
0.1 32.6519 31.4087 31.8320 30.6295 23.6928 22.6089 25.8664 24.9259 0.3 46.5776 31.1112 45.4661 30.3497 35.2403 21.9844 37.2981 24.7447 0.5 99.5449 30.1780 97.2390 29.4116 79.4956 20.0158 80.1728 23.8155 0.7 332.947 26.3891 325.335 25.7274 279.238 15.1105 268.681 20.8890 0.9 2210.10 20.1000 2159.10 19.6000 1934.10 11.3000 1778.50 16.3000
60
0.1 10.5553 10.0381 10.4777 9.96350 7.62080 7.23800 9.82540 9.33740 0.3 15.2374 9.45920 15.1254 9.38980 10.9537 6.66130 14.1837 8.80600 0.5 31.6760 7.94080 31.4428 7.88600 22.4672 5.27050 29.4819 7.42420 0.7 111.627 6.01690 110.801 5.98010 78.6438 3.53340 103.865 5.66770 0.9 1339.90 4.20000 1330.20 4.20000 918.300 3.90000 1249.10 4.00000
0.8 20
0.1 44.2016 42.6034 42.6273 41.1049 32.1547 30.7202 31.9894 30.9010 0.3 62.5453 42.5013 60.4340 41.0199 47.5176 30.2846 45.9803 30.8828 0.5 133.665 42.2367 129.306 40.6881 107.076 28.2925 99.1680 30.2476 0.7 453.986 38.0119 439.411 36.6134 382.370 22.1694 337.854 27.2052 0.9 3091.60 29.4000 2991.50 28.4000 2711.90 15.6000 2290.10 21.7000
60
0.1 14.5036 13.7951 14.3506 13.6484 10.5212 9.97150 13.0951 12.4447 0.3 20.9558 13.0038 20.7351 12.8678 15.0803 9.18420 18.9235 11.7507 0.5 43.6090 10.9113 43.1492 10.8046 31.1998 7.31510 39.3732 9.92420 0.7 153.436 8.2608 151.803 8.18930 108.307 4.77770 138.401 7.59460 0.9 1837.30 5.80000 1817.80 5.80000 1234.60 0.00430 1657.60 0.00540
0.9 20
0.1 80.7234 79.6567 75.3449 74.0813 45.5531 44.2079 58.9509 56.3124 0.3 113.136 78.1999 105.974 73.0620 65.4888 44.0888 86.3287 56.0249 0.5 241.335 77.9496 226.607 72.8176 142.001 43.7186 193.687 53.8833 0.7 831.330 74.0447 781.614 68.7613 492.439 40.2881 701.149 43.3820 0.9 5798.30 58.5000 5449.70 54.7000 5095.00 29.4000 3408.20 33.3000
60
Table 6 For 20
n OLS TS ORR TR SLS STS LIU TL
0.7 20
0.1 161.243 155.104 157.194 151.256 114.990 109.370 127.728 123.085 0.3 230.012 153.635 224.524 149.875 171.387 105.738 184.189 122.196 0.5 491.580 149.026 480.192 145.242 390.223 95.2341 395.914 117.607 0.7 1644.20 130.300 1606.60 127.000 1377.10 70.4000 1326.80 103.200 0.9 109140 99.0000 10662.0 97.0000 9549.00 60.0000 8783.00 80.0000
60
0.1 52.1250 49.5707 51.7417 49.2026 34.9243 32.7802 48.5204 46.1108 0.3 75.2466 46.7122 74.6933 46.3692 51.2379 29.6174 70.0422 43.4865 0.5 156.424 39.2138 155.272 38.9433 107.975 22.3779 145.588 36.6631 0.7 551.244 29.7132 547.167 29.5313 385.467 15.5825 512.915 27.9886 0.9 6616.60 20.9000 6568.90 20.8000 4535.40 11.6000 6168.20 19.9000
0.8 20
0.1 218.279 210.387 210.505 202.987 156.396 148.725 157.967 152.593 0.3 308.865 209.883 298.439 202.567 231.055 144.947 227.064 152.507 0.5 660.078 208.576 638.552 200.928 525.454 134.669 489.716 149.371 0.7 2241.90 187.700 2169.90 180.800 1883.70 103.500 1668.40 134.300 0.9 152670 145.000 14773.0 140.000 13389.0 87.0000 11309.0 107.000
60
0.1 71.6226 68.1240 70.8673 67.3994 48.0458 45.2322 64.6670 61.4549 0.3 103.485 64.2161 102.395 63.5444 71.0831 40.9048 93.4495 58.0275 0.5 215.353 53.8831 213.082 53.3562 149.000 30.9069 194.434 49.0085 0.7 757.713 40.7939 749.645 40.4409 528.454 21.2984 683.460 37.5045 0.9 9073.20 28.7000 8976.60 28.5000 6097.90 17.5000 8185.50 26.7000
0.9 20
0.1 398.634 393.400 372.073 365.800 224.949 218.311 286.237 271.932 0.3 558.697 386.172 523.328 360.800 323.402 217.719 418.647 267.845 0.5 1191.80 384.936 1119.00 359.592 701.200 215.900 950.700 257.000 0.7 4105.30 365.700 3859.80 339.600 2431.80 199.000 3456.70 206.300 0.9 286340 289.000 26912.0 270.000 16831.0 164.000 25154.0 172.000
60
Table 10
k
ˆ ˆ TR
k Var 2
Bias mse Var 2
Bias mse
Table 11
d
ˆ ˆ TL
d Var 2
Bias mse Var 2
Bias mse