Citation:
Rhodes, MJ and Gregoriou, A (2017) The accuracy of spread decomposition models in capturing informed trades Evidence from the London Stock Exchange and behavioural implications. Review of Behavioral Finance. DOI: https://doi.org/10.1108/RBF-02-2017-0016
Link to Leeds Beckett Repository record: http://eprints.leedsbeckett.ac.uk/3918/
Document Version: Article
The aim of the Leeds Beckett Repository is to provide open access to our research, as required by funder policies and permitted by publishers and copyright law.
The Leeds Beckett repository holds a wide range of publications, each of which has been checked for copyright and the relevant embargo period has been applied by the Research Services team.
We operate on a standard take-down policy. If you are the author or publisher of an output and you would like it removed from the repository, please contact us and we will investigate on a case-by-case basis.
e
1
The Accuracy of Spread Decomposition Models in Capturing Informed Trades. Evidence from the London Stock Exchange and Behavioural Implications.
Andros Gregoriou
Brighton Business School, Mithras House, Lewes Road, Brighton
Mark Rhodes
University of Hull, Hull
Abstract
Purpose – The purpose is to examine the empirical relationship between trades undertaken by informed agents (managers) and the proxies for informed trades computed by bid-ask spread decomposition models.
Design/methodology/approach – An econometric application of spread decomposition models to data from the London Stock Exchange, with an examination of whether the model predictions are co-integrated with actual outcomes.
Findings – We find overwhelming evidence of non stationary behaviour between the actual and predicted informed trade prices. Our findings suggest that there is a clear need for an alternative to extant spread decomposition models perhaps incorporating findings from behavioural finance.
Originality/value – Given the importance of stock market liquidity and the extensive use of spread decomposition models in predicting informed trades, we believe that the research conducted in our paper is an important contribution to the market microstructure literature.
Keywords;Spread Decomposition Models, Information Asymmetry, Bid-Ask Spread, Time Series Modelling, Behavioural Finance.
Pag
e
2
Abstract
In this paper we examine the empirical relationship between trades undertaken by informed
agents (managers) and the proxies for informed trades computed by bid-ask spread
decomposition models. Behavioural finance offers a rationale for examining the efficacy of
existing approaches. We find overwhelming evidence of non stationary behaviour between the
actual and predicted informed trade prices. Our results are robust to non linear speed of
adjustments of stock prices, trade sizes, trading time and calendar anomalies. Our findings
suggest that there is a clear need for an alternative to extant spread decomposition models. As
we present evidence that spread decomposition models do not serve to adequately address
observed behaviour, we suggest avenues for further research. Given the importance of stock
market liquidity and the extensive use of spread decomposition models in predicting informed
trades, we believe that the research conducted in our paper is an important contribution to the
market microstructure literature.
e
3
1. Introduction
One of the most important factors that investors look for in a financial market is liquidity.
Liquidity is defined as the ability to trade stock rapidly with little price impact. To maintain
liquidity Stock Exchanges use market makers, who are individuals willing to provide a
financial market whenever investors wish to trade. In return for providing the financial market,
market makers are granted monopoly rights by the Exchanges to post different prices for stock
purchases and sales. As a result, market makers buy shares at the bid price and sell the stock at
the higher ask price. This ability to buy the stock low and sell high is the market makers’
compensation for providing the financial market. Their compensation is defined as the ask
price minus the bid price, which in turn is denoted as the bid-ask spread. Competition between
market makers should narrow the bid ask spread to an efficient level so that they are (just)
compensated for their costs. Models of the bid ask spread therefore seek to decompose the
costs of market making in order to better understand the operation, efficiency and workings of
the market. Extent models assume consistent rationality amongst all market participants which
is a strong assumption given the extensive literature on behavioral finance and we discuss the
implications of this. The remainder of the paper is structured as follows. We first discuss the
literature on the decomposition of the bid ask spread before section 3 provides more detail on
models. Market inefficiency and spreads are discussed with reference to behavioural factors
in section 4 with data and the econometric method presented in section 5. Section 6 presents
the results which are then followed by concluding remarks.
2. Literature on decomposition of the bid ask spread.
The market microstructure literature identifies the cost components that should be
incorporated in the quoted bid-ask spread when analysing the supply price of market making
Pag
e
4
market makers for carrying and managing inventories to meet the requirements of investors. In
more recent work, costs are referred to as order processing and inventory holding costs. Order
processing costs are, as the name suggests, those administrative and other costs that arise from
managing orders from traders. Inventory costs were characterised, in the earlier literature, as
those arising from the price risk to which market makers are exposed as they hold inventory to
facilitate their role. However, a more recent and extensive theoretical literature (Huang and
Stoll, 1997; Lin et al, 1995; Madhavan, et al, 1997; to name but a few) decomposes inventory
costs into their non-information and information components. The latter is commonly known
as the adverse selection costs of trading. This reflects the costs of transacting with an informed
trader. Its isolation and use in modelling market liquidity reveals the impact of asymmetric
information on trading costs. It should also be noted that, if prices are partly determined by
behavioral factors, inventory costs will need to take account of this. Extant models do not take
account of behavioral factors.
Empirical results follow the theoretical literature in their development. Serial covariance
models see spread as a function of covariance between current and preceding price (changes).
An example is the model of Roll (1984), who finds a direct theoretical relationship between
spread and serial covariance, assuming that there are no informational inefficiencies in the
market. Here there are no adjustments of inventory as the spread only depends on the order
processing costs. A negative relationship is found between the spread and market size in the
US. This is extended in Choi et al (1988) to allow for serial dependence in the trade flow as
market makers equalise their inventory by adjusting the bid ask spread. Stoll (1989) further
developed the approach by removing the assumption of independence of buy and sell orders,
by which means the components of the spread can be identified. The relationship between
e
5
both transaction and quoted prices allows a further decomposition of the spread. Stoll (1989)
finds that information asymmetry accounts for more than 40% of the spread.
Huang and Stoll (1997) consider prices and the decomposition of spreads to be linked. The mid point
of the bid-ask spread is a function of the fundamental value of the stock price and the inventory holdings
of the market maker. Where there are inventory holdings, the change in mid point is then a function of
two elements, order processing and inventory costs. For inventory costs there is a further split between
the change in information conferred by the last trade (the information costs) and the change in the
inventory holding costs. Huang and Stoll (1997) use GMM as the price has a certain level discreetness
and there are rounding errors in the residual term. They find that in terms of the two component model,
order processing accounts for an average of 88.6% of the spread, although with some heterogeneity.
The smaller part is attributable to inventory and adverse information costs. The argument presented by
the authors is that the stocks in the sample are large and therefore the chance of trading against an
informed trader are low. A model that further decomposes the spread finds that the adverse information
component is relatively small. The authors also decompose the spread based on buying and selling
pressure. In this approach order processing still accounts for the largest component of the
spread. Inventory costs are the next largest with information asymmetry costs comprising less than
10% on average. There is some evidence that large trades are anticipated, the ‘upstairs market’ also
being suggested as the reason that the adverse information costs are lower due to pre trade negation on
the price of large transactions.
Alzahani et al (2013) examine the price impact of block trades. Price changes would respond only to
new information in the case of an efficient market but in reality it is likely that trades themselves convey
information about views as to the value of a stock. This is a market inefficiency as the presence of
information in a trade implies that there was an asymmetry to begin with. The authors argue that large
trades may have a greater influence as other market participants observe when large trades are initiated.
Where the effects of block trades are modelled under an information asymmetry framework the finding
Pag
e
6
Where one has volumes then the determinants of the spread can be estimated with the adverse selection
and order processing / inventory costs being proxied by the quantity and change in quantity, after
Glosten and Harris (88). Something similar pertains for the model by Madhavan et al (1997)
More recent empirical studies use a methodology for capturing information asymmetry known
as the Probability of Information-based Trade (PIN). This is estimated by the market
microstructure model of Easley et al. (1997a, b). In this approach market makers are
characterised as forming beliefs regarding the likelihood of an information based trade from
observing the price at which trades are executed. A conclusion as to whether a trade is buy or
sell being derived from observing the execution price relative to quoted prices.
The motivation for the use of this approach is that it is more likely to capture short term factors
associated with responses to dealers’ inventory order imbalance than long-term information
asymmetry factors associated with bid-ask spread measures (Callahan et al., 1997; Madhavan
et al., 1997).
We are the first study to evaluate the effectiveness of information asymmetry models in
encapsulating informed trades. We do this by examining the empirical relationship between
trades undertaken by informed agents (managers) and the proxies for informed trades computed
by market microstructure models. We employ the three most commonly used information
asymmetry models namely the Huang and Stoll (1997), Madhavan et al (1997) and the Easley
et al (1997a, b) to provide estimates of informed trades.1
If spread decomposition models are associated with stock market efficiency, we would expect
that deviations of predicted stock prices from the prices of actual informed trades should follow
1 One possible limitation of the present study is that there are various other spread decomposition models that
e
7
a stationary process. If this is not the case, the resulting excess volatility in predicted prices
relative to the actual informed trade prices could generate an anomaly in the stock market. If
this anomaly persists it could violate the efficient market hypothesis. Hence, finding that
predicted price deviations from actual informed trades are non-stationary should be considered
a puzzle, indicating that they should not be used to predict informed trades. This suggests that
we require alternative models and that all previous literature which predicts informed trades
through these models are inaccurate. Given the importance of stock market liquidity and the
extensive use of spread decomposition models in predicting informed trades, we believe that
the research conducted in our paper is an important contribution to the literature on stock
market trading.
As market makers are forming beliefs about informed trades, part of the motivation for
undertaking this work is derived from the behavioural finance literature. If beliefs are not
formed rationally, or are formed in a way which is inconsistent with efficient markets,
behavioural finance may offer some plausible explanations and a direction for further research.
We are not aware of work that has explicitly discussed spreads from this perspective.
The remainder of the paper is structured as follows. The next section describes the most
commonly used spread decomposition models used in the market microstructure literature.
Section 3 presents the data and econometric methodology. The results are reported in Section
4. Finally, Section 5 concludes.
3. Spread Decomposition Models
3.1 Madhavan, Richardson and Roomans (1997) (MRR Model)
Pag
e
8
1t t t t
p Q Q u
(1)
Where, is the first difference operator and pt denotes the transaction price of security at time
t. The model assumes a fixed order size, where Qt is a trade initiation indicator variable such
that Qt = +1 implies buyer initiated trade; Qt = -1 implies seller initiated trade and Qt = 0 denotes
pre-negotiated trades (crosses) which occur within the bid-ask spread. The constant, ,
represents the drift in prices; and ut, a random error term, embeds the noises associated with
price discreteness. A change from a seller initiated trade to a buyer initiated trade therefore
gives the greatest (expected) positive price movement, dependent upon the values of the
parameters. Of these
measures market-makers’ direct cost of supplying liquidity per share(transaction costs component). Theta (
) is the information asymmetry parameter whichmeasures the magnitude of the adverse selection cost, the more sensitive price (expectation)
revisions are to the order flow the greater the perceived probability that a market maker is
transacting with an informed trader. The rho () is the autocorrelation coefficient of order
flow which can also be defined as
2
(1
)
; where the parameters and
respectivelydenote the probabilities of trade flow continuation and mid-quote execution.2 Equation (1)
expresses changes in security price as a function of order (buy and sell) flows, transaction costs,
adverse selection costs and the noises associated with price discreteness. MRR suggest
estimating the price formation equation by Generalized Method of Moments (GMM) under the
following moment restrictions:
2 1
1
0, (1 ) 0, 0,
( ) 0, ( ) 0
t t t it t
t it t it
E Q Q Q E Q E u
E u Q E u Q
(2)
e
9
The first moment defines the autocorrelation in trade initiation of trades, the second moment
is the crossing probability, the third moment defines the drift term,
, as the average pricingerror. The last two moments are OLS normal equations. We estimate the parameters of
Equation (1) by GMM estimator, subject to the moment restrictions given in (2), for each
company of our sample. The MRR adverse selection component (ASMRR) is calculated as:
( )
MRR
AS
(3)
The implied expected spread is given by 2( ) and the implied effective spread by
1
2( ).3.2 Huang and Stoll (1997) (HS Model)
The Huang and Stoll (1997) adverse selection component is computed by estimating the
following regression by ordinary least squares:
1 2 1 3 , 1
it t t A t t
p Q Q Q e
(4)
Where pit represents the change in the transaction price prior to the quoted spread at time t;
, i t
Q equals 1 (-1) if the trade is a sell (buy) at time t. In conjunction with previous market
microstructure literature we use a “combined” buy/sell indicator,QA t,1, which equals 1 (-1, 0)
if the sum of Qi t,1 across all the trades is positive (negative, zero) to capture the market-wide
pressure on the inventory cost component of the bid-ask spread. Assuming that the number of
share purchases and sales are equal, the estimated information cost component of the bid-ask
spread is equal to 2
2 1
.Pag e
10
! ! ) ( ) 1 ( ! ) ( ! ! ! ) 1 ( ) , ( ) ( ) ( S e B e S e B e S e B e S B L S s S B b S S s S B b S S s S B b S s b s b s b The probability of an informed trade with private information has the following form:
The numerator is the expected number of informed trades (that is, the product of the probability
of a trading day with private information
and the arrival rate of informed trading
). Thedenominator is total trading activity, including both informed trading αμ and the arrival rate of
un-informed buy orders b and sell orders s. Under the sufficient independence conditions
across trading days, the trading parameters (,,,s,b) are estimated simultaneously by
maximizing the likelihood function
for each share for at least 40 days. The daily numbers of buyer- or seller-initiated orders
) ,
(Bi Si are sufficient statistics to estimate the parameter vector
and calculate PIN. For eachsingle trading day
i
, this likelihood L is a mixed distribution where the trade outcomes areweighted by the probability of it being a good news day,
(
1
)
, a bad news day,(
)
, anda no news day,
(
1
)
.The trade process for a single trading day is; being a good news day,
(
1
)
, a bad news day,)
(
, and a no news day,(
1
)
. The trade process for a single trading day is:b s PIN ) , (
1 i i
e
11
Each trade is specified as buyer- or seller-initiated using the standard algorithm, which
classifies any trade above (below) the midpoint of the current quoted spread as a buy (sell)
because trades originating from buyers (sellers) are most likely to be executed at or near the
ask (bid). For trades taking place at the midpoint, a tick test based on the most recent transaction
price is used to classify the trade. Following Hasbrouck (1988), all trades occurring within 5
seconds of each other are classified as a single trade.
The structure of informed trading is measured by the difference between the level of
informed trading on positive and negative private information (DF). The level of informed
trading on positive private information (PPIN) is measured by:
For negative private information (NPIN) is measured by:
Therefore the difference is measured:
4. Market (in)efficiency and spreads
The preceding outlines the means by which the extant literature has analysed the determinants
of spread, predicated on an assumption of market efficiency. However, there is an emerging
debate regarding observed deviations from efficient markets. Although little has been directed
at the question of behavioural finance and the setting of spreads, this literature does inform a
decision to address the question of whether models of spreads might be efficacious. There is
also some evidence to suggest that existing models of the spread may be incomplete, with
potentially biased findings being the result.
b
s ) 1 ( PPIN
b
s NPIN
Pag
e
12
Market makers must set prices in reference to the trading behaviour and (presumed)
information set of investors. Consequently, they may respond to, or seek to exploit patterns of,
trading behaviours that are not rational, even though their own decisions are formed rationally.
In addition, spreads themselves contain information or may be used to spread disinformation,
analogous to ‘shaking the tree’ in the setting of low prices to trigger panic selling for example.
The LSE has around 600,000 trades a day, suggesting that detailed manipulation of the market
through spreads would be difficult for even a small proportion of aggregate trades. Counter to
this, however, is that there are features of market making that mean behavioural anomalies are
possible. The LSE order book has 61 registered market makers (LSE, 2016), possibly
conferring sufficient market power on each for some pricing anomalies to be maintained over
the short term. Although market makers typically automate the setting of spreads they revert
to manual settings during periods of high volatility. If spreads are set heuristically during such
periods deviations may be observed from the predictions of models based on the assumption
of rational decision making and also due to the potential biases of traders.
Lee et al (1993) find that providers of liquidity are sensitive to changes in information
asymmetry risk. They find that both spreads and depth are used to manage the risk, an
implication being that depth might be a missing element from many models of liquidity and
that there is a dynamic relationship between spreads and depth. Frijns et al (2008) find that
improvements in the regulatory environment related to insider trading affected the importance
of information asymmetry in the spread. To note however is that the failure to account for the
structural break biased the estimated parameters for the effect of information asymmetry. A
less direct relationship to the question of whether spread models are appropriate may be found
in the work of Attig et al (2006), who find that information asymmetry is greater where control
e
13
Behavioural models of the spread have seen little development, however more general findings
on behaviour in the determination of asset prices may inform behavioural implications for the
determination of spreads. Gagnon and Power (2016), in an analysis of oil futures, find that the
level of risk aversion changes depending on the context and in particular the levels of wealth.
This might imply that market makers set spreads conditional on the prior performance of stock
or expectations of future risks. Abnormal investor sentiment is introduced by Jiang et al (2003)
in an analysis of spreads, abnormal sentiment is found to have a positive effect on adverse
selection costs for closed end funds. Reasons for the deviation of sentiment are discussed as
arsing from misconceptions or undue optimism or pessimism. Baker and Wurgler (2006) find
that investor sentiment impacts on the cross section of stock returns, suggesting that the effect
may be more pronounced where stock valuation is less certain. Although the setting is different
from that of these works, evidence that abnormal investor sentiment impacts on spreads or
prices suggests that market makers are aware and respond to behavioural factors. Antoniou et
al (2011) find evidence of positive feedback trading by noise traders in futures markets, a
destabilising mechanism that challenges efficient market assumptions. On asset pricing Bhar
and Malliaris (2011) report that the equity risk premium changes across different economic
regimes, complimenting the concept discussed by Baker and Wurgler (2006). This might be
expected to translate into the risks of market making and hence spreads, suggesting that models
of the spread that implicitly assume constant risk premia may be biased.
Experimental work suggests that investors deviate from fundamental value in determining asset
prices. Caginalp et al (2000) find that investors follow price trends as well as fundamental
values in an experimental setting. The observed momentum effect is presented as a possible
explanation for bubbles (and subsequent crashes) in financial markets. Irrational behaviour by
Pag
e
14
In a review of the experimental literature Duxbury (2015a, 2015b) reports on papers that also
find autocorrelation is greater the the longer the existing run.
Evidence that investors under-react to news is discussed in Chan et al (1996), who find that
investors over-weight past performance, allowing views on the value of a stock to persist for
longer than is consistent with rational price setting. This is offered as an explanation for the
predictability of stock returns. In Jegadeesh and Titman (1995) evidence for reversals in
returns is discussed with the finding that this can be explained by market makers using spreads
to adjust inventory. They conclude that preceding findings on the topic may be consistent with
efficient markets were their augmentation to be adopted. Park and Irwin (2007) review the
literature on technical analysis with ‘modern’ studies presenting evidence that returns can be
predicted. However they also suggest that further work on the methodology and data quality
in studies would be of use in reinforcing these conclusions. Behavioural aspects may serve to
explain some of the observed profit making opportunities presented by technical analysis.
Where noise traders hold irrational beliefs as to the true value of stock, positive feedback can
lead to increases in aggregate demand. If a substantial trend in stock prices is observed, the
possibility of a significant market correction increases and hence the risk to market makers.
We would expect this to lead to an increase in the spread. Amini et al (2013) examine the
literature on price reactions following large initial changes, a further part of the literature on
prediction. Behavioural explanations are found in investors giving too much weight to current
information, over-reacting to large price movements or only slowly incorporating information
so that there is an under-reaction. The link to spreads is that significant new information may
be more difficult for market participants to endogenise, resulting in an increase in risk and
therefore spreads, this especially the case subsequent to large price falls. Related to this is
herding, with prices moved away from fundamental levels as investors follow the decisions of
e
15
and analysts. The behavioural explanation is that the investment professionals herd in order to
protect reputations. The literature is also reported as presenting investor irrationality as a
reason for herding as well. If stock prices are moved way from their fundamental values then
this again presents as a challenge for market makers, who might be expected to price in the risk
of a market correction.
Whether as a consequence of the ineffectual modelling of spreads in efficient markets or
because spreads are influenced by behavioural factors, there is a literature that supports our
questioning of whether spread decomposition models are appropriate.
5. Data and Econometric Methodology
5.1 Data
We obtain data on all intraday trades that were executed on the London Stock Exchange in
2013. We derive the predicted prices of all informed trades by computing the three spread
decomposition models described in the previous section of the paper. A match is then made
between the predicted prices with actual informed trades that have taken place. Informed trades
are defined as transactions undertaken by managers of the firms. Our final sample consists of
1896000 tick trades.
5.2 Econometric Methodology
5.21 Linear Unit Root Tests
The standard linear Augmented Dickey-Fuller (ADF) test uses the following regression
model to test whether the deviations of predicted prices from the actual informed trade prices
Pag e
16
* * * 0 1 1 1) ) (P )
(P (P
n
t t i t i t i
i
t P
t P P
t
(5)where Pt is the predicted stock price from the spread decomposition models at time period t,
* t
P is the actual informed trade stock price at time period t, the
'
s
are constants and
t is arandom disturbance term. The terms in *
(Pt i Pt i )
are included to remove any serial
correlation in
t. Rejecting the null of non-stationarity requires the estimates of to benegative and significantly different from zero.
5.22 Non-linear unit root tests
Possible explanations for the failure to reject non-stationarity are that linear unit root
tests are not very powerful when the true adjustment process is non-linear. Hence, in this
section we employ an Exponential Smooth Transition Autoregressive model (ESTAR), which
assumes that the adjustment of predicted towards the actual informed trade prices is
characterized by a symmetric non-linear process3:
*
1 2 1 * * * 1 11 1 1
t t P
t t t
P
t t t t
P
P
PP
PP
e
u
(6)where ut is the error term and the other variables are as previously defined. Under the null
hypothesis of non stationarity,
1
and a0, predicted prices follows a random walkaround * t
P . In the case of stationarity (a0), predicted prices reverse to * t
P . Computing a
first-order Taylor series approximation to (6) under the null and allowing for serial correlation
in ut, we obtain the following auxiliary regression model (Kapetanios et al., 2003):
e
17
* * *
0 1 1
1
3
) (P )
(P (P )
n
t t t t i t i t i t
i
P
P P v
(7)where vt is the error term and the other variables are defined as previously. Equation (7)
follows a non-standard distribution; therefore critical values of the t-statistic for the
significance of
are calculated from 1000 bootstrapped re-samples for each of our threespread decomposition models.
6. Results
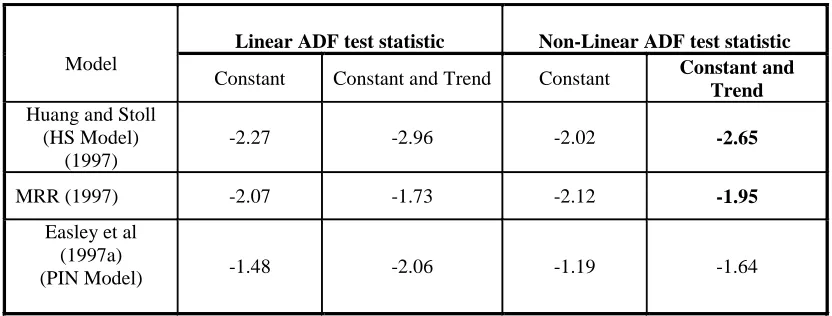
The linear ADF results can be seen in columns two and three of Table 1. The evidence indicates
that for all spread decomposition models, the null hypothesis of a unit root cannot be rejected
in all cases. When, in addition to the constant,
0, we incorporate a linear trend the puzzlingunit root evidence remains prevalent. Overall, the linear ADF tests provide strong evidence of
unit root in the deviations of predicted stock prices from the actual informed trade prices.
The linear unit root test results are presented in columns four and five of Table 1. The
non-linear ADF tests show that the deviations of predicted prices from the actual informed trade
prices are non stationary at all significance levels. The decisive acceptance of the null-unit root
appears to be the result of the non significant change in the magnitude of the estimated ADF
coefficient,
. This finding holds across all spread decomposition models and is not affectedby the inclusion of a linear trend in the regressions.
Hence, the puzzling unit root evidence of linear tests does not disappear when we allow
for non-linear adjustment in predicted stock prices of informed trades. This suggests that
Pag
e
18
serious concerns when spread decomposition models are used to predict informed trades in the
market microstructure literature. Given that they are used on an extensive basis, there is a clear
need for an alternative spread decomposition model that is compliant with the efficient market
hypothesis.
[INSERT TABLE 1 HERE]
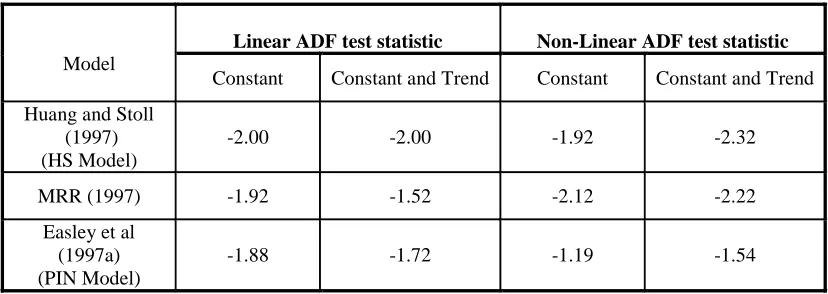
As a further confirmation of the validity of the findings we conduct two robustness tests. First,
we look at large (block) transactions consisting of trades of 10,000 shares or more per
transaction.4 Block trades consist primarily of institutional transactions and account for over
60% of total trades on the London Stock Exchange. The results of block trades can be seen in
Table 2. We observe from Table 2 that the previous results remain intact, suggesting that
predicted informed trade prices do not adapt back to the observed stock price of trades
conducted by informed agents for large transactions. This implies that there could be a major
liquidity problem for larger trades given that market makers cannot establish if their counter
parties are informed or noise traders.
[INSERT TABLE 2 HERE]
Finally, given that Alzahrani, Gregoriou, and Hudson (2013) and Frino, Jarnecic, and Lepone
(2007) report intraday effects for block trades for consistency, we introduce trading hour, day
of week and month of year dummy variables in equations (5) and (7) in order to capture trading
time/period effects. The results which can be seen in Table 3 are quantitatively similar to Tables
1 and 2, indicating that the unit root results are not affected by these anomalies in the data. This
further confirms the requirement for a more accurate information asymmetry model to establish
if trades are undertaken by informed agents or noise traders.
e
19
[INSERT TABLE 3 HERE]
7. Conclusion
Over the last 15 years researchers and practitioners have been estimating bid-ask spread
decomposition models to encapsulate informed trades. However, whether based on
assumptions of market efficiency or the existence of important behavioural factors, the
literature suggests that the efficacy of spread decomposition models warrants further
examination. In this study we inspect how accurate these models are in estimating informed
trades, by examining the empirical relationship between trades undertaken by informed agents
(managers) and the proxies for informed trades computed by market microstructure models.
We find overwhelming evidence of non stationary patterns between the deviation of actual and
predicted informed trade prices. Our results are robust to non linear speed of adjustments of
stock prices, trade sizes, trading time and calendar anomalies. We conclude therefore that
current approaches to identifying informed trades from spreads are inaccurate and that an
alternative model is needed. Given the importance of stock market liquidity and the extensive
use of spread decomposition models in predicting informed trades, we believe that the research
conducted in our paper is an important contribution to the literature on market microstructure
and signposts a direction for future research.
Pag
e
20
Alzahrani, A, A. Gregoriou, and R. Hudson. 2013. Price Impact of Block Trades in the Saudi
Stock Market. Journal of International Financial Markets, Institutions and Money, 23, 322–
341.
S. Amini, B. Gebka, R Hudson and K. Keasey. 2013 ‘A Review of the international literature on the
short term predictability of stock prices conditional on large prior price changes: microstructure,
behavioral and risk related explanations’, International Review of Financial Analysis, 26, pp. 1-17,
2013,
Antoniou, A, Koutmos, G and G Pescetto, 2011, Testing for Long Memory in the Feedback
Mechanism in the Futures Markets Review of Behavioral Finance, 3: 78–90
Attig N, Fong W. M, Gadhoum Y, and L.H.P. Lang, 2006 Effects of large shareholding on
information asymmetry and stock liquidity Journal of Banking & Finance 30, 2875–2892
Baker, M., Wurgler, J. (2006). Investor Sentiment and the Cross-Section of Stock Returns.
Journal of Finance, 61, 1645-1680.
Bhar, R and A.G. Malliaris, 2011, Dividends, Momentum, and Macroeconomic Variables as
Determinants of the US Equity Premium Across Economic Regimes, Review of Behavioral
Finance, 3: 27–53
Caginalp, G, Porter, D and V. L. Smith, 2000, Overreactions, Momentum, Liquidity, and Price
Bubbles in Laboratory and Field Asset Markets, Journal of Psychology and Financial Markets,
1:1, 24-48
Callahan, C., C. Lee, and T. Yahn, 1997. Accounting information and bid-ask spreads.
Accounting Horizons 11, 50-60.
Chan, L.K.C, Jegadeesh, N. and J, Lakonishok, 1996, Momentum Strategies
Journal Of Finance 51, 5, 1681-1713
Chen, JH and C X. Jiang 2003 Bid-Ask Spreads, Information Asymmetry, and Abnormal
Investor Sentiment: Evidence from Closed-End Funds Review of Quantitative Finance and
e
21
Choi, J. Y., D. Salandro, and K. Shastri, 1988, On the Estimation of Bid-Ask Spreads: Theory
and Evidence, Journal of Financial and Quantitative Analysis, 23, 219-230.
Demsetz, H, 1968. The Cost of Transacting, Quarterly Journal of Economics, 82, 33-53.
Easley, D., N. Kiefer, and M. O'Hara. 1997a. The information content of the trading process.
Journal of Empirical Finance, 4, 159-186.
Duxbury, D. 2015a, Behavioral finance: insights from experiments i: theory and financial
markets, Review of Behavioral Finance, 7, 1, 78-96.
Duxbury, D. 2015b, Behavioral finance: insights from experiments ii: theory and financial
markets, Review of Behavioral Finance, 7, 2, 151-175.
Easley, D., N. Kiefer, and M. O'Hara. 1997b. One day in the life of a very common stock. The
Review of Financial Studies, 10, 805-835
Frijns, B, Gilbert, A and A Tourani-Rad 2008. Insider trading, regulation and the components
of the bid–ask spread The Journal of Financial Research, 31,3, 225-246
Frino, A, Jarnecic, E and A. Lepone, 2007. The Determinants of the Price Impact of Block
Trades: Further Evidence, Abacus 43, 94–106.
Gagnon, MH. and G. J. Power 2016. Testing for changes in option-implied risk aversion,
Review of Behavioral Finance, 8, 1, 58-79
Glosten, L. R., and L. E. Harris, 1988, Estimating the Components of the Bid-Ask Spread,
Journal of Financial Economics, 21, 123-142.
Granger, C.W.J. and T. Terasvirta, 1993. Modelling nonlinear economic relationships, Oxford:
Oxford University Press.
Gregoriou, A, 2008. The Asymmetry of the Price Impact of Block Trades and the Bid-Ask
Pag
e
22
Hasbrouck, J., 1988, Trades, quotes, inventories and information. Journal of Financial
Economics 22, 229-252
Huang, R.D, and H.R. Stoll, 1997, The Components of the Bid-Ask Spread: A General
Approach, Review of Financial Studies, 10, 995-1034.
Jegadeesh, N and S Titman, 1995, Short-Horizon Return Reversals and the Bid-Ask Spread.
Journal of Financial Intermediation 4, 116-132.
Jiang, C. X, Chen, JH, Kim, JC and Mcinish, T. H. 2003 Bid-Ask Spreads, Information
Asymmetry, and Abnormal Investor Sentiment: Evidence from Closed-End Funds
Review of Quantitative Finance and Accounting, 21: 303–321
Kapetanios, G., Shin, Y. and A. Snell, 2003. Testing for a unit root in the non-linear STAR
framework, Journal of Econometrics 112, 359-379.
Lee, C. M. C, Mucklow, B, and M. J Ready, 1993, Spreads, Depths, and the Impact of Earnings
Information: An Intraday Analysis: Review of Financial Studies 6, 2, 345-374
Lin, J. G. Sanger and G.G. Booth. 1995. Trade Size and Components of the Bid-Ask Spread.
Review of Financial Studies, 8, 1153-1183.
Madhavan, A, and M. Cheng. 1997. In Search of Liquidity: Block Trades in the Upstairs and
and Downstairs Markets.” The Review of Financial Studies 10, 175–203.
Madhavan, A. M. Richardson, and M. Roomans. 1997. Why do Security Prices Change? A
transaction-level analysis of NYSE stocks. Review of Financial Studies, 10, 1035-1064.
Park, C-H., Irwin, S. H. (2007). What do we know about the profitability of technical analysis?
Journal of Economic Surveys, 21,786-826.
Tinic, S.M, 1972. The Economics of Liquidity Services, Quarterly Journal of Economics, 86,
e
23
Roll, R., 1984, A Simple Implicit Measure of the Effective Bid-Ask Spread in an Efficient
Market, Journal of Finance, 39, 1127-1139.
Spyros Spyrou , (2013) "Herding in financial markets: a review of the literature", Review of Behavioral
Finance, Vol. 5 Iss: 2, pp.175 - 194
Stoll, H.R., 1989, Inferring the Components of the Bid-Ask Spread: Theory and Empirical
Tests, The Journal of Finance, 44, 1, 115-134
Van Ness, B.F, R.A. Van Ness and R.S.Warr, 2001. How Well Do Adverse Selection
[image:24.595.80.496.420.578.2]Components Measure Adverse Selection? Financial Management, 30, 77-98.
Table 1: Unit root test results on all trades.
Note:
(a) ) The number of lagged difference terms in the regressions was chosen by the reduction criterion.
(b) The reported t-statistics test the null hypothesis that price differentials contain a unit root. **, *
indicate rejection of the null-unit root hypothesis at 1, 5% level of significance. Model
Linear ADF test statistic Non-Linear ADF test statistic
Constant Constant and Trend Constant Constant and
Trend
Huang and Stoll (HS Model)
(1997)
-2.27 -2.96 -2.02 -2.65
MRR (1997) -2.07 -1.73 -2.12 -1.95
Easley et al (1997a)
Pag
e
[image:25.595.81.495.98.245.2]24
Table 2: Unit root test results on block trades.
Note:
(a) ) The number of lagged difference terms in the regressions was chosen by the reduction criterion.
(b) The reported t-statistics test the null hypothesis that price differentials contain a unit root. **, *
indicate rejection of the null-unit root hypothesis at 1, 5% level of significance. Model
Linear ADF test statistic Non-Linear ADF test statistic
Constant Constant and Trend Constant Constant and Trend
Huang and Stoll (1997) (HS Model)
-2.00 -2.00 -1.92 -2.32
MRR (1997) -1.92 -1.52 -2.12 -2.22
Easley et al (1997a) (PIN Model)
[image:25.595.82.493.438.584.2]-1.88 -1.72 -1.19 -1.54
Table 3: Unit root test results on block trades with time/ calender effects.
Note:
(a) ) The number of lagged difference terms in the regressions was chosen by the reduction criterion.
(b) The reported t-statistics test the null hypothesis that price differentials contain a unit root. **, *
indicate rejection of the null-unit root hypothesis at 1, 5% level of significance. Model
Linear ADF test statistic Non-Linear ADF test statistic
Constant Constant and Trend Constant Constant and Trend
Huang and Stoll (1997) (HS Model)
-1.37 -1.87 -2.11 -2.27
MRR (1997) -1.44 -1.59 -2.01 -1.90
Easley et al (1997a) (PIN Model)