http://dx.doi.org/10.4236/jep.2015.66052
How to cite this paper: Mehari, T.F., Greene, L., Duncan, A.L. and Fakayode, S.O. (2015) Trace and Macro Elements Con-centrations in Selected Fresh Fruits, Vegetables, Herbs, and Processed Foods in North Carolina, USA. Journal of Environ-mental Protection, 6, 573-583. http://dx.doi.org/10.4236/jep.2015.66052
Trace and Macro Elements Concentrations
in Selected Fresh Fruits, Vegetables, Herbs,
and Processed Foods in North Carolina, USA
Tsdale F. Mehari, LaVana Greene, A’ja L. Duncan, Sayo Olawale Fakayode
*Department of Chemistry, North Carolina A&T State University, Greensboro, NC, USA Email: *[email protected]
Received 4 April 2015; accepted 14 June 2015; published 18 June 2015
Copyright © 2015 by authors and Scientific Research Publishing Inc.
This work is licensed under the Creative Commons Attribution International License (CC BY). http://creativecommons.org/licenses/by/4.0/
Abstract
Fresh fruits, vegetables, herbs, and processed foods continue to be the major sources of essential trace elements in humans’ diet required for proper body development. However, food products can potentially be contaminated by toxic heavy metals (HMs) from environmental contamination or industrial food processing. The deleterious health implications of essential trace and macro elements’ deficiency and toxic consequences of HMs in humans necessitate proactive monitoring of the essential trace elements and HMs concentrations in the humans diet to ensure public health safety. Accordingly, this study investigated a comparative analysis of essential elements and po-tential toxic HMs concentration in food products in the Greensboro metropolis, North Carolina, USA. A total of 49 food samples comprising of 16 difference fresh fruits, 17 fresh vegetables, 4 herbs, and 12 processed foods were purchased from local grocery stores and analyzed for iron (Fe), calcium (Ca), magnesium (Mg), nickel (Ni), zinc (Zn), copper (Cu), lead (Pb), cadmium (Cd), and chromium (Cr) by the use of flame atomic absorption spectrometry (FAAS). The concentra-tions of elements were subjected to a regression analysis to further gain insight of the inter-ele- ment association in the food samples. The results of the study showed high variability in the con-centrations of elements in the fresh fruits, vegetables, herbs, and processed foods. The overall
av-erage concentrations of Ca (1501 μg/g), Mg (186.5 μg/g), Fe (55.8 μg/g), Zn (22.2 μg/g), Pb (10.2
μg/g), Cu (5.8 μg/g), Cr (<0.1 μg/g), Cd (<0.1 μg/g), and Ni (<0.04 μg/g) were obtained in all food
samples categories. The elements concentrations were generally poorly correlated in the food
samples. However, a strong inter-element association between Cu and Fe concentration (R2 =
1.000) and a weak association between Ca and Fe (R2 = 0.5609) were found in the food samples. A
survey questionnaire was administered to 396 participants in the Greensboro metropolis to
eva-luate the food consumption pattern and a daily/weekly dietary estimate intake of vegetables, fruits, herbs and processed foods. The results of the food survey analysis showed that the amount
of vegetables, fruits, herbs, and processed foods dietary intake varied widely. In general, the par-ticipants consumed more processed foods than vegetables, fruits, and herb foods. The low dietary intake of vegetables, fruits, herbs suggests that most participants may be obtaining insufficient essential trace elements and other vital nutrients necessary for normal growth and body devel-opment in their diet.
Keywords
Foods Trace-Elements-Analysis, Atomic-Absorption Spectroscopy, Inter-Element-Association,
Daily/Weekly-Dietary Intake Estimate, Foods-Consumption-Pattern-Recognition
1. Introduction
Fresh fruits, vegetables, herbs, and processed foods are major sources of essential trace elements in the human diet and are required for proper growth and body development [1]. Essential trace elements are required in trace amounts in the humans body for biochemical and physiological functions [1]-[5]. For instance, zinc (Zn) plays a significant role as a co-enzyme for carboxyl peptidase, liver alcohol dehydrogenase, and carbonic anhydrase [4] [6]. Copper (Cu) is required for redox enzymes cytochrome oxidase [4] [7] [8]. Iron (Fe) is also a trace element found in the heme proteins hemoglobin and myoglobin [4] [9] [10]. A relatively small amount of Ni is required to aid in the absorption of Fe in the body. However, high Ni concentrations can interfere with Zn, magnesium (Mg), and calcium (Ca) utilization and metabolism [4] [11]. Other elements such as Ca and Mg are essential macro-elements required for bone structure development and necessary for carbohydrate and protein metabolism [1] [2] [4]. Calcium and Mg are also required in fairly large amounts to maintain body electrolytes and tissue homeostasis [2] [4]. Trace element deficiencies in humans have been associated with weak bone and teeth de-velopment, mental retardation, child developmental issues, anemia, insomnia, decreased immune function, and other health related complications [4] [7] [8] [12]-[15]. Increased intake of fruits, vegetables, and fresh herbs are also vital to maintain propernutrition as they are good sources of fiber, antioxidants, and vitamins [7] [16]-[18].
However, food crops, and processed foods can potentially be contaminated by toxic heavy metals (HMs) from environmental contamination or during industrial food processing. For instance, food crops can be contaminated through absorption and bioaccumulation of HMs from contaminated soils, fertilizers, and contaminated water sources used for irrigation [3] [6] [7] [16] [17] [19]-[28]. Food products can also be contaminated by leakage of HMs from food packaging materials or through cross-contaminations during industrial food processing [1] [26]-[28]. Unlike essential trace elements, HMs have no nutritional value and are non-biodegradable. Heavy metals can also be bio-accumulated and biomagnified in several organs such as the kidneys and cardiovascular system [24]-[27] [29] [30]. Elevated concentrations of HMs in humans have been associated with chronic and acute health issues such as cancer diseases, depression, hematic, gastrointestinal and renal failure, osteoporosis, tubu-lar and glomerutubu-lar dysfunctions, femoral pain, skeletal deformations, and low intelligent quotients in children [1] [4] [7] [10] [26] [31] [32]. Humans can potentially be exposed to HMs poisoning through various routes, in-cluding the consumption of HMs contaminated foods, industrial and environmental pollution, or occupational exposure [1] [4] [7] [26] [28] [33].
was also investigated. The trace elements and HMs concentrations in this study were further compared to the concentrations of these elements in food products from other countries. In addition, a voluntary survey ques-tionnaire was administered to 396 participants in the Greensboro metropolis to further evaluate the food con-sumption pattern and to estimate the daily/weekly dietary intake of vegetables, fruits, herbs and processed foods. The participants’ age ranged between 15 and 39 years. The survey questionnaire did not contain any personal data or information to protect the identity of the participants.
2. Material and Methods
2.1. Food Sample Collection and Sample Preparation
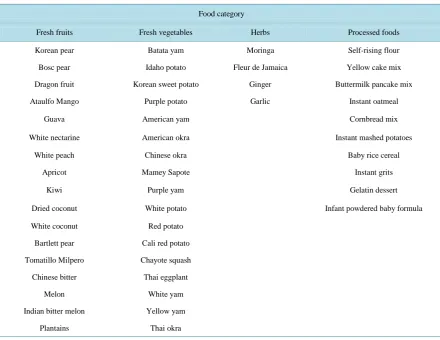
[image:3.595.90.531.379.719.2]A total of 49 food samples comprising of 16 fresh fruits, 17 fresh vegetables, 4 herbs, and 12 processed foods shown in Table 1 were purchased at local grocery store in Greensboro, NC. The food samples were placed in previously nitric acid washed plastic bags and immediately refrigerated prior to laboratory analysis to protect the food sample integrity and to prevent food sample decomposition or microbial growth. The food samples were diced into small pieces, placed in sterilized crucibles, and oven dried (Fisher Scientific Isotemp oven) at 55˚C for approximately 24 hours. The oven dried food samples were subsequently ground with mortar and pestle. A known weight of each dried food sample was digested with 6M HNO3(trace element grade, Fisher, NY) solu-tion in a digessolu-tion flask for approximately 5 - 6 hours to ensure complete sample digessolu-tion. The nitric acid di-gested food samples were cooled to room temperature, filtered with Whatman filter paper and diluted to the mark with de-ionized water in a 50-ml volumetric flask. The statistical data analysis, regression analysis, and pattern recognition of inter-element association in the food samples for were performed using chemometric software (The Unscrambler, CAMO Inc., 9.4).
Table 1.Food samples and food category.
Food category
Fresh fruits Fresh vegetables Herbs Processed foods
Korean pear Batata yam Moringa Self-rising flour
Bosc pear Idaho potato Fleur de Jamaica Yellow cake mix
Dragon fruit Korean sweet potato Ginger Buttermilk pancake mix
Ataulfo Mango Purple potato Garlic Instant oatmeal
Guava American yam Cornbread mix
White nectarine American okra Instant mashed potatoes
White peach Chinese okra Baby rice cereal
Apricot Mamey Sapote Instant grits
Kiwi Purple yam Gelatin dessert
Dried coconut White potato Infant powdered baby formula
White coconut Red potato
Bartlett pear Cali red potato
Tomatillo Milpero Chayote squash
Chinese bitter Thai eggplant
Melon White yam
Indian bitter melon Yellow yam
2.2. Calibration Curve, Trace Element Analysis, and Statistical Data Analysis
Working range standard solutions of Pb, Cd, Ca, Mg, Ni, Zn, Cu, Cr, and Fe were prepared by serial dilution of 1000 μg/g standard stock solution of each element. The standard and the sample solutions were subjected to flame atomic absorption spectrometric (FAAS) analysis using the flame atomic absorption spectrometer (Ther-mo Scientific, ICE 3000 series).A calibration curve was constructed for each element by plotting the absorbance of each element versus the element concentration. The constructed calibration curves were subsequently utilized to determine the concentration of each element in the food samples.
3. Results and Discussion
3.1. Calibration Curves
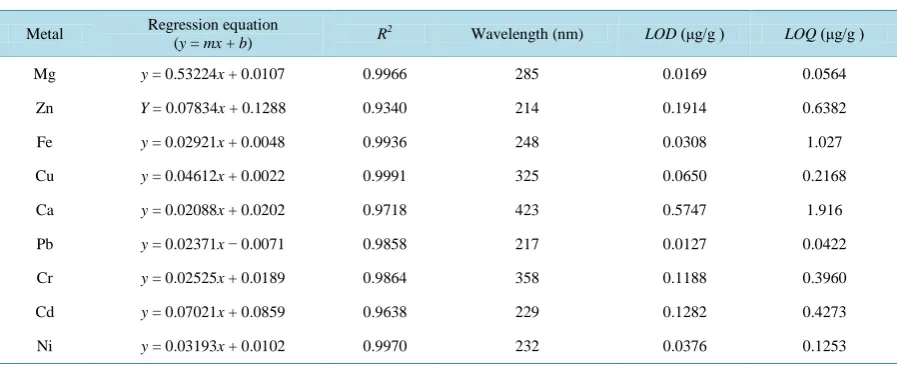
The summary of the calibration curve parameters showing the linear regression equations, the square correlation coefficient (R2) values, wavelengths of detection, limits of detection (LOD), and limits of quantification (LOQ) for each element analyzed is presented in Table 2. The LOD and LOQ was determined as 3 s/m and 10 s/m, re-spectively, where s is the standard deviation of the absorbance of the triplicate blank solution analysis and m is the slope of the calibration curve for each element. The obtained R2values of the calibration curves ranged be-tween 0.934 for Fe and 0.9991 for Cu. The high R2values demonstrate high linear correlations between the ab-sorbance and element concentrations. The LODranged between 0.01 μg/g for Pb and 0.6 μg/g for Ca. However,
the values of LOQranged between 0.4 μg/g and 1.9 μg/g for Pb and Ca, respectively.
3.2. Overall Trace Elements Concentrations in Food Samples
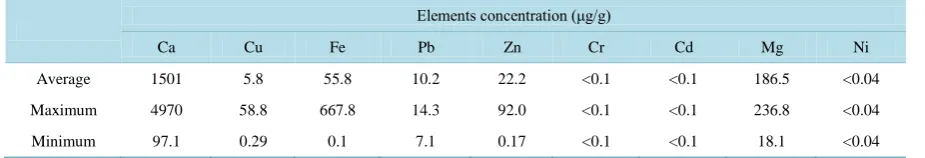
[image:4.595.88.537.536.719.2]The overall concentrations of the elements in all food samples are shown in Table 3. The concentrations of Ca in all food samples ranged between 97 μg/g and 4970 μg/g, with an overall average Ca concentration of 1501 μg/g. As expected, the highest average Ca concentration was observed in processed infant formula, with an av-erage Ca concentration of 4970 μg/g. The highest concentration of Fe from all food samples was also found in processed foods, with a maximum Fe concentration of 367 μg/g. High Fe concentrations in the processed foods is expected as several sample packages denoted the samples were fortified with Fe on the label. The overall concentrations of Mg ranged between 18 μg/g and 236.8 μg/g, with an overall average Mg concentration of 186.5 μg/g in all food samples. Relatively much lower average concentrations of 55.8 μg/g, 22.2 μg/g, 10.2 μg/g, and 5.8 μg/g were obtained for Fe, Zn, Pb, and Cu, respectively. The overall concentrations of Cr, Cd, and Ni were below the detection limit of 0.1 μg/g, 0.1 μg/g and 0.04 μg/g, respectively. The highest concentrations of Cu, Fe, Pb, Zn, and Mg were found in apricot, moringa, yellow yam, American okra, and Chinese okra, respec-tively. On the contrary, the lowest concentrations for Ca, Cu, Pb, Zn, and Mg were found in plantains, Mamey-Sapote, American yam, and Good Start baby formula, respectively.
Table 2. Calibration curve, variable an parameters.
Metal Regression equation
(y = mx + b) R
2 Wavelength (nm) LOD (μg/g ) LOQ (μg/g )
Mg y = 0.53224x + 0.0107 0.9966 285 0.0169 0.0564
Zn Y = 0.07834x + 0.1288 0.9340 214 0.1914 0.6382
Fe y = 0.02921x + 0.0048 0.9936 248 0.0308 1.027
Cu y = 0.04612x + 0.0022 0.9991 325 0.0650 0.2168
Ca y = 0.02088x + 0.0202 0.9718 423 0.5747 1.916
Pb y = 0.02371x − 0.0071 0.9858 217 0.0127 0.0422
Cr y = 0.02525x + 0.0189 0.9864 358 0.1188 0.3960
Cd y = 0.07021x + 0.0859 0.9638 229 0.1282 0.4273
Table 3. Overall average trace elements concentrations in all food samples.
Elements concentration (μg/g)
Ca Cu Fe Pb Zn Cr Cd Mg Ni
Average 1501 5.8 55.8 10.2 22.2 <0.1 <0.1 186.5 <0.04
Maximum 4970 58.8 667.8 14.3 92.0 <0.1 <0.1 236.8 <0.04
Minimum 97.1 0.29 0.1 7.1 0.17 <0.1 <0.1 18.1 <0.04
3.3. Trace Elements Concentrations in Different Classes of Food Categories
3.3.1. Trace Elements Concentrations in Fruit SamplesThe concentrations of elements in the fruit samples category are shown in Table 4. An overall average concen-tration of Ca (1024 μg/g), Mg (191.7 μg/g), Zn (15 μg/g), Fe (13 μg/g), and Cu (6.2 μg/g) were recorded in the fruit sample category. The concentrations of Ca found in the fruit samples were comparatively larger than the concentrations of Fe and Mg in the fruit samples. The highest Ca concentration was obtained in the Momordica group; containing Chinese and Indian bitter melons, kiwi, Ataulfo mango, and Dragon fruit. The highest con-centrations of Ca, Cu, Fe, Zn, and Mg were found in apricot, white coconut, and Ataulfo mango. However, rela-tively low average concentrations of Ca, Cu, Fe, Pb, Zn, and Mg were detected in plantains, Indian bitter melon, and Bartlett pear. The concentrations of Cr, Cd, and Ni were below the detection limits of 0.1, 0.1 and 0.04 μg/g, respectively. An overall average Pb concentration of 10 μg/g was found in the fruit samples category. The high-est Pb concentration was found in white coconut (13.4 μg/g) while the lowest Pb concentration of 4.1 μg/g found in Chinese bitter melon. An average Pb concentration of 6.98 μg/g in melon obtained in this study was much lower than the reported 19.2 μg/g Pb level in melon from Algeria but it is comparable to the average Pb concen-trations of 9.2 μg/g and 10 μg/g found in fruits elsewhere [35]. Lead is naturally present in the earth crust in trace amounts. The low Pb concentrations detected in fruits could be due to natural absorption of Pb from soil. However, Pb bioaccumulation from irrigation practices and/or food transported from other countries may also be contributing to the levels of Pb detected in the food samples.
3.3.2. Trace Elements Concentrations in Vegetable and Herbs Products
The range and the average elements concentrations in vegetables and herbs foods are presented in Table 5. Once again, the element concentrations are widely varied as demonstrated by the large range of concentrations of ele- ments in the vegetables and herbs food samples. The average concentration of Ca (1490 μg/g), Mg (191 μg/g), Fe (60 μg/g), Zn (25 μg/g), and Cu (6.8 μg/g), was obtained in the vegetables and herbs food category. The con-centrations of Ni, Cr and Cd were also below the detection limit of 0.04 μg/g, 0.1 μg/g in the vegetables and herbs food samples. An overall average Pb concentration in vegetable and herbs foods category was 11 μg/g. The highest Pb concentration of 27 μg/g was found in ginger. However, the lowest Pb concentration of 9.0 μg/g was recorded in Thai okra. The Pb concentrations in potatoes are comparatively lower than the Pb detected in the food samples in Algeria [35] but higher than those found in the food samples in China [36], Spain [37], Pa-kistan [38], and Brazil [39]. The Pb concentrations in okra found in this present study are comparable to 10.7 μg/g Pb reported in Turkey [40]but lower than the 25 μg/g Pb concentrations reported in foods samples found in India [18]. The concentrations of Cu found in okra and eggplant in this study were approximately three times smaller than the concentrations of Cu reported in okra food samples in Turkey. However, the Zn concentrations found in eggplant in this study are similar to the Zn concentrations in eggplant from Turkey [40] and Egypt [3].
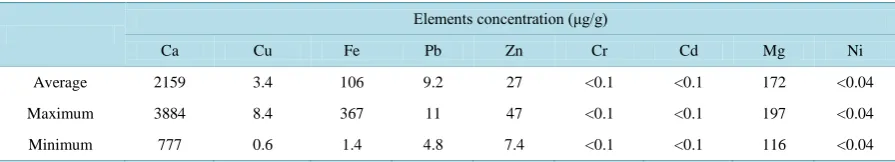
3.3.3. Trace Elements Concentrations in Processed Foods
Table 4. Summary of the average trace elements concentrations in fruits.
Elements concentration (μg/g)
Ca Cu Fe Pb Zn Cr Cd Mg Ni
Average 1024 6.2 13 10 15 <0.1 <0.1 191.7 <0.04
Maximum 2348 30 36 13 37 <0.1 <0.1 204.3 <0.04
Minimum 339 1.4 1.1 4.1 5.7 <0.1 <0.1 167.8 <0.04
Table 5. Summary of the average trace elements concentrations in vegetables and herbs.
Elements concentration (μg/g)
Ca Cu Fe Pb Zn Cr Cd Mg Ni
Average 1490 6.8 60 11 25 <0.1 <0.1 191 <0.04
Maximum 4006 16 387 27 65 <0.1 <0.1 213 <0.04
[image:6.595.89.537.315.396.2]Minimum 132 2.3 0.76 9 1.7 <0.1 <0.1 97 <0.04
Table 6. Summary of the average trace elements concentrations in processed foods.
Elements concentration (μg/g)
Ca Cu Fe Pb Zn Cr Cd Mg Ni
Average 2159 3.4 106 9.2 27 <0.1 <0.1 172 <0.04
Maximum 3884 8.4 367 11 47 <0.1 <0.1 197 <0.04
Minimum 777 0.6 1.4 4.8 7.4 <0.1 <0.1 116 <0.04
infant baby formula.
3.4. Inter-Element Associations in Food Samples
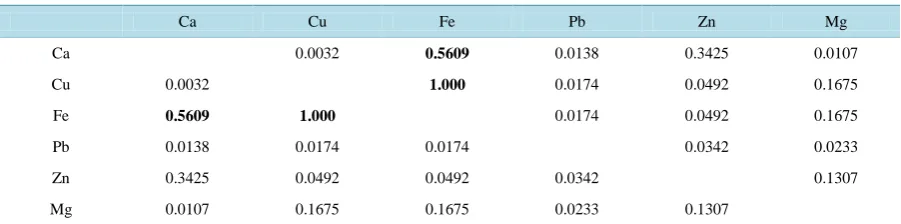
The trace element concentrations in the food samples were subjected to regression analysis to further gain in-sight of the inter-element associations in the food samples.Table 7 presents the summary of the square correla-tion coefficients (R2) of the inter-element associations in the food samples. The trace element concentrations were generally poorly correlated in the food samples. However, a strong association between Cu and Fe (R2 = 1.000) and a weak association (R2 = 0.5609) was observed between Ca and Fe in the food samples. The ob-served association between Cu and Fe and between Ca and Fe cannot be fully explained; however, the associa-tions suggest a common source of these elements, possibly from the soil. Associaassocia-tions between the elements al-so suggest that peoples who consume these food items will likely be obtaining Cu, Fe, and Ca simultaneously in their diet.
3.5. Quality Control, Analytical Method Validation, and Recovery Study
Table 7. Inter-element associations (square correlation coefficient, R2) in all food samples.
Ca Cu Fe Pb Zn Mg
Ca 0.0032 0.5609 0.0138 0.3425 0.0107
Cu 0.0032 1.000 0.0174 0.0492 0.1675
Fe 0.5609 1.000 0.0174 0.0492 0.1675
Pb 0.0138 0.0174 0.0174 0.0342 0.0233
Zn 0.3425 0.0492 0.0492 0.0342 0.1307
Mg 0.0107 0.1675 0.1675 0.0233 0.1307
collections were re-analyzed using the same food digestion and analytical protocol utilized previously for each element. The results of the elements concentrations in the initial food analysis favorably compared with the ele-ments concentrations in the new set of the food samples, demonstrating the precision and accuracy of the ana-lytical protocol for trace elements analysis in the food samples.
A spiked recovery was further conducted to evaluate the accuracy of the analytical protocol for trace element analysis. There were ten randomly selected and already analyzed food samples spiked with known concentra-tions of each element standard. The spiked food samples were taken through the entire nitric acid food digestion and FAAS trace element analysis as previously described. The recoveries of the metals in the spiked food sam-ples were evaluated by comparing the concentrations of the spiked metal with the concentrations detected from the spiked samples using FAAS spectrometry. The average percent spike recovery was calculated using a stan-dard protocol [41]. The calculated percent recovery study for the elements was within the acceptable 80% - 120% recovery range, further validating the results of this study.
3.6. Daily/Weekly
Dietary Intake Estimate of Vegetables, Fruits, Herbs and Processed
Foods
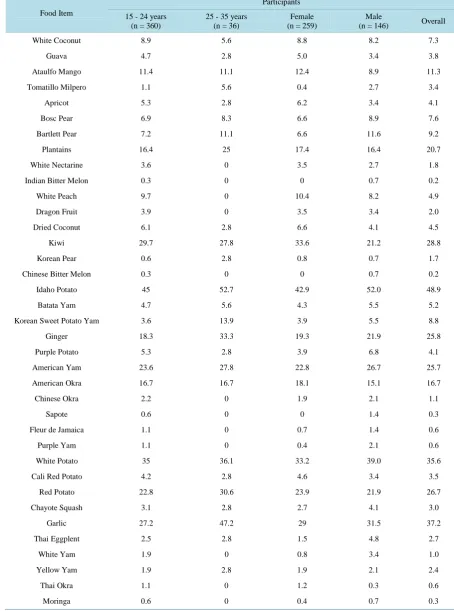
The results of the survey questionnaire analysis of the daily/weekly dietary intake estimate of vegetable, fruits, herbs and processed foods are shown in Table 8. The vegetable, fruit, herb and processed foods daily/weekly dietary intake estimate patterns of the participants were very similar irrespective of their age or sex. Also, the daily/weekly dietary intake estimates varied widely. In general, the participants consumed more potatoes and processed foods than any other food items. The participants reported a daily/weekly dietary intake of 48.9% for Idaho potatoes, 35.6% for white potatoes, and 40.7% for buttermilk pancake mix. Approximately 37% of the participants reported a daily/weekly dietary intake of instant grits while 31.0% of the participants reported a daily/weekly consumption of classic cornbread. Approximately 29.2%, 26.7%, and 22.5% of the participants reported a daily/weekly dietary intake of instant oatmeal, self-rising flour, and instant mashed potatoes, respec-tively. Also, 16.7%, 20.7%, 25.8%, 28.8%, and 37.2% of the participants reported a daily/weekly dietary intake of American okra, plantain, ginger, kiwi, and garlic, respectively. However, the daily/weekly dietary intake es-timate of other fruits and vegetables were very poor. The low daily/weekly dietary intake of vegetables, fruits, herbs suggests that most participants may be obtaining insufficient amounts of essential trace elements and other vital nutrients values necessary for normal growth and body development. However, the participants may obtain essential trace elements from other food sources and food supplements.
4. Conclusion
Table 8.The daily/weekly dietary intake estimate of vegetables, fruits, herbs and processed foods.
Food Item
Participants
15 - 24 years (n = 360)
25 - 35 years (n = 36)
Female (n = 259)
Male
(n = 146) Overall
White Coconut 8.9 5.6 8.8 8.2 7.3
Guava 4.7 2.8 5.0 3.4 3.8
Ataulfo Mango 11.4 11.1 12.4 8.9 11.3
Tomatillo Milpero 1.1 5.6 0.4 2.7 3.4
Apricot 5.3 2.8 6.2 3.4 4.1
Bosc Pear 6.9 8.3 6.6 8.9 7.6
Bartlett Pear 7.2 11.1 6.6 11.6 9.2
Plantains 16.4 25 17.4 16.4 20.7
White Nectarine 3.6 0 3.5 2.7 1.8
Indian Bitter Melon 0.3 0 0 0.7 0.2
White Peach 9.7 0 10.4 8.2 4.9
Dragon Fruit 3.9 0 3.5 3.4 2.0
Dried Coconut 6.1 2.8 6.6 4.1 4.5
Kiwi 29.7 27.8 33.6 21.2 28.8
Korean Pear 0.6 2.8 0.8 0.7 1.7
Chinese Bitter Melon 0.3 0 0 0.7 0.2
Idaho Potato 45 52.7 42.9 52.0 48.9
Batata Yam 4.7 5.6 4.3 5.5 5.2
Korean Sweet Potato Yam 3.6 13.9 3.9 5.5 8.8
Ginger 18.3 33.3 19.3 21.9 25.8
Purple Potato 5.3 2.8 3.9 6.8 4.1
American Yam 23.6 27.8 22.8 26.7 25.7
American Okra 16.7 16.7 18.1 15.1 16.7
Chinese Okra 2.2 0 1.9 2.1 1.1
Sapote 0.6 0 0 1.4 0.3
Fleur de Jamaica 1.1 0 0.7 1.4 0.6
Purple Yam 1.1 0 0.4 2.1 0.6
White Potato 35 36.1 33.2 39.0 35.6
Cali Red Potato 4.2 2.8 4.6 3.4 3.5
Red Potato 22.8 30.6 23.9 21.9 26.7
Chayote Squash 3.1 2.8 2.7 4.1 3.0
Garlic 27.2 47.2 29 31.5 37.2
Thai Eggplent 2.5 2.8 1.5 4.8 2.7
White Yam 1.9 0 0.8 3.4 1.0
Yellow Yam 1.9 2.8 1.9 2.1 2.4
Thai Okra 1.1 0 1.2 0.3 0.6
Continued
Instant Grits 37.5 36.1 35.1 39.7 36.8
Yellow Cake Mix 32.5 16.7 35.1 23.3 24.6
Enfamil Lipil 0 0 0 0 0
Good Start 0 0 0 0 0
Baby Rice Cereal 1.7 0 0.8 2.7 0.9
Gelatin Dessert 11.7 13.9 12.4 10.3 12.8
Instant Mashed Potatoes 31.1 13.9 30.9 26.7 22.5
Similac Advance 0 0 0 0 0
Instant Oatmeal 33.3 25 35.5 26.7 29.2
Buttermilk Pancake Mix 45.3 36.1 44.4 43.8 40.7
Classic Cornbread 36.9 25 37.1 33.6 31.0
Self-Rising Flour 22.8 30.6 25.1 21.9 26.7
lyzed food samples contained adequate essential trace elements concentrations required in humans diet. There is no evidence of heavy metal food contamination that can endanger the public safety or pose health risk to food consumers in the Greensboro metropolis. However, the small Pb concentrations detected in the food samples necessitate a continuous monitoring of the levels of Pb in food samples to ensure public safety. The daily/ weekly dietary intake estimate of vegetables, fruits, herbs and processed foods were investigated to evaluate the food consumption of the residents. The participants generally consumed more potatoes and processed foods than any other investigated fruits and vegetables. Future study includes analysis of food samples for other potentially dangerous elements such as mercury and arsenic.
Acknowledgements
This study was supported by National Science Foundation NSF-RIA Award # HRD-0927905. The efforts of Kiara McDaniel and James King during the sample preparation and AAS analysis is recognized and appreciated.
References
[1] Olu-Owolabi, B.I., Fakayode, S.O., Adebowale, K.O. and Onianwa, P.C. (2007) Proximate and Elemental Composi-tion and Their Estimated Daily Intake in Infant Formulae from Developed and Developing Countries: A Comparative Analysis. Journal of Food, Agriculture & Environment, 5, 40-44.
[2] Bourne, G.H. (1985) Minerals in Food and Nutritional Topics. S. Karger AG, Basel.
[3] Radwan, M.A. and Salama, A.K. (2006) Market Basket Survey for Some Heavy Metals in Egyptian Fruits and Vegeta-bles. Food Chemical Toxicology, 44, 1273-1278. http://dx.doi.org/10.1016/j.fct.2006.02.004
[4] Ismail, F., Anjum, M.R., Mamon, A.N. and Kazi, T.G. (2011) Trace Metal Contents of Vegetables and Fruits of Hyde-rabad Retail Market. Pakistan Journal of Nutrition, 10, 365-372. http://dx.doi.org/10.3923/pjn.2011.365.372
[5] Nasreddine, L., Nashalian, O., Naja, F., Itani, L., Parent-Massin, D., Nabhani-Zeidan, M. and Hwalla, N. (2010) Die-tary Exposure to Essential and Toxic Trace Elements from a Total Diet Study in an Adult Lebanese Urban Population.
Food and Chemical Toxicology, 48, 1262-1269. http://dx.doi.org/10.1016/j.fct.2010.02.020
[6] Scherz, H. and Kirchhoff, E. (2006) Trace Elements in Foods: Zinc Contents of Raw Foods—A Comparison of Data Originating from Different Geographical Regions of the World. Journal of Food Composition and Analysis, 19, 420- 433. http://dx.doi.org/10.1016/j.jfca.2005.10.004
[7] Saracoglu, S., Tuzen, M. and Soylak, M. (2009) Evaluation of Trace Element Contents of Dried Apricot Samples from Turkey. Journal of Hazardous Materials, 167, 647-652.
[8] Linder, M.C. and Hazegh-Azam, M. (1996) Copper Biochemistry and Molecular Biology. American Journal of Clini-cal Nutrition, 63, 797S-811S.
[10] Olawoyin, R., Oyewole, S.A. and Grayson, R.L. (2012) Potential Risk Effect from Elevated Levels of Soil Heavy Met-als on Human Health in the Niger Delta. Ecotoxicology and Environmental Safety, 85, 120-130.
http://dx.doi.org/10.1016/j.ecoenv.2012.08.004
[11] Coogan, T.P., Latta, D.M., Snow, E.T., Costa, M. and Lawrence, A. (1989) Toxicity and Carcinogenicity of Nickel Compounds. Critical Reviews in Toxicology, 19, 341-384. http://dx.doi.org/10.3109/10408448909029327
[12] Huang, S.C., Yang, Y.J., Cheng, C.N., Chen, J.S. and Lin, C.H. (2010) The Etiology and Treatment Outcome of Iron Deficiency and Iron Deficiency Anemia in Children. Journal of Pediatric Hematology/Oncology, 32, 282-285.
http://dx.doi.org/10.1097/MPH.0b013e3181d69b2b
[13] Tapiero, H. and Tew, K. D. (2003) Trace Elements in Human Physiology and Pathology: Zinc and Metallothioneins. Biomedicine & Pharmacotherapy, 57, 399-411. http://dx.doi.org/10.1016/S0753-3322(03)00081-7
[14] Prentice, A. (1993) Does Mild Zinc Deficiency Contribute to Poor Growth Performance? Nutrition Reviews, 51, 268- 270. http://dx.doi.org/10.1111/j.1753-4887.1993.tb03118.x
[15] ATSDR, Agency for Toxic Substance and Disease Registry (1994) Toxicological Profile for Zinc. US Department of Health and Human Services, Public Health Services, Division of Toxicology Information Branch, Atlanta.
[16] Hu, J., Wu, F., Wu, S., Cao, Z., Lin, X. and Wong, M.H. (2013) Bioaccessibility, Dietary Exposure and Human Risk Assessment of Heavy Metals from Market Vegetables in Hong Kong Revealed with an in Vitro Gastrointestinal Model.
Chemosphere, 91, 455-461. http://dx.doi.org/10.1016/j.chemosphere.2012.11.066
[17] Minkina, T.M., Motuzova, G.V., Mandzhieva, S.S. and Nazarenko, O.G. (2012) Ecological Resistance of the Soil- Plant System to Contamination by Heavy Metals. Journal of Geochemical Exploration, 123, 33-40.
http://dx.doi.org/10.1016/j.gexplo.2012.08.021
[18] Sharma, R.K., Agrawal, M. and Marshall, F.M. (2009) Heavy Metals in Vegetables Collected from Production and Market Sites of a Tropical Urban Area of India. Food and Chemical Toxicology, 47, 583-591.
http://dx.doi.org/10.1016/j.fct.2008.12.016
[19] Zaidi, M.I., Asrar, A., Mansoor, A. and Farooqui, M.A. (2005) The Heavy Metal Concentrations along Roadside Trees of Quetta and Its Effects on Public Health. Journal of Applied Sciences, 5, 708-711.
http://dx.doi.org/10.3923/jas.2005.708.711
[20] Marshall, F.M. (2004) Enhancing Food Chain Integrity: Quality Assurance Mechanism for Air Pollution Impacts on Fruits and Vegetables Systems. Crop Post Harvest Program, Final Technical Report (R7530).
[21] Wang, X., Sato, T., Xing, B. and Tao, S. (2005) Health Risk of Heavy Metals to the General Public in Tianjin, China via Consumption of Vegetables and Fish. Science of the Total Environment, 350, 28-37.
http://dx.doi.org/10.1016/j.scitotenv.2004.09.044
[22] Khan, S., Cao, Q., Zheng, Y.M., Huang, Y.Z. and Zhu, Y.G. (2008) Health Risk of Heavy Metals in Contaminated Soils and Food Crops Irrigated with Wastewater in Beijing, China. Environmental Pollution, 152, 686-692.
http://dx.doi.org/10.1016/j.envpol.2007.06.056
[23] Davydova, S. (2005) Heavy Metals as Toxicants in Big Cities. Microchemical Journal, 79, 133-136.
http://dx.doi.org/10.1016/j.microc.2004.06.010
[24] Jarup, L. (2003) Hazards of Heavy Metal Contamination. British Medical Bulletin, 68, 167-182.
http://dx.doi.org/10.1093/bmb/ldg032
[25] Sathawara, N.G., Parikh, D.J. and Agarwal, Y.K. (2004) Essential Heavy Metals in Environmental Samples from Western India. Bulletin of Environmental Contamination and Toxicology, 73, 756-761.
http://dx.doi.org/10.1007/s00128-004-0490-1
[26] Arnich, N., Sirot, V., Riviere, G., Jean, J., Noel, L., Guerin, T. and Leblanc, J.C. (2012) Dietary Exposure to Trace Elements and Health Risk Assessment in the 2nd French Total Diet Study. Food and Chemical Toxicology, 50, 2432- 2449. http://dx.doi.org/10.1016/j.fct.2012.04.016
[27] Monachese, M., Burton, J.P. and Reid, J. (2012). Bioremediation and Tolerance of Humans to Heavy Metals through Microbial Processes: A Potential Role for Probiotics? Applied and Environmental Microbiology, 78, 6397-6404.
http://dx.doi.org/10.1128/AEM.01665-12
[28] Liu, X., Song, Q., Tang, Y. and Li, W. (2013) Human Health Risk Assessment of Heavy Metals in Soil-Vegetable System: A Multi-Medium Analysis. Science of the Total Environment, 463, 530-540.
http://dx.doi.org/10.1016/j.scitotenv.2013.06.064
[29] WHO (1992) Environmental Health Criteria 134: Cadmium. World Health Organization, Geneva.
[30] Steenland, K. and Boffeta, P. (2000) Lead and Cancer in Humans: Where Are We Now? AmericanJournal of Indus-trial Medicine, 38, 295-299. http://dx.doi.org/10.1002/1097-0274(200009)38:3<295::AID-AJIM8>3.0.CO;2-L
Repair and Genotoxic Consequences (A Review). Biochimie, 88, 1549-1859.
http://dx.doi.org/10.1016/j.biochi.2006.10.001
[32] Finster, M.E., Gray, K.A. and Binns, H.J. (2004) Lead Levels of Edibles Grown in Contaminated Residential Soils: A Field Survey. Science of the Total Environment, 320, 245-257. http://dx.doi.org/10.1016/j.scitotenv.2003.08.009
[33] Calderon, J., Ortiz-Perez, D., Yanez, L. and Diaz-Barriga, F. (2003) Human Exposure to Metals. Pathways of Exposure, Biomarkers of Effect, and Host Factors. Ecotoxicology and Environmental Safety, 56, 93-103.
http://dx.doi.org/10.1016/S0147-6513(03)00053-8
[34] Fakayode, S.O. and Olu-Owolabi, I.B. (2003) Trace Metal Content and Estimated Daily Human Intake from Chicken Eggs in Ibadan, Nigeria. Archives of Environmental Health: An International Journal, 58, 245-251.
http://dx.doi.org/10.3200/AEOH.58.4.245-251
[35] Cherfi, A., Abdoun, S. and Gaci, O. (2014) Food Survey: Levels and Potential Health Risks of Chromium, Lead, Zinc, and Copper Contents in Fruits and Vegetables Consumed in Algeria. Food and Chemical Toxicology, 70, 48-53.
http://dx.doi.org/10.1016/j.fct.2014.04.044
[36] Song, B., Lei, M., Chen, T., Zheng, Y., Xie, Y., Li, X. and Gao, D. (2009) Assessing the Health Risk of Heavy Metals in Vegetables to the General Population in Beijing, China. Journal of Environmental Sciences, 21, 1702-1709.
http://dx.doi.org/10.1016/S1001-0742(08)62476-6
[37] Bosque, M.A., Schuhmacher, M., Domingo, J.L. and Llobet, J.M. (1990) Concentrations of Lead and Cadmium in Ed-ible Vegetables from Tarragona Province, Spain. Science of the Total Environment, 96, 61-67.
http://dx.doi.org/10.1016/0048-9697(90)90053-W
[38] Parveen, Z., Khuhro, M.I. and Rafiq, N. (2003) Market Basket Survey of Lead, Cadmium, Copper, Chromium, Nickel and Zinc in Fruits and Vegetables. Bulletin of Environmental Contamination and Toxicology, 71, 1260-1264.
http://dx.doi.org/10.1007/s00128-003-8640-4
[39] Santos, E.E., Lauria, D.C. and Porto da Silveira, C.L. (2004) Assessment of Daily Intake of Trace Elements Due to Consumption of Foodstuffs by Adult Inhabitants of Rio de Janeiro City. Science of the Total Environment, 327, 69-79.
http://dx.doi.org/10.1016/j.scitotenv.2004.01.016
[40] Demirezen, D. and Aksoy, A. (2006) Heavy Metal Levels in Vegetables in Turkey Are within Safe Limits for Cu, Zn, Ni, and Exceeded for Ca and Pb. Journal of Food Quality, 29, 252-256.
http://dx.doi.org/10.1111/j.1745-4557.2006.00072.x
[41] Keith, L.H., Crummett, W., Deegan Jr., J., Libby, R.A., Taylor, J.K. and Wentler, G. (1983) Principles of Environ-mental Analysis. Analytical Chemistry, 55, 2210-2218. http://dx.doi.org/10.1021/ac00264a003
[42] CDC (1988) Current Trends in Childhood Lead Poisoning—US: Report to Congress by the Agency for Toxic Sub-stances and Disease Registry. MMWR, 37, 481-485.
[43] Anjana, S.U., Iqbul, M. and Abrol, Y.P. (2007) Are Nitrate Concentrations in Leafy Vegetables within Safe Limits?
Current Science, 92, 355-360.
[44] Costa, M. and Klein, C.B. (2006) Toxicity and Carcinogenicity of Chromium Compounds in Humans. Critical Reviews of Toxicology, 36, 155-163. http://dx.doi.org/10.1080/10408440500534032