Facial Expression Recognition System using Statistical
Feature and Neural Network
Nazil Perveen
Student of M.tech Electrical Department NIT Raipur, Chhattisgarh IndiaShubhrata Gupta
Associate Professor Electrical Department NIT Raipur, Chhattisgarh IndiaKesari Verma
Assistant Professor Department of ComputerApplications
NIT Raipur, Chhattisgarh India
ABSTRACT
In this paper, a new technique for facial expression recognition is proposed which uses the statistical feature of the whole face and classify the expression using neural network classifier. When the face image is input, region of interest (ROI) is being obtained to evaluate the statistical feature of the face. Using these, features we classify the face into one of the seven different expressions by using multi label Back Propagation neural network classifier. To demonstrate the proposed recognition technique we use JAFFE facial database and the whole program is being implemented in MATLAB 7.0.
General Terms
Pattern Recognition.
Keywords
Back-propagation algorithm, facial expression recognition, multi-label neural network, region of interest and statistical feature extraction.
1.
INTRODUCTION
Facial expression recognition has attracted much attention in recent years. The ultimate objective of facial expression recognition (FER) has been the realization of intelligent and transparent communications between human and machines. The FER is the base of affective computing as it is use to recognize the human expression effectively. Human facial expressions contain extremely abundant information of human behaviors and play a crucial role in interpersonal communication.
In 1978, Paul Ekman and Wallace V. Freisen implemented Facial Action Coding System (FACS) [1], which, is the most widely used method available. In FACS, they analyzed there are in total six basic facial expression, which include, happy, sad, angry, fear, disgust and surprise. Over the year 90‟s different researches have been proposed, [2]-[8] the different papers are available for facial expression recognition.
2.
RELATED WORK
Several techniques had been implemented to devise facial expression recognition using neural network. In 2007, Tai and Chung [9] proposed automatic FER system using „Elman Neural Network‟ with accuracy in recognition rate is 84.7%, in which they extracted the features using canthi detection technique. In 1999, Chen and Chang [10] proposed FER system using „Radial Basis Function and Multi-layer
Perceptron‟ with accuracy in recognition rate is 92.1%, in which they extracted the facial characteristic points of the 3 organs. In 2004, Ma and Khorasani[11], proposed FER system using „Constructive FeedForward Neural Networks‟ with accuracy in recognition rate is 93.75%. In 2011, Chaiyasit, Philmoltares and Saranya [12], proposed FER system using „Multilayer Perceptron with Back Propagation Algorithm‟ with recognition rate 95.24%, in which they implements graph based facial features.
GengXueet. Al. [12] has proposed the Facial Expression Recognition Based on the Difference of Statistical Features. The author used Principal Component Analysis (PCA) and Linear Discriminant Analysis (LDA). The result using PCA+ LDA forjaffe data set is 61.11%. Le Hoang Thai [14] et. Al. proposed hybrid method by combining ANN, principal component and artificial Neural Network (Canny_PCA_ANN) and found 85.7% accuracy. Support Vector Machine based facial expression classification method was proposed byPhilipp Michel [15] that shows the 87.5% for Jaffe dataset. Ying Ziluet. Al. [16] proposed Non-negative MatrixFactorization (NMF) and Support Vector Machine (SVM) based method for facial recognition.
3.
METHODOLOGY
3.1
Preprocessing
Table1.Deducing ROI from the input face images
Input Image (256×256) ROI images (161×111)
Fig 1: Methodology followed to implement Facial Expression Recognition System.
3.2
Extracting Statistical Feature of Image
Once the region of interest is obtained from the input image we determine the statistical feature of the cropped image is evaluated. In this paper, we determine the following statistical
3.2.1
Kurtosis
Kurtosis is a measure of whether the data are peaked or flat relative to a normal distribution, that is, data sets with high kurtosis tend to have a distinct peak near the mean, decline
Input Image Preprocessing of the Image
Evaluating Statistical Features of the Image
Training Using Neural Network (Back
Propagation Algorithm)
Training of Training Dataset
Training of Test Dataset
Neutral
Surprise
Fear Happy
Angry Sad
kurtosis tend to have a flat top near the mean rather than a sharp peak.
Kurtosis= 𝑖=1𝑁 𝑌𝑖−𝑌
4
𝑁−1 𝑠4
3.2.2
Skewness
Skewness is a measure of symmetry, or more precisely, the lack of symmetry. A distribution, or data set, is symmetric if it looks the same the left and right of the center point.
Skewness= 𝑖=1𝑁 𝑌𝑖−𝑌
4
𝑁−1 𝑠4
3.2.3
Mean
Mean is the sum of the values divided by the number of values. The mean of a set of numbers x 1,x2,x3...xn is typically denoted by ͞x.
3.2.4
Standard Deviation
Standard deviation is a measure of how spread out the data set are form the mean, it is denoted by σ.
Standard deviation (σ) = 𝑁1 𝑁 𝑥𝑖 − 𝜇 𝑖=1
2
3.2.5
Variance
Variance is the measure of the dispersion of a set of data points around their mean value. It is mathematical expectation of the average squared deviations from the mean.
Variance (𝜎2) = 1
𝑁 𝑥𝑖 − 𝜇 𝑁
𝑖=1
2
3.2.6
Moment
Moment is a quantitative measure of the shape of set of data points. The „second moment‟, for example, is widely used and measures the „width‟ of a set of data points.
𝑚𝑘 = 𝐸(𝑥 − 𝜇)𝑘
Were, k is the order and in order to calculate central moment its value is 2.
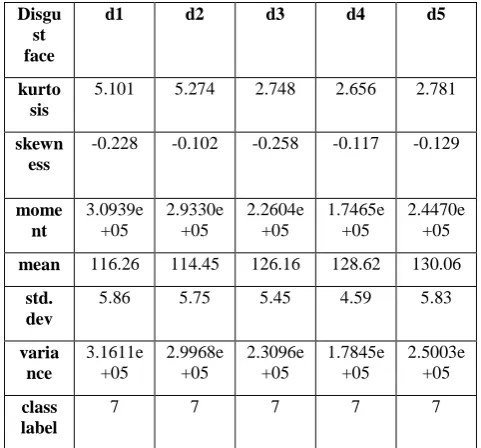
[image:3.595.310.548.86.720.2]We consider these six features for training in the neural network, as the features for example, kurtosis, skewness and moment are the measure of shape of the data points, shapes and increase as well as decrease in shape is very much helpful in determining different expressions. Also, kurtosis, skewness and moment depends on mean, standard deviation and variance, thus we consider these factors for evaluating different features of the face to obtain the better accuracy rate. We trained total 154 images for training and 70 images for testing. It is not possible to show the feature of all images, hence we show some examples from the training set and it‟s features in table 2.
Table 2.Evaluated featured from the facial images
Neutra l face
n1 n2 n3 n4 n5
kurtosis 4.6137 3.8238 1.8172 1.7158 3.9225
skewnes s
-.3504 -.3413 .3456 .3360 .7110
moment 4.4657 e+05 4.4072 e+05 4.9534e +05 4.6077e +05 3.012e+06
mean 145.52 146.60 137.15 137.13 158.64
std. dev 6.52 6.49 7.06 6.698 13.44
variance 4.562e +05 4.503e +05 5.061e+ 05 4.707e+ 05 3.077e+06 class label
1 1 1 1 1
Happ y face
h1 h2 h3 h4 h5
kurto sis
2.541 5.124 4.616 2.062 1.753
skew ness
0.162 -0.178 -0.297 0.223 0.309
mome nt 5.7925e +05 5.2820e +05 6.8174e +05 3.9296e +05 3.5102e +05
mean 136.84 138.54 139.46 126.95 131.13
std. dev
7.05 7.06 8.23 6.85 6.32
varia nce 5.9185e +05 5.3968e +05 6.9656e +05 4.0151e +05 305865 e+05 class label
2 2 2 2 2
Surpr ise face
s1 s2 s3 s4 s5
kurto sis
2.633 4.231 3.280 3.229 4.309
skewn ess
-0.103 0.006 0.375 0.127 0.459
mome nt 1.1091e +05 5.6567e +05 6.3839e +05 1.0158e +05 3.0822e +05
mean 144.84 142.02 135.29 133.96 157.09
std. dev
9.68 6.81 7.93 9.68 13.47
varia nce 1.1332e +06 5.7797e +05 6.5223e +05 1.0379e +06 3.1492e +06 class label
Fear face
f1 f2 f3 f4 f5
kurto sis
3.936 4.176 6.064 2.282 2.064
skewn ess
0.007 -0.195 -0.547 0.2625 0.223
mome nt 3.9227e +05 3.7789e +05 4.6212e +05 3.1669e +05 2.6531e +05
mean 113.50 115.90 115.26 131.70 135.86
std. dev
6.32 6.48 7.01 5.79 5.35
varia nce 4.0080e +05 3.8611e +05 4.7216e +05 3.2357e +05 2.7107e +05 class label
4 4 4 4 4
Sad face
sa1 sa2 sa3 sa4 sa5
kurto sis
3.417 4.990 2.064 2.183 2.586
skewn ess
-0.121 -0.403 0.289 0.281 0.624
mome nt 4.2086e +05 4.8137e +05 3.1723e +05 3.5986e +05 2.2871e +05
mean 139.24 134.69 132.45 134.58 155.73
std. dev
6.65 7.31 6.03 6.29 11.84
varia nce 4.3001e +05 4.9183e +05 3.2413e +05 3.6768e +05 2.3368e +06 class label
5 5 5 5 5
Angr y face
a1 a2 a3 a4 a5
kurto sis
2.005 3.052 2.005 2.017 2.253
skewn ess
-0.058 -0.002 -0.058 0.174 0.228
mome nt 3.0964e +05 2.2574e +05 3.0964e +05 2.2366e +05 2.9649e +05
mean 114.58 118.74 114.58 135.16 138.10
std. dev
5.74 4.60 5.74 4.87 5.58
varia nce 3.1637e +05 2.3065e +05 3.1637e +05 2.2852e +05 3.0294e +05 class label
6 6 6 6 6
Disgu st face
d1 d2 d3 d4 d5
kurto sis
5.101 5.274 2.748 2.656 2.781
skewn ess
-0.228 -0.102 -0.258 -0.117 -0.129
mome nt 3.0939e +05 2.9330e +05 2.2604e +05 1.7465e +05 2.4470e +05
mean 116.26 114.45 126.16 128.62 130.06
std. dev
5.86 5.75 5.45 4.59 5.83
varia nce 3.1611e +05 2.9968e +05 2.3096e +05 1.7845e +05 2.5003e +05 class label
7 7 7 7 7
3.3
Back Propagation Algorithm
Neural networks have been extremely applied to numerous pattern recognition problems such as character recognition, object recognition, face detection, facial expression recognition and many more. Neural network are classified into two type feedback and feed forward networks.
[image:4.595.308.549.71.295.2]Back-propagation is a multi-layer forward network. In forward network there is no feedback, hence only, a forward flow of information is present. There are various nets that come under the feed forward type of nets among all the most important type of network is the Back-Propagation network; figure 2 shows an example of Back-propagation network.
3.3.1
Training
There are generally four steps in the training
process:
a.
Assemble the training data.b.
Create the network object.c.
Train the Networkd.
Simulate the network response to new inputs.We name the training data set as „train_data‟ and we simulate the network with the dataset named „train_target‟. Since, the code is implemented in matlab the back-propagation network is created as follows:
net= newff(minmax(train_data),[100,7],n {„tansig‟,‟purelin‟},‟trainlm‟); Were,
newff- create feedforward back-propagation network. Minmax(train_data)- gives the number of neuron in the input layer, in our case it is „6‟, because of the
six features
100- are the hidden neurons in the hidden layer. 7- are the output neurons.
„tansig‟- transfer function of the hidden layer. „purelin‟- transfer function of the output layer.
3.3.2
Training Function
There are different types of training function among which „trainlm‟ is the fastest back-propagation algorithm in the neural network toolbox. This training function, update weight and bias values according to „Levenberg-Marquardt‟ optimization. The only drawback of this training function is that, it requires more memory than any other algorithm.
3.3.3
Epochs
Epoch is the step in training process. In our dataset number of epochs are 300.
3.3.4
Learning Rate
Learning rate is used to adjust the weights and biases of the network in order to move the network output closer to the targets. In our training learning rate is 0.05.
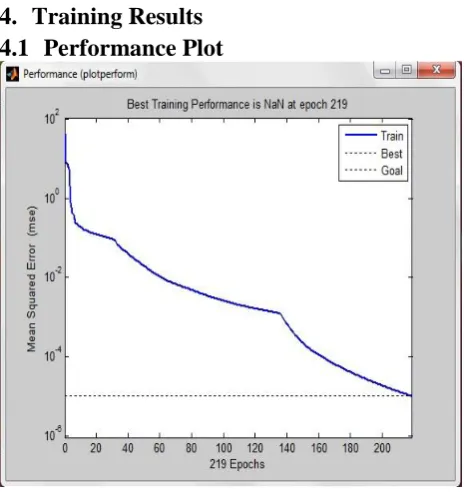
[image:5.595.316.549.71.318.2]4.
Training Results
4.1
Performance Plot
[image:5.595.77.523.355.550.2]Fig 3. Performance Plot
Fig 2: Architecture of Back-Propagation neural network
[image:5.595.53.285.592.735.2]4.2
Training State
Fig 4. Plot of training state
The training state determines the position of gradient, mu and validation check when epoch is 219 at which network is completely trained
Hidden neuron 3 Hidden neuron 2 Hidden neuron 1
Hidden neuron n
Output neuron 1
Output neuron 2
Output neuron 3
Output neuron n
Input Neuron layer
Hidden neuron
4.3
Regression
Fig 5. Plot of Regression
This plot tells the linear regression of targets relative to outputs. A straight linear line tells that the output data is exactly same as target data.
5.
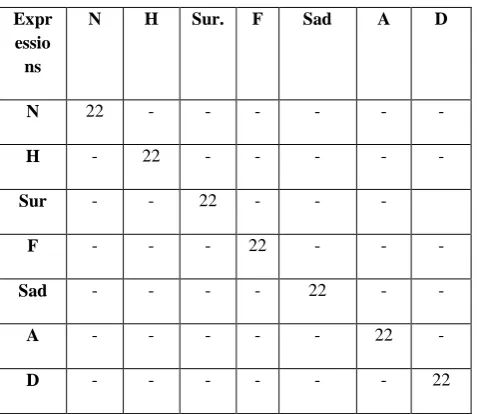
RESULTS
As, form the regression result it is been proved that all the training data is been fitted to target data, which leads to 100% accuracy in training the data through back-propagation neural network. We totally trained 154 data, out of each 22 images are for each six expressions. Table3. Show the exact matching of trained data and the target data during training.
Table3. Number of facial images matched
Expr essio ns
N H Sur. F Sad A D
N 22 - - - -
H - 22 - - - - -
Sur - - 22 - - -
F - - - 22 - - -
Sad - - - - 22 - -
A - - - 22 -
D - - - 22
Similarly, we totally tested 70 facial expressions which are 67% approximately classified into their respective expression class.
6.
CONCLUSION
Comprehensive efforts have been made over the past two decades in industries, government and academia to discover efficient method which can be able to assess truthfulness, deception and credibility during human interactions. In this paper the fastest neural network technique to classify the expressions is used which classify the face in 0:02:11 seconds.The effective back-propagation network with 6 input neurons, 100 hidden neurons and 7 output neurons is used to train the network.
7.
FUTURE SCOPE
The proposed work is ongoing project hence there are different path to explore it, as we can use different features other than what is used in project and compute the accuracy, increase the feature and evaluate the accuracy, increase or decrease the epoch or hidden neuron to obtain the result in much less time than 2 seconds and also we can apply it for different database other than JAFFE.
8.
REFERENCES
[1] P. EKMAN AND W. FRIESEN, FACIAL ACTION CODING SYSTEM,CONSULTINGPSYCHOLOGISTS PRESS, 1978.
[2] F. Kawakami, H. Yamada, S. Morishima and H. Harashima, “Construction and Psychological Evaluation of 3-D Emotion Space,” Biomedical Fuzzy and Human. Sciences, vol.1, no.1, pp.33–42 (1995). 2427
[3] M. Rosenblum, Y. Yacoob, and L. S. Davis, “Human expression recognition from motion using a radial basis function network architecture,” IEEE Trans. on Neural Networks, vol.7, no.5, pp.1121-1138(Sept.1996).
[4] M. Pantic and L. J. M. Rothkrantz, “Automatic analysis of facial expressions: the state of the art,” IEEE Trans. Pattern Analysis & Machine Intelligence, vol.22, no.12, pp.1424-1445(Dec. 2000).
[5] Y. S. Gao, M. K. H. Leung, S. C. Hui, and M. W. Tananda, “Facial expression recognition from line-based caricature,” IEEE Trans. System, Man, & Cybernetics (Part A), vol.33, no.3, pp.407-412(May, 2003).
[6] Y. Xiao, N. P. Chandrasiri, Y. Tadokoro, and M. Oda, “Recognition of facial expressions using 2-D DCT and neural network,” Electronics and Communications in Japan, Part 3, vo.82, no.7, pp.1-11(July, 1999).
[7] L. Ma, K. Khorasani, “Facial expression recognition using constructive feedforward neural networks,” IEEE Trans. System, Man, and Cybernetics (Part B), vol.34, no.4, pp.1588-1595 (2003).
[8] L. Ma, Y. Xiao, K. Khorasani, R. Ward, “A new facial expression recognition technique using 2-D DCT and K-means algorithms,”IEEE.
[9] S.C.Tai , K.C.Chung, “Automatic Facial Expression
Recognition using neural network,” IEEE 2007.
[11]L. Ma and K. Khorasani,” Facial Expression Recognition Using Constructive Feedforward and Neural Networks”, IEEE transactions on systems, man and cybernetics- part B: Cybernetics, vol.34, No. 3, June 2004.
[12]Chaiyasit, Philmoltares and Saranya,” Facial Expression recognition using graph based feature and artificial neural network.
[13]GengXue, Zhang Youwei,Facial Expression Recognition Based on the Difference of Statistical Features.ICSP2006 Proceedings, 0-7803-9737-1.
[14]Le Hoang Thai, Nguyen Do Thai Nguyen and Tran Son Hai, A Facial Expression Classification System Integrating Canny, Principal Component Analysis and Artificial Neural Network.International Journal of Machine Learning and Computing, Vol. 1, No. 4, October 2011.
[15] Philipp Michel and Rana El Kaliou.Facial Expression Recognition Using Support Vector Machines.