Munich Personal RePEc Archive
Demand for Meat; Seprability and
Structural changes (A Nonparametric
Analysis)
Aziz, Babar and Shahnawaz, Malik
BZU Multan
2005
Online at
https://mpra.ub.uni-muenchen.de/22932/
DEMAND FOR MEAT; SEPARABILITY AND STRUCTURAL CHANGES (A NONPARAMETRIC ANALYSIS)
Shahnawaz Malik
Professor and Chairman, Department of Economics, Bahauddin Zakariya University, Multan
Babar Aziz
Ph. D. Scholar / Lecturer in Economics, Government Post Graduate College, Vehari
Thursday, May 27, 2010
- 2 -
DEMAND FOR MEAT; SEPARABILITY AND STRUCTURAL CHANGES (A NONPARAMETRIC ANALYSIS)
1.
Introduction
Consumer demand analysis has become increasingly difficult, for applied economists,
over the past 25 years or so. This is because twenty-five years ago a single-equation
linear or double-log demand equation using OLS would have been regarded as
generally acceptable, so long as the coefficients were plausible and there were no
obvious statistical problems with the model. Nowadays, such models are mostly
scorned in applied work. It is virtually obligatory to estimate demand parameters in
the context of a system of demand equations based on some flexible functional form.
Even when flexible functional forms are used there are some imperative specification
issues that remained to be dealt with. For instance, how do we know that the results
would not be different with an alternative functional form? Is the price-dependent or
quantity-dependent system more appropriate? Should the model be estimated with
equation by equation or with a system of equations? Should the possibility of
simultaneity bias be recognized? How should the structure of dynamics in the error
term be specified? Should the model be first-difference? The implications are that the
results are conditional on such specification choices and must be heavily qualified.
The nonparametric demand analysis holds the potential to allow conclusions to be
drawn with fewer qualifications. This method uses only the conditions imposed on a
data set by utility maximization. It avoids the problem of functional forms. It gives a
particular form such as, the LA/AIDS, the Rotterdam Model and the Translog.
Moreover, the nonparametric approach avoids the specification bias likely to arise due
to arbitrarily selected functional forms or the pre-testing inherent in specification
searches [Eales and Unnevehr (1988)]. The nonparametric approach to demand
analysis uses the results of revealed-preference theory, first established by
Houthakker (1960) and more recently advanced by Koo (1963, 1971), Afrait (1967)
and Varian (1982, 1983). By putting in a nutshell we can say that the nonparametric
techniques of revealed preference analysis can be used to test a finite amount of data
for consistency with preference maximization model; construct a nicely behaved
utility function capable of rationalizing a finite amount of demand data; compare
previously unobserved consumption bundles and budget with respect to their ordinal
ranking; compute cardinal bounds on the direct and indirect compensation functions
and compute estimates of the direct and indirect demand correspondence consistent
with previously observed demand data.
2.
Objectives of the Study
The objective of this study is to estimate consumer preferences for food commodities
using Pakistan’s annual time series disappearance data from 1950-51 to 2004-2005.
The study tests for the existence and the nature of the structural change in the
commodities by exploring the levelness of the data with the utility maximization
principles using nonparametric revealed preference axioms, more idiosyncratically,
the generalized axiom of revealed preference.
We started with twenty six different food commodities and employed nonparametric
- 4 -
except meat group had shown violations of GARP. So keeping in mind these
violations of different data sets we limited our analysis only to meat group. These
tests revealed that our data set is consistent with the theory of consumer demand.
3.
Consumption Patterns in Pakistan
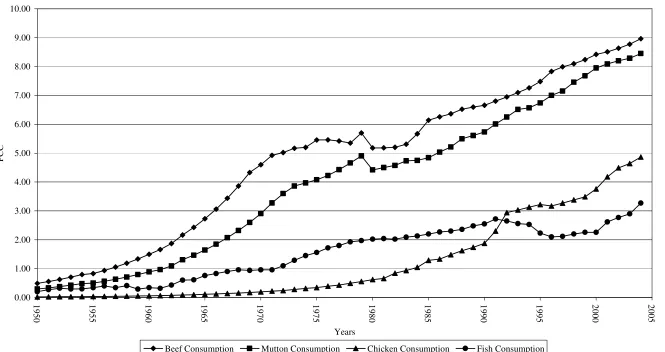
Food consumption patterns have undergone massive changes during the past two
decades. Particularly, the consumption of meats has registered an upward trend.
Figure 2.1 illustrates consumption patterns of meats based on the annual per capita
consumption data. Though consumption pattern of mutton and chicken has shown a
perpetual trend of growth since early fifties, the meat consumption remained constant
during this period. The beef consumption increased only in mid-eighties. Fish
consumption, however, has remained constant during this entire period. Per capita
consumption of chicken doubled in the first seven years and continued increasing
rapidly in 1980's. The most interesting relationship, however, is the perfect
substitution between beef and mutton all along the study period (figure 2.1).
It was further indicated that, within the meat group, beef has a lower preference, with
regards to the consumer demand, as compared to mutton and chicken. This was
further supported by the fact that during the study period, the price of mutton was
more than double than the price of beef. The prices of mutton and chicken were
similar during the 1970's, the price of chicken declined in 1980's. This is manifested
by the increased production of chicken since 1980's due to government incentives.
This has decreased the price of chicken relative to mutton and beef. Consumption of
all meats has increased although the relative prices of beef, mutton and fish have
consumption of food can partly be explained by decreased prices of chicken owing to
increased productivity, and partly by changes in the demand structure for food on
account of changes in demographic factors, changes in economic well being, and most
importantly a change in consumer preferences due to changes in consumer tastes.
There remains, however, the possibility that some non price factors may also be
instrumental in bringing about this change. For instance, a gradual change in
consumer preferences could have taken place due to changes in tastes perhaps as a
result of cultural onslaught through the remaining migrant labour force from the
Middle East, or for unknown reasons. If this hypothesis is correct then these
evolutionary changes may have produced new consumption patterns that may explain
6
Figure 2.1: Per Capita Consumption of Meat in Pakistan (1950-1951 to 2004-2005)
0.00 1.00 2.00 3.00 4.00 5.00 6.00 7.00 8.00 9.00 10.00 1 9 5 0 1 9 5 5 1 9 6 0 1 9 6 5 1 9 7 0 1 9 7 5 1 9 8 0 1 9 8 5 1 9 9 0 1 9 9 5 2 0 0 0 2 0 0 5 Years P C C
4.
A Review of Nonparametric Approach
The nonparametric approach has been developed to test data for consistency with
utility maximization, i.e., the test for consistency of the data with weak axiom of
revealed preference (WARP) , strong axiom of revealed preference (SARP) and
generalized axiom of revealed preference (GARP), and to recover the properties of
the underlying preferences and to forecast demand behaviour [Varian, (1982,
1992)].1
According to WARP, bundle a is revealed preferred to any other bundle b (denoted
aRb), that could have been purchased instead (i.e., a is preferred to all points within
the budget line that implies when a is preferred). WARP is violated if any such
bundle b is also revealed preferred to bundle a (i.e., a lies inside the budget line that
applies when b is purchased). Such a result implies that both aRb and bRa. This
could occur only when the indifference curve shifts [Varian (1982, 1992); Eales and
Unnevehr (1988)].
A finding that the data are consistent with WARP does not rule out the possibility of
intransitivity. Therefore, it is necessary to check for consistency with SARP. This
involves a search for intransitivity in the data, to see if bundle a, b, and c can be found
that together imply aRb, bRc, and cRa. The number of bundles of goods that can
come between a and c is limited only by the size of the data set. The data are
consistent with SARP only when no intransitivities are found.
1
- 8 -
The GARP is a generalized test for WARP and SARP in the family of revealed
preference. WARP and SARP are standard tests, which require that for each budget
there be a unique bundle demanded. In contrast, testing for GARP would allow
multiple solutions to the consumer’s optimization [Varian (1992)]. The consistency
of data with GARP implies WARP, however, the reverse is not true. Even when we
find no violations of WARP, it is necessary to check for GARP or SARP. Therefore,
GARP is a necessary and sufficient condition for the consistency of data with utility
maximization [Varian (1982)].
One drawback, to testing hypotheses with nonparametric approach, appears to be the
unknown power of the tests. It seems reasonable to expect the power of
nonparametric approach to be higher for disaggregated goods. Quantities consumed
do not all raise uniformly with time and relative price variation is likely to be greater,
relative to variation in real expenditure than for more aggregated bundle of goods
[Eales and Unnevehr (1988)].
Even, when this power is low in nonparametric approach relative to some desired
level, it does not mean that the parametric approach should be adopted. As Chalfant
and Alston (1988) and more recently Alston and Chalfant (1991), suggested that when
the data are such that the nonparametric tests are low-powered, parametric tests are
also low powered. To this end, there has been some progress with methods for
improving the power of the nonparametric tests. Progress in this direction seems to
(1988) adjusted their data for expenditure growth in order to increase the number of
comparable data points, but to do so it was necessary to assume values for income
elasticities. They also pointed out that free testing of GARP on adjusted data is very
sensitive to the chosen elasticities for adjustment.2
Although it would seem reasonable to expect researchers to apply at least the
consistency test (at the minimum WARP), the studies that have applied these tests
remain small. The low popularity of nonparametric approach is surprising given its
potential to complement the parametric approach.
5.
Specification of Nonparametric Approach
The procedure of testing the revealed preference theory as followed in the present
study turns out to be not difficult. The revealed preference approach is more realistic,
and not based on pre-determined functional form. This approach uses the data on
observed prices and quantities and tests its consistency with utility maximization
using the revealed preference axioms. These axioms are increasingly used in the
consumer demand analysis as a complement to the parametric analysis, especially to
pretest the consistency of data sets with the theory.3 Revealed preference theory is
formulated on the assumption that to each set of the given prices
( )
Po , there willcorrespond an optimal set of quantities
( )
Qo . In other words we are observing thebehaviour and testing the consistency of the consumer on the basis of their total
2
For a detailed discussion about the power of nonparametric approach, see, Eales and Unnevehr (1988, 1993).
3
- 10 -
expenditure on the goods. It is nonparametric: it provides a complete test of the
hypothesis in the question alone, with no additional assumption about the functional
form.
Alston and Chalfant (1992) describe the progress of the nonparametric analysis in
consumer theory. It originated from Afriat. It is founded on Samuelson’s revealed
preference theory. It has been used by Diwert (1973), Diwert and Parkin (1978,
1985), Varian (1982, 1983), Alston and Chalfant (1991, 1992) and Burki (1997).
Since its inception, nonparametric analysis has advanced from providing tests for
consistency of the data Varian (1983) to the more complex tests. For example
according to Alston and Chalfant (1991), data that generate low-powered
nonparametric test also tend to yield low-powered parametric tests.
The advantages of this approach as pointed out by Varian (1982), “that the stability of
the consumer preferences can be investigated without explicitly identifying and
estimating the system of demand equations. Tests which rely on the specific demand
are necessarily conditional on the validity of the restriction imposed by the parametric
structure of the demand system. Nonparametric system avoids this drawback, and in
addition, requires less computation”. In short, the method for testing the revealed
preference used here proved to be feasible.
To illustrate, suppose that in a price situationP P Po
(
o1, o2,Po3, ,Pon)
, the consumerbuys a commodity bundleQo. This commodity bundle Qois said to be preferred to an
o
Q basket must be at least as expensive. Therefore,P Qo 1≤PQ1 o. This is known as
weak axiom of revealed preference (WARP).
Both the homogeneity and the negativity can be tested with WARP alone. However,
to prove symmetry of the substitution term Kij =KjiWARP needs to be extended to
what is known as the strong axiom of revealed preference (SARP) [Houtkhakker
(1960) ]. Infect WARP deals with only pairwise choices while SARP incorporates the
consistency of the data set, i.e., ifQois preferred toQ1 whileQ1 is preferred
toQ2thenQois preferred toQ2. This can be extended to any number of commodity
bundles.
Consumers whose choices are governed by these axioms will always posses an
indifference map. The consistency of data with WARP is established only when there
is no violation of WARP. This is however, a necessary but not sufficient condition
for utility maximization. SARP relates to the transitivity property of the utility
function. Therefore, to search for in transitivity in the observed data the consistency
of data with SARP is recommended.4
Generalized Axiom of revealed preference is a test, which generalizes other tests in
the family of revealed preference. WARP and SARP are standard tests, which require
4
- 12 -
that for each budget there be a unique bundle demanded. In contrast, testing for
GARP would allow multiple solutions to the consumer’s optimization [Varian
(1992)]. In other words, GARP also allows “flat spots” in the indifference curves.
The consistency of data with GARP implies WARP; however, the reverse is not true.
Likewise, even when we find no violation of WARP, it is necessary to check for
SARP or GARP. Therefore, GARP is the necessary and sufficient condition for the
consistency of data with utility maximization [Varian (1982)]. We pretest our data for
GARP to see if the data is consistent with utility maximization.
Weak separability is another regulatory condition for utility maximization that we
test by revealed preference axioms, this nonparametric method does not involve use
of any assumed (parametric) functional form hence, it avoids the problems of
functional form and does not involve regression analysis [Alston and Chalfant
(1992)].
6.
Data Description
This study has made use of time series data on prices and per capita consumption,
which is to be analyzed using nonparametric demand analysis. Data on population and
personal consumption expenditures was obtained from the Economic Survey. Per
capita consumption was calculated by using the annual disappearance5 data from
Statistical Yearbook of Pakistan, Government of Pakistan. Prices data are averages of
twelve centres and are obtained from Monthly Statistical Bulletin of the Federal
Bureau of Statistics [Government of Pakistan (various issues)].
5
7.
Empirical Results of Nonparametric Tests
A common approach in consumer demand studies is to assure that different sets of
consumer goods are weakly separable from other goods. This approach is
questionable on theoretical grounds because the maintained hypothesis of weak
separability between goods in different groups imposes a number of restrictions on the
substitution possibilities [Moschini, Moro and Green (1994), Barnett, Fisher and
Serletis (1992)]. Clearly, if these restrictions are not satisfied then the estimates of
elasticities may be erroneous.
We use Varian’s software NONPAR developed to conduct nonparametric demand
analysis. We perform nonparametric test on our data set6 to check the consistency of
the data with the theory of revealed preference. We had performed various tests for it.
For example we check Afriat inequalities, generalized axiom of revealed preferences
and the condition of weak separability using NONPAR program developed by Hal
Varian. We started with 26 food commodities and performed above mentioned tests
to the entire data set. We found that all other groups except meat group showed
violations of GARP.
If the entire data set satisfies Afriat inequalities then we can say that there exists a
continuous, concave, monotonic non-satiated function that rationalizes the data. The
consistency of the data with Afriat inequalities is sufficient condition to check the
consistency of the data with GARP. According to Varian (1982) if some data set
satisfies GARP then there is a nice utility function that will rationalize the observed
6
- 14 -
behaviour. If the data contains a violation of GARP then there does not exist a
nonsatiated utility function that will rationalize the data. Hence we have a straight
forward and efficient way to check a finite account of data for consistency with the
theory of consumer behaviour. GARP is necessary condition to check the data for
separability conditions.
Our data set have no violation of GARP and hence, is consistent with Afriat
inequalities.7 The condition of weak separability is also met. A check of consistency
with axioms of revealed preference showed that the data could have been generated
by stable preferences. Therefore, any conclusions from this data set that tastes have
changed must come in the form of restrictions on the nature of these demand systems.
The data alone does not indicate changes in preferences.8
8.
Conclusions
This study estimates consumer demand and their responsiveness to prices and income
for meat group using Pakistan’s time series data from 1950-51 to 2004-05. We
employ the nonparametric revealed preference approach to estimate consumer
7
Afriat’s theorem was first proved by Afriat (1967), Varian (1982) introduced GARP to replace a more unwieldy condition Afriat called “cyclical consistency”. GARP is to be preferred to Afriat’s cyclic consistency since it is much easier to test in practice. For detailed discussion see Varian (1982).
8
preferences. The commodities included in the meat group are beef, mutton, chicken,
fish and others.
Nonparametric tests were used on the data set to check the consistency of the data
with the theory of revealed preferences, e.g. the Afriat inequalities, GARP and the
condition of weak separability. It was found that there was no violation of GARP in
our data set and hence consistent with Afriat inequalities. The data set also met the
condition of weak separability. These test procedures imply that the data could have
been generated by stable preferences. Tests of structural change do support a shift in
demand for fish in 1991-92. More specifically, it was observed that the exogenous
growth in the share of fish demand has declined after 1991-92. The observed decrease
- 16 -
References
Afriat, S. N. (1967). The Construction of a Utility Function from Expenditure Data. International Economic Review. 8: 67-77.
Alston, Julian M., and James A. Chalfant (1991). Can We Take the Con Out of Meat Demand Studies? Western Journal of Agricultural Economics. 16: 36-48.
Alston, Julian M., and James A. Chalfant (1992). Consumer Demand Analysis According to GARP. Northeastern Journal of Agricultural and Resource Economics. 21: 125- 139.
Alston, Julian M., and James A. Chalfant (1993). The Silence of the Lambdas: A Test of the Almost Ideal Demand System and the Rotterdam Model. American Journal of Agricultural Economics. 75: 304-313.
Barnett, William A. , Douglas Fisher and A. Serletis (1992). Consumer Theory and the Demand for Money. Journal of Economics Literature. 30(4): 2086-2119.
Burki, Abid A. (1997). Estimating Consumer Preferences for Food Using Time Series Data of Pakistan. Pakistan Development Review. 36(2): 131-153.
Chalfant, James A., and Julian M. Alston (1988). Accounting for Changes in Tastes. Journal of Political Economy. 96:391-410.
Chavas, J. P. (1983). Structural Change in the Demand for Meat. American Journal of Agricultural Economics. 65:148-153.
Chavas, J. P. and T. L. Cox (1990). Nonparametric Demand Analysis: A Duality Approach. Staff paper No. 265. Department of Agricultural Economics University of Wisconsin.
Diewert, W. E., (1973) Afriat Inequalities and Revealed Preference Theory. Review of Economic Studies. 40. 419-426.
Diewert . W. E. And C. Parken (1978). Tests for the Consistency of Consumer Data and Nonparametric Index Numbers. Discussion Paper, Department of Economics, University of Columbia, Vancouver.
Diewert . W. E. And C. Parken (1985). Tests for the Consistency of the Consumer Data. Journal of Econometrics. 30. 127-147.
Eales, James S., and Laurian J. Unnevehr (1993). Simultaneity and Structural Change in U.S. Meat Demand. American Journal of Agricultural Economics. 75: 259-268.
Government of Pakistan, Finance Division (2004). Economic Survey. Islamabad: Economic Adviser’s Wing. [Various Issues].
Government of Pakistan, Statistics Division (2004). Pakistan Statistical Yearbook. Islamabad: Federal Bureau of Statistics. [Various Issues].
Houthakker, H. S. (1960). Additive Preferences. Econometrica. 28: 244-257.
Koo. A. Y. C. (1963). An Empirical Test of Revealed Preference Theory. Econometrica. 31: 646-664.
Koo. A. Y. C. (1971). Revealed Preference: A Structural Analysis. Econometrica. 39: 89-97.
Moschini, G., D. Moro and Richard D. Green (1994). Maintaining and Testing Separability in Demand Systems”, American Journal of Agricultural Economics. 76(1): 61-73.
Varian, Hal R. (1982). The Nonparametric Approach to Demand Analysis. Econometrica. 50: 945-973.
Varian, Hal R. (1983). Nonparametric Tests of Consumer Behaviour. Review of Economic Studies. 50: 99-110.