Mining Multiple Level Association Rules to
Mining Multiple Level Correlations to Discover
Complex Patterns
Mamta
Shobhit University Modipuram, Meerut
Shwetank Arya
Gurukul Kangri University Hardwar
R.P.Agarwal
Shobhit University Modipuram, Meerut
ABSTRACT
Recently, frequent pattern mining (FPM) has become one of the most popular data mining approaches for various applications such as education, medical, farming, analysis of sale and purchase patterns etc. Apriori algorithm [11] and FP growth algorithm are working efficiently in data mining. These algorithms are typically restricted to a single concept level of hierarchy and uniform support threshold. Sometimes domain database support concept hierarchies that represent the relationships among many different concept levels. In this paper efforts are made to discover items at multiple levels of concept hierarchy. Up till now, a very few concern has been shown to this area. In this study mining multiple levels is explored and extended to mining cross levels in large database on the basis of user specified reduced support threshold constraint.
General Terms
Identification of complex frequent patterns: from multiple level association rules to cross level association rules.
Keywords
Complex patterns, multiple level association rules, cross level association rules, IDIV.
1.
INTRODUCTION
The evolution of Data Mining (DM) technology is related to directly Moore’s law. The law states that computer processing power would double in eighteen month intervals. This is precisely what has happened since the 1960s, and the prediction correctly shows where DM technology should be today [14]. Then around in 1980s Gregory Piatesky Shapiro gave the term Knowledge Discovery in Data (KDD), but the most press liked the term “Data Mining” better [13-14]. Historically, the idea of discovering valuable patterns in data has been given a variety of names, including knowledge discovery, information harvesting, data archeology, data mining and pattern discovery. The phrase knowledge discovery in database was first given at KDD Workshop in 1989 [13] to emphasize that knowledge is the end product of data driven discovery. Data mining is the process of identifying potentially useful, understandable and hidden patterns in large data repository.There are various methods to find frequent complex hidden patterns in large repositories using association rules. Apriori algorithm [11] and FP growth algorithm are working efficiently in data mining. These algorithms typically work for single concept level of hierarchy and uniform support threshold. Since, sometimes business transaction database support concept hierarchies that represent the relationships among many different concept levels. In this study mining multiple levels is explored and extended to mining multiple levels to mining cross levels association rules. Multi level association rules can be mined using concept hierarchies under the support confidence framework.
There are number of variations for using support and confidence framework [1].
Using predefined uniform minimum support and minimum confidence threshold for all levels. Using predefined reduced minimum support and
minimum confidence threshold at lower levels. Using predefined item or group-based minimum
support and minimum confidence threshold. Using user specified minimum support and
confidence threshold framework.
Top down or bottom up any strategy can be used to mine the association rules. Generally, top down strategy is used, where counts are accumulated for the calculation of frequent item sets, at each concept level, starting at the concept level 1 and working downward in the concept hierarchy toward the more specific concept levels, up till no more frequent item sets can be found. At each level any algorithm can be used such as apriori algorithm using uniform minimum support or reduced minimum support. Uniform minimum support strategy generates many uninteresting patterns. If high minimum support is used at upper level and lower levels also, it generates many uninteresting rules at low levels. If low minimum support is applied at upper levels it avoids generating many interesting rules at higher levels. Therefore, for optimization it is required to use high minimum support at higher level and reduced minimum support at lower levels. This paper focuses on the mining multiple level to cross level mining among item sets.
2.
REVIEW LITRATURE
compared, validated through experiments and assessed on some parameters such as database and support [10]. Another study is done towards the combination of data mining and various statistical techniques such as chi square, regression analysis and hypothesis testing to provide some control to minimize the risk of discovering uninteresting rules and patterns [12].
In all existed studies multiple level association rules are discovered but in this present paper multiple level association rules are explored and extended to multiple level correlation rules to affirm the results discovered from multiple level association rules. Identification of multiple levels and cross level relationships among items plays an important role in discovering the answer of complex queries and making right decisions. Present study uses the example related to the stationary items. In this paper a method, based on association rules, is developed and discussed to identify multilevel and cross level relationship. Besides the investigation of several optimization methods, some interesting techniques for filtering uninteresting rules are also studied.
1. User is asked to input the support threshold at initial step to build the filtered encoded table.
2. User specified support threshold is used at level 1 and leveln+1 to discover the rules.
3.
PROPOSED WORK
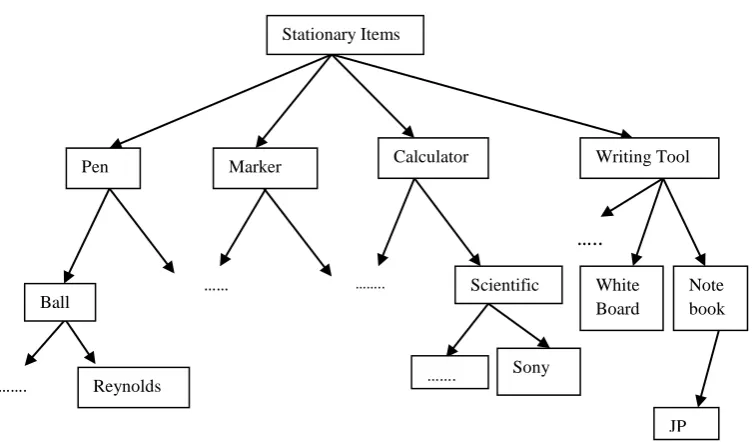
Concept hierarchy of items is used and numbered from level 0 to level + 1. Transaction T contains the items belonging to the terminal level. Level 0 is root/parent node and level + 1 is child node. Coding technique was proposed in [1] is used. For instance, in fig 1 the item pen is assigned code 1**, since it belongs to level 1, the ball pen is assigned code 11* and the Reynolds is assigned code 111, which provide the exact identification about the location of Reynolds ball pen in the concept hierarchy.
The problem of mining multiple level association rules, to discover the association rules consisting items belonging to the different levels of abstraction, meeting the minimum user specified support and confidence threshold, is extended to discover multi level correlation rules to affirm the mined results with statistical techniques. In this study user specified strategy is used in mining each level of abstraction. At initial level filtered encoded tables [Table 2, 3, 4] are made according to user specified support factor. The codes shown in strikethrough style are codes having the less support threshold from the user specified support threshold. At each level user specified support threshold is used to avoid the uninteresting rules. In this study user is asked to provide following inputs to enforce the constraint on the mining process:
Enter choice of strategy:
Minimum support and confidence threshold to filter items from encoded transaction table
Minimum support and confidence threshold at each level.
To explain the task an abstract example is taken, discussed and analyzed, which is the simulation of real life example.
Example: Find multiple levels and cross level association rules and correlation in the transaction repository table 1 for purchase patterns related to stationary items.
3.1
Mining multiple level association rules
Table 1 contain transaction_id and item purchased. Three days example data is used to discover valuable patterns. Each tuple in the table is a unique item set purchased in a day. Taxonomical information is provided in fig 1 representing items at each level from root node to terminal node. Associations are discovered using the algorithm [Fig 2].
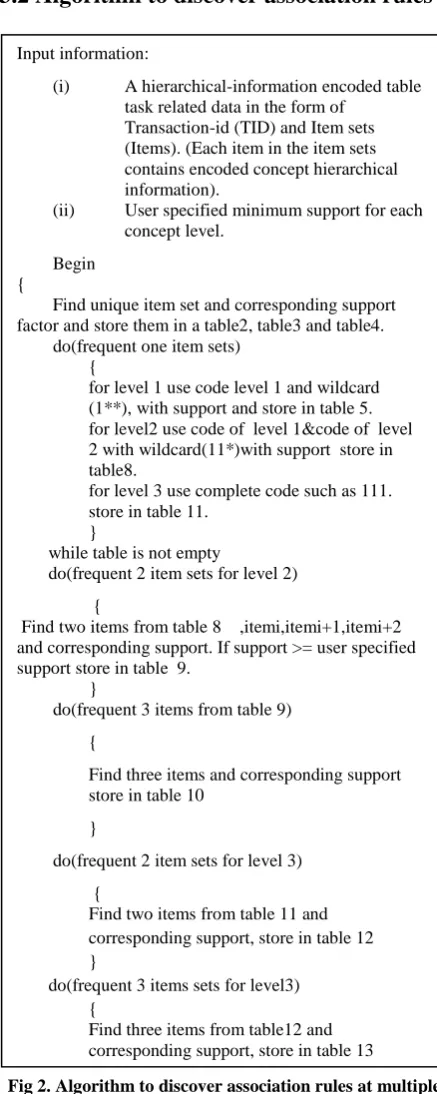
[image:2.595.316.535.200.748.2]3.2 Algorithm to discover association rules
Fig 2. Algorithm to discover association rules at multiple levels.
Input information:
(i) A hierarchical-information encoded table task related data in the form of
Transaction-id (TID) and Item sets (Items). (Each item in the item sets contains encoded concept hierarchical information).
(ii) User specified minimum support for each concept level.
Begin {
Find unique item set and corresponding support factor and store them in a table2, table3 and table4. do(frequent one item sets)
{
for level 1 use code level 1 and wildcard (1**), with support and store in table 5. for level2 use code of level 1&code of level 2 with wildcard(11*)with support store in table8.
for level 3 use complete code such as 111. store in table 11.
}
while table is not empty
do(frequent 2 item sets for level 2) {
Find two items from table 8 ,itemi,itemi+1,itemi+2 and corresponding support. If support >= user specified support store in table 9.
}
do(frequent 3 items from table 9) {
Find three items and corresponding support store in table 10
}
do(frequent 2 item sets for level 3) {
Find two items from table 11 and corresponding support, store in table 12 }
do(frequent 3 items sets for level3) {
Table 1 indicates the items purchased in three consecutive days. Item are encoded by using the technique [1]. Filtered encoded table is built by removing the items having less support threshold from the user specified support threshold. In this example it is assumed that the user specified support threshold is 1 %( 3 transaction out of 30 transaction). The items having the less than 1 support per day are removed from the filtered table. Strikethrough style is used to represent the removed items [table 2, 3 and 4]. Table 5 is built which indicates the level 1 frequent one item sets using the support threshold 20%. Total transactions used are 30 and items having the minimum 6 support threshold are considered for the frequent one item sets at level 1. Table 6 indicates the level 1 frequent two item sets with support threshold 20%. Similarly table 7 indicates the level 1 frequent three item sets with support threshold 20%. For level 2 minimum support thresholds is assumed as 10%. Table 8 indicate the level 2 frequent one item sets and table 9 and table 10 indicate the frequent two and frequent three item sets at level 2. Table 11, 12 and 13 indicate the frequent one, two and three item sets at level 3 with minimum support threshold.
3.2
Mining Multilevel Correlation
Coefficient
Data mining technique is data driven technique, it would beneficial to affirm the mined rules with statistical methodology to obtain more reliable results. Coefficient of correlation is one of the most widely used statistical measures to measure the strength of linear relationships in two or more variables. Of the several mathematical methods of measuring correlation, the Karl Pearson’s method is most widely used in practice. The coefficient of correlation is denoted by r. The value of the coefficient of correlation as obtained by its formula shall always lie between ± 1. When r=+1 it means there is perfect positive correlation between variables and r= -1 it means there is perfect negative correlation between variables. When r = 0 it means there is no correlation between variables. However, in practice r = +1, -1 and 0 are rare. Values normally lie between +1 and -1. The coefficient of correlation describes not only the magnitude of correlation but also the direction of correlation.
Table 14 indicates the correlation between items at level 1, table 15 shows the correlation between items at level 2 and table 16 indicates the correlation between items at level 3. Table 17 shows the correlation between cross level items. At level 1 item code 2** and item code 4** has .50 correlation which indicate positive correlation. The percentage of support is 43, means 43% times 2** and 4** items are purchased together. Item code 3** and item code 4** has .36 correlation which indicate positive correlation and magnitude is .36, if the sale of one item is increased the sale of other item will also be increased. Support percentage of 3** and 4** codes is 36, indicates that the sale of 3** and 4** both are purchased together 36 times out of 100 transactions. Item code 1** and item code 4** has .53 correlation which is also positive and indicate if the sale of 2** item is rise consequently the sale of 3** item also be rise.
3.3
Mining Cross level Association Rules
and Correlation Coefficient
[image:3.595.309.541.227.312.2] [image:3.595.306.543.350.539.2] [image:3.595.309.541.576.766.2]Cross level association rules refers association of one item to another item belongs to different category and level such as item coded as 1** (pen) and item coded as 43*(notebook) [Figure 1]. Table 17 shows the cross level correlation coefficient of code 1** and code 43* that Is -0.44 and support threshold of code item 1** and 43* is 43.33%. The validity of association rule is also affirmed by the correlation coefficient. Correlation coefficient also indicates that there is negative correlation in these two cross level rules.
Table 1. Sales of Stationary items
DAY TID Item Purchased
1 T1 Ball Pen, Simple Notebook, calculator
2 ….. ……
3 ….. ……
Table 2. Filtered Encoded Transaction (Day1)Minimum support 1%
TID Items Purchased
T1 111, 431,321,131,432 T2 111,431,321,131,432
T3 111,431,321
T4 111,431,321
T5 111,431,321,221
T6 221,412,222
T7 221,412,311
T8 221,412,231
T9 221,412
T10 221,412.421,321
Table 3. Filtered Encoded Transaction (Day2) Minimum support 1%
TID Items Purchased
T1 111,131
T2 111,131
T3 111,431,321
T4 131,432,312
T5 131,432,221
T6 221,412
T7 221,412
T8 131,432,321
T9 221,412,112
Table 4. Filtered Encoded Transaction (Day3)Minimum support 1%
TID Items Purchased
T1 111,131,432
T2 111,321,431
T3 111,431,321
T4 131,432,311
T5 131,432
T6 221,412
T7 221,412
T8 131,432,321
T9 221,412,212
[image:4.595.319.538.86.492.2]T10 221,412,111
Table 5. Level 1 Frequent 1 Item set (Minimum Support 20%)
Items Support (%)
1** 60
2** 50
3** 36
4** 93
Table 6. Level 1 Frequent 2 Item sets (Minimum Support 20%)
Items sets Support (%)
1**, 3** 33
1**, 4** 53
2**, 4** 50
[image:4.595.321.536.99.258.2]3**, 4** 36
Table 7. Level 1 Frequent 3 Item sets (Minimum Support 20 %)
Item sets Support (%)
1**,3**,4** 36
Table 8. Level 2 Frequent 1 Item sets (Minimum Support 10%)
Item sets Support (%)
11* 40
13* 36
22* 50
32* 33
41* 43
43* 50
Table 9. Level 2 Frequent 2 Item sets (Minimum Support 10%)
Item sets Support (%)
11*, 43* 30
11*,32* 23
22*,41 43
32*,43* 30
13*,43* 20
11*,13* 16
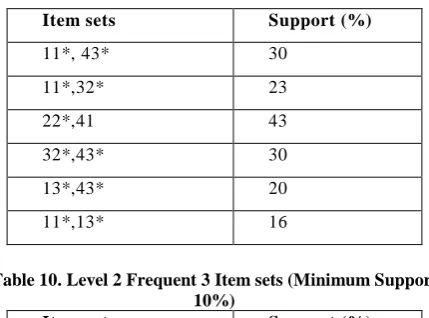
Table 10. Level 2 Frequent 3 Item sets (Minimum Support 10%)
Item sets Support (%)
11*, 43*,32* 26
Table 11. Level 3 Frequent 1 Item sets (Minimum Support 6%)
Item sets Support (%)
111 40
431 26
321 36
221 50
131 36
412 43
Table 12. Level 3 Frequent 2 Item sets (Minimum Support 6%)
Item sets Support (%)
111,431 26
111,321 26
321,431 26
[image:4.595.51.282.104.318.2]221,412 43
Table 13. Level 3 Frequent 3 Item sets (Minimum Support 6%)
Item sets Support (%)
[image:4.595.62.544.117.758.2]111,431,321 23
Table 14. Level 1, frequent two items sets Correlation Coefficient
Item set Item set Correlation
1** 2** -0.70
1** 3** -.89
1** 4** -0.70
[image:4.595.310.545.475.762.2] [image:4.595.69.268.641.763.2]2** 4** 0.5
3** 4** .94
Table 15. Level 2, frequent two items sets Correlation Coefficient)
Item set Item set Correlation
11* 43* .94
11* 32* .89
22* 41* 0
Table 16. Level 3, frequent two items sets Correlation Coefficient
Item set Item set Correlation
111 431 .89
131 432 .63
221 412 .70
Table 17.Cross Level Correlation Coefficient
Item set Item set Correlation
1** 43* -.44
4.
CONCLUSION
This study extended the scope of the study of mining association rules from single level to multiple level association rules, from uniform support framework to reduced support framework and also from mining multiple level association rules to mining multiple level correlation coefficients from large transaction database. Methods of mining cross level association rules and cross level correlation coefficient are also studied to validate the results. Study shows that mining multiple level correlations validate the results discovered from mining multiple level association rules and mining cross level association rules. Mining multiple level association allow to mine interesting patterns when data is available at multiple level of abstraction, which has been a common practice nowadays and discovering correlation rules at multiple levels not only affirm the resulting patterns but also indicate the positive or negative relationships in two variables. In this paper for the purpose of simplicity an abstract example similar to real life example is used. More concrete and generalized results can be obtained through the sample of real data which will be studied in our future work.
5.
ACKNOWLEDGEMENT
Our sincere thanks to Professor A.K.Sharma who has contributed constant technical guidance towards the development of this paper.
6.
REFERENCES
[1] J. Han, “Mining Multiple-Level Association Rules in Large Databases”, IEEE TRANSACTIONS ON KNOWLEDGE AND DATA ENGINEERING, Vol. 5, NO. 5, 1999.
[2] R. Agrawal, T. Imielinsk and A. Swami, “Mining Association Rules Between Sets of Items in Large Databases”, Proc. ACM SIGMOD Int’l Conference Management of Data, Washington, D.C. 1993.
[3] R. Agrawal and J.C. Shafer, “Parrallel Mining of Association Rules: Design, Implementation and Experience”, IEEE Transaction Knowledge and Data Eng., Vol. 8, 1996.
[4] R. Agrawal and R. Srikant, “Fast Algorithms for Mining Association Rules, “Proc. International Conference Very Large Data Bases, Santiago Chile, 1994.
[5] R. Agrawal and Srikant, “Mining Sequential Patterns”, Proceeding International Conference on Data Engineering, 1995.
[6] C.K. Leung and D.A. Brajezule, “Efficient Algorithm for the Mining of Constrained Frequent Patterns from Uncertain Data”, SIGKDD Explorations, Volume 11, Issue 2, 2009.
[7] Y. Liu, W. Liao and Alok Choudhary, ” A Two Phase Algorithm for fast discovery of High Utility item sets”, Springer-Verlag Berlin Heidelberg 2005.
[8] Y. M. Huang, J.N. Chen and S.C. Cheng, “A method of Cross-Level Frequent Pattern Mining for Web Instructions”, Education Technology and Society, 10(3), 2007.
[9] S.Bhasgi and P. Kulkarni, “Multilevel Association Rule Based Data Mining”, International Journal of Advances in Computing and Information Researches, Volume 1, No. 2, 2012.
[10]M.S. Gouider and Amine Farhat, “Mining Multi Level Frequent Item sets under Constraints”, International Journal of Database Theory and Applications, Vol. 3, No 4, 2010.
[11]R. Agrawal and R. Srikant, “Fast Algorithm for Mining Association Rules”, Proc. International Conference. Very Large Data Bases, Santiago, 1994.
[12]Shaharanee D.M.. Dillon T.S. and Hadzic F., “Ascertaining Data Mining Rules Using Statistical Approaches”, International Symposium on Computing, Communication and Control, Proc. of CSIT, Vol. 1, 2011.
[13]Shapiro G.P. and Fayyad U.,” An Introduction to SIGKDD and A Reflection on the Term ‘Data Mining”, SIGKDD Explorations, Vol. 13 Issue 2, 2011.
Fig 1. Concept hierarchy of stationary items.
Stationary Items
Pen Marker Calculator Writing Tool
Ball ……
…….. Scientific White Board
Note book
Reynolds
……. …….
Sony