ANALYSIS OF THE
DECENTRALIZATION OF PUBLIC
SPENDING IN SPAIN
Molero, Juan Carlos
University of Navarra
2001
Online at
https://mpra.ub.uni-muenchen.de/8056/
Public Finance and Management,
1(4), 2001 pp. 500-556.
ANALYSIS OF THE
DECENTRALIZATION OF PUBLIC
SPENDING IN SPAIN
Juan-Carlos Molero University of Navarra, Spain
Department of Economics
Abstract
This paper studies the decentralization process of public spending in Spain, which has been one of the main landmarks in recent years, and not only in Spain but also in many different countries. The classical assumption to speak about this kind of processes is the theory of fiscal federalism. However, nowadays this theory is considered more as a set of general "guidelines" than a practical rule of application.
To undertake this study the article proposes a new method to describe the outcomes of the decentralization process through the functional classification of spending. The analysis of the data in each level of government -central, regional and local- is made in order to justify the process. So far, mainly political motives have justified the transference of competencies from the central to the regional and local governments in Spain. The fiscal federalism theory can enlighten our analysis from a theoretical point of view.
Acknowledgements
This article is a partial summary of the author’s thesis, titled: La descentralización del gasto público en España: una contrastación de las teorías del federalismo fiscal, supervised by Professor Maximino Carpio (Autonoma University of Madrid) Ph. D. Dissertation, University of Navarra, Spain, 1998.
I have to give a special mention to Professor Wallace Oates (University of Maryland), who led the first version of this article during my stay as a Visiting Scholar at the University of Maryland. Suggestions coming from Professor Maximino Carpio (Autonoma University of Madrid), and Professor Francesc Pujol (University of Navarra) were also very useful, as well as two other anonymous referees. I am also grateful to Francis Rivera, who edited this paper. All remaining errors are mine.
A prior version of this paper was presented at the 50th IAES Conference, Charleston, USA, October
1. Introduction
To decentralize or not to decentralize? That is the question. Although literature presents arguments supporting both these tendencies, (1) there is not doubt that in recent years one can see worldwide interest in fiscal decentralization: "In Europe, the former Soviet Union, South Africa, and elsewhere, the view that effective government will involve a well-chosen mix of local and central government decision-making is now accepted" (Inman and Rubinfeld, 1997: p. 43) The author includes below some comments that try to justify decentralization in different groups of countries.
In the case of developing countries, where the process of decentralization seems to be a common characteristic (Oates, 1993, 1999), they justify the process as "one possible way of escaping from the traps of ineffective and inefficient governance, macroeconomic instability, and inadequate economic growth" (Bird and Vaillancourt, 2000: p. 1) In this sense, some authors believe that decentralization is a real cause of economic development (see Campbell et al., 1991,
Oates, 1997) However, most of them point out that, without a previous regional and local government structure, decentralization could provoke even greater inequity and macroeconomic instability (Bahl and Linn, 1994, Prud'homme, 1995)
In a way, countries in transition in eastern and central Europe are also trying to approximate first world countries by applying
decentralization processes (Bird et al., 1995, Stewart, 2000) As said earlier, problems also appear in developing countries, for example, in Russia decentralization "has led to growing disparities in the provision of government services across regions, and in particular in the provision of education" (Stewart, 2000: p. 143)
examples. In this country, the issue of decentralization is moving very fast. In recent years, this country is showing a similar situation to others with more federalist traditions, like Germany or Switzerland. With respect to Austria and Belgium, regional governments are even controlling bigger quantities of spending. Spain is clearly a country more decentralized, either from revenue or expenditure point of view, than France. For more information comparing decentralization process in Spain with others developed countries see (Ochando and Toboso, 2000, IMF, 1999, Miñana Simó, 1999, Bel and Castells, 1991) It is the objective of this research to go deeper in studying the decentralization of public spending in Spain.
The article will follow four steps. First, it explains the fiscal federalism theory, exploring afterwards the regional and local governments in Spain, its laws, different legal functions, and competencies. Next, it discusses, among others issues, the methodology used, the period of study: 1984-1997, and the available statistics. After assembling the data, the study describes and justifies the decentralization process of public spending during the chosen period in each level of government. The article ends with some concluding observations.
2. The fiscal federalism theory: a practical rule
or some general “guidelines”?
Generally speaking, fiscal federalism (3) is a study of the interrelations that occur in the public revenues and spending between levels of Public Administration (Domingo Solans, 1977) However, the relationship among decentralization and federalism is not an easy issue to discuss. (Inman and Rubinfeld, 1997, 1998) describe three Principles of Federalism depending on how central
government policies are decided upon:
The principle of economic federalism, or centralized federalism,
prefers the most decentralized structure of government capable of internalizing all economic externalities, subject to the constitutional constraint that all central government policies be decided by an elected or appointed "central planner".
Also the principle of cooperative federalism, or decentralized federalism, prefers the most decentralized structure of government,
unanimously by the elected representatives from each of the lower-tier governments. As is pointed out in section number 3 of this paper, the decentralization process in Spain is working, in some sense, according to this kind of federalism.
In the case of The principle of democratic (or majority-rule) federalism all central government policies are agreed upon by a
simple (51 percent) majority of elected representatives from lower-tier governments. Nowadays, the European Union is following this kind of federalism, combining it with centralized and decentralized federalism for some aspects (Ruiz Álvarez, 1999)
According to (Inman and Rubinfeld, 1997: p. 45), among these three Principles of Federalism mentioned above, (Musgrave's 1959)
and (Oates's, 1972) classic Fiscal Federalism Theory (4) still provides
the most complete description of economic federalism. Basically, this theory has its economic grounds on "the voluntary exchange theory of public economics" of (Musgrave, 1939), "the theory of collective goods", from the contribution of (Samuelson, 1954), and "the fiscal migrations theory" of (Tiebout, 1956) The traditional fiscal federalism theory has become the most important among the fiscal theories, with wider diffusion in economic circles. This led it to being named as a orthodox theory among economists (Casahuga, 1978) Because of this, the author will then offer a brief description of this theory.
The traditional theory of fiscal federalism calls for a general normative framework for the assignment of functions to different levels of government as well as the appropriate fiscal instruments for carrying out these functions (Oates, 1999) (5) Taking into account this framework, central governments would have primary responsibility for two of the three functions which any government must provide: income redistribution and macroeconomic stabilization. Meanwhile, each level of government (in Spain: central, regional or local) would carry out part of the function of allocation, that is, the "provision of goods and services whose consumption is limited to their own jurisdictions" (Oates, 1999: p. 1121)
addition, population interjurisdictional movements can appear and counteract redistribution measures. The same problem can happen with the mobility of taxable factors. Moreover (Oates, 1972, King, 1984, Gramlich, 1987, Feldstein and Wrobel, 1998) support that the aforementioned problems could appear. They do not believe on the success of redistribution functions in any lower government hand. However, opinions from different authors are divided. (Pauly, 1973) says that, in practice, state (regional in Spain) and local governments carry out significant redistribution activity. (Goodspeed, 1989), in one study for the U.S.A., points out that local governments can use income taxation for redistribution purposes.
In the same way, the macroeconomic stabilization function must primarily be in central government hands (Oates, 1972, Castells, 1988, Begg et al., 1993) The control over some national
variables (interest rate, prices, exchange rate, unemployment rate, etc) can not be entrusted to lower government control. And the same conclusion should be addressed for the fiscal and monetary policies, and the public debt. However, some authors say that stabilization could be considered as a public good with a important geographic dimension. In this sense, each region could handle better its own stabilization function, according to different preferences and grades of development, and also different productive specialization between regions (see, for instance, Pauly, 1973, Head, 1976)
With respect to the function of allocation (a good summary of this function can be found in Carpio, 1994, Castells, 1988), the problem is that it is not always easy to find the most effective level of government for the provision of the different goods and services. (6) In this sense, many authors point out that the solution would come from the construction of an "optimal allocation table" between the whole quantity of goods and services, which the public sector must provide, and the different jurisdictional levels providing these services. For the construction of that "table", it would be necessary take into account several principles:
The decentralization theorem: if there are neither cost savings
The principle of "fiscal equivalence" (Olson, 1969): the objective
would be to reach the coincidence between the geographic area of the public good benefits and the jurisdictional area where the government provides that public good.
The theory of optimal jurisdictional size (Buchanan, 1965, (7)
Berglas, 1976, Berglas and Pines, 1981, Scotchmer and Wooders, 1987, Brueckner, 1994): for not fully public goods, this theory tries to determine the population volume who maximizes benefits and minimizes costs in the provision of these public goods, for one constant real provision level.
The "optimal allocation table", described above, tries to find the appropriate degree of decentralization for every country, within the function of an allocation context. In other words, this table tries to understand which goods and services are best centralized and which are best placed in the sphere of decentralized levels of government. But, this being a complex issue brings us closer to the question section 2’ of the paper poses: the fiscal federalism theory: a practical rule or some general "guidelines"?
Criticism against traditional theory of fiscal federalism started very early. Already in 1978, (Casahuga, 1978) pointed out that distribution of functions among levels of government is impossible to apply in the real world as rigid as the fiscal federalism theory suggests. Moreover, the "optimal allocation table" would be far from a real normative rule. With regards to the distribution of functions complexity, (Helm and Smith, 1987: p. VIII) say that the "theoretically appealing separation of efficiency and distribution is however less straightforward in practice. Most of the relevant services are mixed goods -part public and part distributional-". But, even one of its main authors, (Oates, 1999: p. 1122), says that the fiscal federalism theory "does not offer a precise delineation of the specific goods and services to be provided at each level of government"; if so, its precepts then "should be regarded more as general guidelines than firm principles".
theories". However, neither these new attempts are suggesting some practical rule to decentralize more properly from the central to the lower levels of government. In any case, and as we will see in the Spanish case, decentralization can not follow concrete rules, since it occurs in each particular country, "with its own history and traditions and its own specific institutional, political, and economic context" (Bird and Vaillancourt, 2000: p. 2) But, precisely because traditional fiscal federalism theory is not a practical rule, it could continue being useful: it is, for the moment, the best general
guideline trying to enlighten decentralization processes. In this sense
the author will mention it in section 5 of this paper.
3. Regional and local governments in Spain
Before going further, it is necessary to describe the structure of the lower levels of government in Spain, (8) that is: Autonomous Communities (hereafter A.C.), and Local Corporations (hereafter L.C.)
The Spanish Constitution of 1978 (see López Guerra, 1987, Alzaga Villamil, 1978) establishes a special kind of organization for the Spanish State, neither purely federal, nor centralized; it is called "Cooperative Federalism" (9) (Jiménez Arias and Lagos Rodríguez, 1992), in which the main new element is the birth of the A.C. In addition to the provinces and the towns, the A.C. constitute the basic structure of the territorial organization of the State. The change from a centralized state to a decentralized one takes time; it is a slow and difficult process that is still not finished in Spain (Torres Cobo, 1990)
The seventeen A.C. (10) of Spain are divided in different groups, taking into account different aspects. There is more detailed information about that in (López López and Utrilla, 2000: pp. 165-191, Suárez Pandiello: 1999, pp. 222-254, Brosio, 1997: pp. 221-233, Paniagua Soto and Alvarado Pérez, 1997, Tamames, 1995)
According to the way each one became an autonomous region and their responsibilities, one can distinguish two groups.
The first group is named the slow way in Article143 of the
Spanish Constitution or A.C. with low level of responsibilities. These
immediately, but only after five years (even longer in practice) Ten regions used the slow way: Castilla-La Mancha, Castilla y León, Aragón, Extremadura, Cantabria, Asturias, La Rioja, Islas Baleares, Murcia and Madrid.
The summary of the competencies for this group of A.C. (called "common competencies") is included below. Some references about competencies for this group of A.C., and also L.C., are (Monasterio Escudero and Suárez Pandiello, 1998, Torres Cobo, 1995, López Guerra, 1987 –Spanish Constitution of 1978, Article 148-)
- Self-government institutions.
- Some competencies from the Central Administration over the Local Corporations.
- Forestry, agriculture, stockbreeding and fishing. - Dwelling and city planning.
- Roads.
- Ports and airports without trade activity. - Hydraulic issues, channels and irrigated land. - Environmental protection.
- Regional traditions: culture, museums, exhibitions, etc.
The second group is called historic nationalities from Article 151 of the Spanish Constitution or A.C. with high level of responsibilities. These regions assumed immediately all the
competencies prescribed in Article 148. From this group (also called "fast way"), the following regions -7- became A.C.: País Vasco, Cataluña, Galicia, Andalucía, Comunidad Valenciana and Islas Canarias. Navarra used a different way, but also with full
competencies.
Besides the "common competencies" described for the first group, this group of A.C. (with "full competencies") include the following competencies:
- Education in all its branches.
- Social Security (medical care and social assistance-non
contribute pensions-) - Justice and Public Order.
With respect to the competencies described in the previous paragraphs, and according to Article 148.2 of the Spanish Constitution, the first group of A.C. would assume "full competencies" in five years, which would have been in 1983. But, even after law 9 of December 23, 1992, called "transfer of competencies to the regions that became A.C. through the Article 143 of the Constitution", the process has been slower. For more information about that process, I recommend (Aranzadi, 1993-2000, Dirección General de Coordinación con las Haciendas Territoriales, 2000: p. 30, Molero, 1998: pp. 115-119) In this sense, nowadays the situation is:
- Communities included in the first group still have not received competencies in medical care and justice and public order.
- All of them have received the social assistance competence
-non contribute pensions- and other competencies of minor importance.
- Also education (11) in all its branches has been transferred to these A.C.
According to their financing system (see Suárez Pandiello, 1999: p. 204), there are two Foral regime communities (Navarra and País Vasco), which have a special and more autonomous regime of
finance. The rest of A.C. -15- have a Common regime of finance, with a
general (but fundamentally dependent on the central government) system.
According to the number of provinces in their territory (see Suárez Pandiello, 1999: p. 204), one finds 6 one-province communities where provincial governments do not exist and regional governments habe assumed their responsibilities (Asturias, Cantabria, Madrid, Murcia, Navarra and La Rioja) The rest of A.C. -11- are
multi-province communities where provincial governments exist and assume their own responsibilities.
entities (associations, towns grouping, and minor local entities) According to the available information and because of their large amount of spending (see Dirección General de Coordinación con las Haciendas Territoriales, 1999: p. 9), only some of them will be included in the study on local public spending: towns, provinces, islands, and autonomous cities (until 1996) (15) Therefore, the paper refers only to these four entities in the statistics.
Before a brief description of the competencies given to the main entities that compose the L.C. (towns and provinces), (16) some explanation is needed (some important references about the competencies for the L.C. are Ballesteros Fernández, 1994, Font I Llovet, 1992, Cosculluela Montaner and others, 1992, Mir I Bago, 1991, Ortega, 1988, Sosa Wagner and De Miguel García, 1985) First, an important difference to consider is that the A.C. have political autonomy and can issue laws for their self-government; this is not so for the L.C., which have only a role of administrative management. Furthermore, neither the Constitution of 1978, nor the Statutes of Autonomy were very specific with respect to the competencies of the L.C. For instance, the Constitution established just a general "guideline" for them (Sosa Wagner and De Miguel García, 1985: p. 10) Lastly, there are different kinds of competencies that can be assumed for the L.C.: proper, attributed, or shared competencies (there is a good summary of the competencies for the L.C. in Molero, 1998: pp. 123-124)
According to Articles 31.2 and 36.1 of the Spanish Constitution and the "Regulating Local Regime Law" (RLRL), the competencies of the province are: (17)
- Those that guarantee the principles of solidarity and equilibrium for the towns, within a framework of economic and social policy.
- The ones attributed by laws from the central government or the A.C.:
1) Co-ordination of municipal services to guarantee an adequate level of services.
2) Legal, economic and technical aid to municipalities, particularly to those with reduced economic and management capacity.
4) The fostering and administering of the specific interest of the province.
Article 25.1 of the Spanish Constitution says: "The town, in order to manage its own interests and within the area of its competencies, can promote any sort of activities and provide any public services, which contribute to satisfy the necessities and aspirations of the community". That means a concrete group of competencies, which will depend on the level of population of the town. That group consists of:
- Security in public places. - Traffic.
- Citizen protection and fire extinction. - City plan and public ways.
- Historical-artistic patrimony. - Environmental protection.
- Slaughterhouse, markets, and customer protection. - Public health.
- Cemeteries. - Social services.
- Water, electricity, trash collection, and residues. - Public transportation.
- Culture and sports.
- Some participation in education.
4. Objective of the study and methodology
The decentralization of Spanish public spending from the central level of government to the lower ones (regional and local) started in 1978 with the proclamation of the Spanish Constitution. There is in Spain a important reference that studies the decentralization process from the period 1979-1994 (see Braña Pino and Serna de los Mozos, 1999), analyzing the problems that this issue presents. Given the importance of this process, and trying to solve the mentioned problems, the main objective of the present article is to show how that decentralization has worked so far, using the new regrouping of functions included below. In other words, how has this process influenced the functions in which each level of government is spending money? The article tries to answer this question in section
First of all, the period of study will be from 1984 to 1997. The study starts in 1984 because, although the first Statutes of Autonomy were approved in 1979 for two of the seventeen Autonomous Communities (País Vasco and Cataluña), 1984 was "the first year in
which all the Autonomous Communities started to develop their complex activity" (Dirección General de Coordinación con las Haciendas Territoriales, 1986: p. I) Moreover, the last Statutes of Autonomy (to get information about the “Statutes of Autonomy” in Spain see García de Enterría, 1985, Bassols Coma, 1983) were approved in 1983. Furthermore, "1984 is the first year in which all the regional governments had a budget for the entire budgetary period" (Dirección General de Coordinación con las Haciendas Territoriales, 1999: p. 9) The author finishes with 1997, because it is the last year for which the needed statistics are available in all levels of government.
Second, the evolution of public spending in Spain (some references are González-Páramo and López Casasnovas, 1996, González-Páramo and Utrilla, 1992, Valle, 1988, 1989, 1990, Barea Tejeiro, 1988, 1989, González-Páramo and Raymond Bara, 1988,
1 9 8 4 1 9 8 5 1 9 8 6 1 9 8 7 1 9 8 8 1 9 8 9 1 9 9 0 1 9 9 1 1 9 9 2 1 9 9 3 1 9 9 4 1 9 9 5 1 9 9 6 1 9 9 7 0
1 0 2 0 3 0 4 0 5 0 6 0 7 0 8 0
Graph 1: Public Spending Decentralization: 1984-1997. In Percentages Respect to the Consolidated Total Spending.
Borrell, 1988) has had different periods (the statistical information that I have included in this paragraph can be obtained from different sources of information: Dirección General de Coordinación con las Haciendas Territoriales, 1999, Informe Anual del Banco de España, several years, Perspectives Économiques de L'OCDE, 1997, Boletín Económico de Información Comercial Española, 1996, Comin, 1988) The most important period took place between 1976 and 1985, when public spending as a percentage of GIP passed from 27.51% to 44.10%. That period is called the "welfare state". From 1986 until now, growth has continued, but at a slower pace (in 1997 the spending was 52.50% of GIP) In this context, one of the most important events to note is that spending has been decentralized from the Central level of government to the lower ones. Graph 1 (see also appendix 1) above shows a general evolution of this decentralization process. The paper will present in this section some general comments with respect to this graph, after which it will present a deeper analysis in section 5.
Graph 1 above shows clearly that the Central level of government has lost importance with respect to total public spending between 1984 and 1997, and the A.C. and the L.C. have gradually increased their share of public spending. The percentages for the three government levels (Central, A.C. and L.C.) went respectively from 72.6%, 14.4% and 13.0% in 1984, to 53.2%, 30.9% and 15.9% in 1997.
In section number 1, the author pointed out that developing countries and others in transition in eastern and central Europe have tried to use decentralization for economic reasons. On the other hand, developed countries have searched through decentralization for a closer provision of goods and services for their citizens within the new «post-welfare state». Recent works (Besley and Oates, 1999, Bolton and Roland, 1997) have studied political economy questions concerning decentralized systems. The question in this case would be: What "moves" decentralization in Spain? In other words, what reason explains or justifies, in relative terms, why public spending decreases in central government and increases in regional and local governments?
citizens’ preferences (Pérez Blanco, 1995: p. 21, Borrell Fontelles, 1988: p. 181), were demanding wider competencies during Franco's dictatorship (1939-1975), but the centralization was practically absolute during that period and recoveries of decentralization did not find any way of performance until democracy started to work (basically the eighties decade) In this sense, nowadays, most of the authors explaining the decentralization process in Spain (mainly, and among others, Monasterio, 1988, Dizy, 1996, Suárez-Pandiello, 1996, 1999), argue political motives in trying to justify this process. According to (Suárez-Pandiello, 1999: p. 229), "if we are to label the origin of our fiscal decentralization process, I think that 'political' is the correct adjective".
Performing a general analysis of the different levels of government, in 1984, after the transition period from the dictatorship to democracy (1975-1983), the Central level started to decrease its share of public spending with respect to A.C. and L.C. (remember percentages included in graph 1 above) every single year: the decentralization recoveries are working. The only exception were years 1993 and 1994, when the economic crisis in Spain required the implementation of certain centralized decisions. Basically services of social security and social assistance were more needed at national level.
The great "winners" in the whole decentralization process were the Autonomous Communities -see again graph 1-. (Dizy, 1996: p. 69) points out that "the origin of the strong increase of regional spending is not a bigger demand of public services from citizens, or the spending policy adopted by each regional government, but it is the consequence of the political process of construction of the State of the Autonomies". And here, the author has to remark that this process is a political one, because it clearly depends on the political party sign handling the Central level of government. In this sense, the political change from PSOE to PP in 1996 was very important: the percentages of A.C. spending included in graph 1 were from 27.3% in 1995 to almost 31% in 1997. This increase was greater than the one of the period 1990-1995. Again the author remarks here that always "political variables are significant factors in determining the degree of decentralization" (Giertz, 1976, page 205)
included in graph 1 were only from 13% in 1984 to almost 16% in 1997, moreover the tendency of increase was not as regular as the A.C. The main justification of this evolution is that decentralization follows different steps and Spain has finished not even the first one, since the transference of spending competencies from the Central level of government to the A.C. ought to be completed with more income competencies. Moreover, a second step is needed: L.C. receiving more spending competencies from the A.C.; in a real decentralized State, the towns' role must grow (Suárez Pandiello, 1996) The explanation about the role of L.C. in decentralization process will go further in section 5 of this paper.
If, as it has been showed, mainly political motives could justify the spending decentralization in Spain, the following question could be: what is behind those political motives? In other words, why are there no real economic reasons that justify decentralization?
Following (Angelet, 1997: p. 140), the answer is that the democratic development (at the same time, the main cause of the decentralization) did not incorporate so far (at least for our period of study: 1984-1997) relevant levels of rationality and economic efficiency with respect to decisions about functional and territorial allocation of public spending. For instance, important decisions of public investment were taken without objective bases or explicit criteria, which justify rationally their priority and quantity.
After a description of the preliminaries needed, the author has to point out that the main objective of this article is to examine how the decentralization process, generally described above, has influenced the final destination (or functions) of public spending in the different government levels. The methodology chosen for reaching this goal is the study of the statistics of public spending between 1984 and 1997 in each single level of government, taking into account the functional classification of spending. (18) This classification shows the destination of the spending. The sources are:
- Classification of the Public Administration Functions (C.P.A.F. system), approved from 1984 and also called United Nations System. It was assumed also for the European
- Another classification arose from the Ministerial Order of November 14, 1979 and was applied in 1980: this is
usually called the old classification. Mainly the Local
Corporations used it, although some towns are still using it.
- The new functional classification, also called programmatic, appeared with the Ministerial Order of September 20, 1989. Nowadays, most of the administrations are
using this classification.
The main problem in comparing statistics is the heterogeneous use of the classification of expenditures between the different levels of government. The "functional problems", among others, were the following (see Molero, 1998: pp. 235-237, 268-274, 302-312):
- For the Central Government the statistics between 1984 and 1997 involve a new functional classification. The
information is also consolidated, (19) and the author was able to obtain statistics on real levels of spending, (20) not just the budgetary levels. It is the only level where the author did not find any statistical problems.
- For the Autonomous Communities there was no information regarding real spending according to the new functional classification since 1984. Therefore, only the
statistics of the budgeted spending (21) were available from 1988 to 1997 according to that classification. At least, it was consolidated information.
- With respect to the Local Corporations, there were data on real spending between 1984 and 1989 according to the
old functional classification (not consolidated information for
those years), and there was no global functional information for 1990 and 1991. (22) Between 1992 and 1997 the statistics were consolidated and most of the local administrations were using the new functional classification.
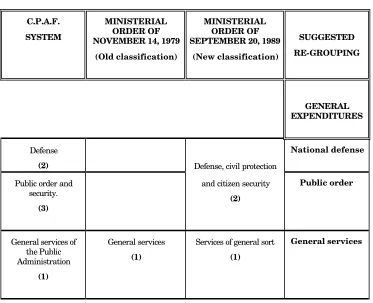
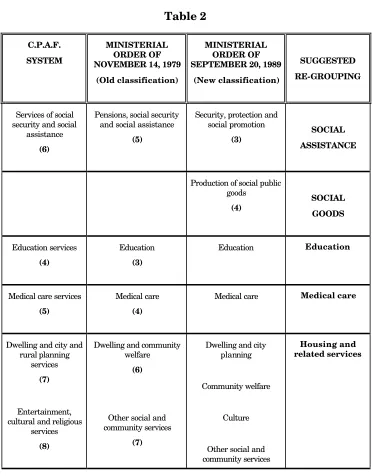
methodological solution this paper proposes involves a new re-grouping of spending functions.
The relationship between that re-grouping and the three different functional classifications is included in the tables below. Numbers in brackets refer to the number of the functional group for
the new classification, and to the number of the function for the old classification and the "C.P.A.F. system". (23) Moreover, the author
[image:18.612.121.494.317.620.2]has to point out that sometimes the re-grouping was easier than others. For instance, it was more difficult for groups like: "housing and relative services" (table 2) or "spending on others services" (table 3) In both cases there was much heterogeneity among the three different functional classifications.
Table1
C.P.A.F. SYSTEM
MINISTERIAL ORDER OF NOVEMBER 14, 1979
(Old classification)
MINISTERIAL ORDER OF SEPTEMBER 20, 1989
(New classification)
SUGGESTED RE-GROUPING
GENERAL EXPENDITURES
Defense
(2) Defense, civil protection
National defense
Public order and security.
(3)
and citizen security
(2)
Public order
General services of the Public Administration
(1)
General services
(1)
Services of general sort
(1)
Table 2
C.P.A.F. SYSTEM
MINISTERIAL ORDER OF NOVEMBER 14, 1979
(Old classification)
MINISTERIAL ORDER OF SEPTEMBER 20, 1989
(New classification)
SUGGESTED RE-GROUPING
Services of social security and social
assistance
(6)
Pensions, social security and social assistance
(5)
Security, protection and social promotion
(3)
SOCIAL ASSISTANCE
Production of social public goods (4) SOCIAL GOODS Education services (4) Education (3)
Education Education
Medical care services
(5)
Medical care
(4)
Medical care Medical care
Dwelling and city and rural planning
services
(7)
Entertainment, cultural and religious
services
(8)
Dwelling and community welfare
(6)
Other social and community services
(7)
Dwelling and city planning
Community welfare
Culture
Other social and community services
Housing and related services
C.P.A.F. SYSTEM
MINISTERIAL ORDER OF NOVEMBER 14, 1979
(Old classification)
MINISTERIAL ORDER OF SEPTEMBER 20, 1989
(New classification)
SUGGESTED RE-GROUPING
Fuels and energy services
(9)
Services of agriculture, forestry,
fishing and hunting
(10)
Mining services, except fuel for manufacture and construction (11) Transportation and communication services (12)
Other issues and economic services
(13)
Economic services
(8)
Production of economic public goods (5) (Communications, transportation, agrarian structures, scientific research, etc.) General economic regulation (6)
(Economic and financial regulation)
Economic regulation of productive sectors
(7)
(Agriculture, stockbreeding, fishing, industry, energy, mining,
tourism, etc.) SPENDING ON OTHER SERVICES Non-classified spending (14) Non-classified
(9)
NON-CLASSIFIED
Grants to other public administrations, national
or international
(9)
Grants to other public administrations
Public debt (1)
(0)
Public debt (1)
(1) The expression "public debt" does not mean the total public debt, but makes reference only to the amortization of the payable credits plus the interest for each year.
This section will show the main results of the research for the three levels of government. The author will use the suggested "re-grouping" of the different expenditures according to tables 1, 2, and 3. Data will be presented in percentages (24) of total public spending at the respective level of government for each year, because this will be the clearest way to present comparisons among the different government levels.
5.1. Central Government
Through decentralization process, as it was shown in graph 1, Central Administration has decreased the quantity of spending from 1984 to 1997. The objective now is to analyze how its composition has changed. The evolution of the performed spending in the Central Administration is shown in graph 2 below (and appendix 2) Since the percentages for 1997 are distorted, (25) one has to pay attention to the period 1984-1996.
Looking at that period, one could say that, in spite of the decentralization, the percentage of social assistance with respect to
total central government spending changed insignificantly between 1984 and 1996: from 35.97% to 34.59% respectively. The justification of this evolution is that pensions (basically retirement and
unemployment pensions), which are the main component of the social assistance, remain centralized at the Central Administration. This happens because of political interests which maintain control over this spending category, since social assistance spending has also a clear distribution component of incomes all over the country, there are also economic reasons that determine its centralization. At the same time, and partially following (Borrell Fontelles, 1988), one can not associate pensions to only one level of government, because there is a spending of all administrations, which should be handled by the central one.
In the same way, spending on social goods practically maintain
their percentage importance: they went from 17.73% in 1984 to 16.48% in 1996. Within this spending category, the decrease of
education was caused, among other reasons, by the decrease of the
birthrate which let lower quantity of spending on education. The decrease of housing and related services was determined by
preferences of citizens. Medical care increases since the Central level
is still handling this service in ten A.C. and because during the period of analysis there was remarkable increase of senior citizens.
In contrast, the share of general expenditures (national defense, public order and general services) decreased between 1984
and 1996. They went from 9.36% of total central government spending to 5.80%. Expenditure on national defense decreased the
most. The reason for this is a new international framework at the European Union where the protection of Spain is guaranteed (IGAE, 1998: p. 123) This also makes sense the increase of external relations
spending -within general services category- (IGAE, 1997: p. 120)
However, the spending group that really lost importance during our period of study was spending on other services. The
Graph 2: Functional Distribution of Central Government Spending (% of the Total Central Administration Spending)
0% 5% 10% 15% 20% 25% 30% 35% 40% 45% 50%
1984 1985 1986 1987 1988 1989 1990 1991 1992 1993 1994 1995 1996 1997
statistics show that central government level lost most of its control over this group of expenditures (mainly production of economic public goods and spending on economic regulation of productive sectors) In
1984 the percentage of total central government spending was 22.26%, and in 1996 it fell to 10.28%, almost 12 points. According to IGAE (1987: p. 206; and 1991: p. 140), the determinants -mainly economics- of this decrease are many and difficult to list. Among others, the better results and financial situation of the entrepreneurial sector and the assumption of competencies from A.C. Moreover, fewer resources have been assigned to the sub-function
agriculture, stockbreeding and fishing.
Finally, decentralization took place within the Central Government, and this tendency continues today, an increase in the
non-classified group of expenditures, that went from 14.69% over the
total central government spending in 1984 to almost 33% in 1996. Basically, both of its components increased in this period. The grants to other public administrations subgroup had a continuing increase,
caused by the special financing system working at the regional and local levels of government (IGAE, 1987: p. 161; and 1991: p. 140) These grants were even bigger that the grants to the European Community, see (IGAE, several years) The increase of the public debt
was another great effect of the decentralization; the percentages went from 7.84% of total central government spending in 1984 to almost 20% in 1996. This happened because until 1997 Central level had less control over deficits, (26) which were mainly financed by debt. The situation changed since June 1997, where European Union's Council approved the Stability and Growth Pact (27) (see Ruiz Álvarez, 1999: p. 5) In this sense, Central government decided to pay off in advance a bigger quantity of public debt that year, and here is the distortion of the statistics mentioned above.
5.2. Autonomous Communities (A.C.)
one needs to distinguish what happened in the two different kinds of A.C., that is, the A.C. with "high level of competencies" and those with "low level of competencies" (see appendix 4) The author will try to analyze what has determined the spending behavior in these two different kinds of regions.
Expenditure on social goods (see graph 3) in the A.C. was
56.30% of the total A.C. expenditure in 1988, and 52.34% in 1997. In the same way, spending on social assistance decreased less than two
points between these years. The key point behind these data is that A.C. with "high level of competencies" absorbed most of the spending on social goods and social assistance (see graph 4), because of their
higher level of competencies (basically on medical care and education) Expenditures on these groups started growing between
1984 and 1988 (28) (when they received most of their competencies, although statistics are not available for this period) and the tendency continues from 1988 to 1997 in most of them. The contrary happened in the regions with "low level of competencies", where spending percentages on social assistance and social goods (see graph 4) were
clearly lower, and decreased in most of these A.C. between 1988 and 1997. The influence of this group of regions caused the decrease of
Graph 3: Functional Distribution of Autonomous Communities Spending (% of the Total A. C. Spending)
0% 10% 20% 30% 40% 50% 60%
1988 1989 1990 1991 1992 1993 1994 1995 1996 1997 G e n e ral Ex p e n d i tu re s S o c i a l A s s i s t a n c e
global percentages on social assistance and social goods referred to
the beginning of this paragraph.
The statistics for the period 1998-2001 will reflect the influence of the A.C. with "low level of competencies", which are receive during these years more competencies for social goods,
basically non-university education. (29)
This is the situation, but what is the cause? According to
(Brosio, 1997: p. 214), "the reasons behind the creation of the hybrid Spanish system -often referred to as a "multispeed regional system"- are to be found..., in the linguistic differences..., and in the separatist tendencies of some regions". In this sense, greater historical background has allowed some regions to claim control over specific social goods, primarily in education and medical care (Dizy, 1996) The
simulation study made for the year 1993 by (Monasterio Escudero and Suárez Pandiello, 1998: p. 59), show that over all the competencies one region can assume, the quantitative weight of
education and medical care, as spending categories, could represent
even more than 80% over the total competencies. This explains two things. First, the great interest that some regions (the ones with more historical background) have to assume these competencies .
Graph 4: Evolution of Autonomous Communities Social Assistance + Social Goods Spending (% of the Total Spending in each A. C.)
0% 10% 20% 30% 40% 50% 60% 70% 80%
ANDALUCIACANARIASCATALUÑA
GALICIANAVARRA
PAIS VASCOVALENCIA ARAGÓNASTURIASBALEARESCANTABRIA
CASTILLA-LA MANCHA
CASTILLA-LEÓNEXTREMADURA
LA RIOJAMADRIDMURCIA
Second, the big percentages that social assistance and social goods, as
categories of spending, represent over their total spending in these regions: for instance, 75% in the Autonomous Community of Valencia
(see graph 4)
Something similar, but in the opposite direction, happened with the expenditure group called in this article spending on other services -mainly production of economic public goods and
expenditures on economic regulation of productive sectors- (see graph
5) In this case, most of the A.C. with "low level of competencies" increased their percentages on this spending group between 1988 and 1997. On the other hand, only three of the A.C. with "high level of competencies" followed this pattern; moreover, all of them had, for that same period, smaller percentages of these expenditures with respect to those with "low level of competencies". Taking into account this explanation, it is easier to understand that the global
spending on others services percentages in all A.C. increased: from
18.30% respect to the total A.C. spending in 1988 to 20.90% in 1997 (see graph 4)
Graph 5: Evolution of Autonomous Communities Spending on Other Services (% of the Total Spending in each A. C.)
0% 10% 20% 30% 40% 50% 60%
ANDALUCIACANARIASCATALUÑA
GALICIANAVARRA
PAIS VASCOVALENCIA ARAGÓNASTURIASBALEARESCANTABRIA
CASTILLA-LA MANCHA
CASTILLA-LEÓNEXTREMADURA
LA RIOJAMADRIDMURCIA
The question here would be: Why is this spending category smaller in A.C. with "low level of competencies"? Two reasons could
explain this trend. First, they are A.C. with less historical background, receiving first competencies in economic public goods
and economic regulation of productive sectors from Central
government (see Molero, 1998: pp. 295-296) and then in social goods
(as it is starting to happen nowadays) Second, most of these regions have been (and they continue to be), for the period of analysis of this paper, within the group of the less developed regions of Spain, receiving grants from the European Union. (30) These were precisely grants to improve basic infrastructures (transportation, energy, etc.), scientific research, agriculture, etc. In other words: grants on
economic public goods and economic regulation of productive sectors.
According to (Utrilla, 1996: p. 269), the regional incidence of EU grants is very different among A.C.: bigger than 30% of the budgetary incomes in regions like Castilla-La Mancha, Castilla y León and Extremadura, and only 2% in Cataluña, Madrid, Navarra and País Vasco. In general, there is a great relationship between A.C.
competencies, the quantity of EU grants and the degree of regional development.
Graph 6: Evolution of Autonomous Communities General Expenditures (% of the Total Spending in each A. C.)
0% 2% 4% 6% 8% 10% 12% 14% 16%
ANDALUCIACANARIASCATALUÑA GALICIANAVARRA
PAIS VASCOVALENCIA ARAGÓNASTURIASBALEARESCANTABRIA
CASTILLA-LA MANCHA
CASTILLA-LEÓNEXTREMADURA
LA RIOJAMADRIDMURCIA
As it was analyzed in section 5.1, general expenditures did not
increase for the Central Government during the period 1984-1997, and neither did they increase for the Autonomous Communities (see graph 3); rather they did not change too much, going from 4.47% over the total A.C. spending in 1988 to 3.65% in 1997. Graph 6 above show that, due to decentralization process, these expenditures lost importance in most of the A.C.: both with high or low level of competencies. During our period of analysis the region of País Vasco
shows bigger percentages on general expenditures, see (Dirección
General de Coordinación con las Haciendas Territoriales, 1998: p. 303) for more information. The justification here is that this Autonomous Community has a special problem to solve (the terrorism), which is causing bigger spending on public order, and
three provinces with a special Foralregime of financing, which need
more coordination from the regional level, causing bigger spending on general services.
Graph 7: Evolution of Autonomous Communities Non-Classified Spending (Grants + Public Debt)
(% of the Total Spending in each A. C.)
0% 5% 10% 15% 20% 25% 30%
ANDALUCIACANARIASCATALUÑA GALICIANAVARRA
PAIS VASCOVALENCIA ARAGÓNASTURIASBALEARESCANTABRIA
CASTILLA-LA MANCHA
CASTILLA-LEÓNEXTREMADURA
LA RIOJAMADRIDMURCIA
Looking again at graph 3 above, the non-classified group of
expenditures had a clear growth for the A.C.: from 12.65% of the total spending in 1998 to 16.43% in 1997. However, the components of this group showed different evolutions. The grants to other public administrations subgroups had an irregular tendency to fluctuate
among the different years of the period. In contrast, the public debt
subgroup went from 1.97% in 1988 to almost 7% in 1997, with a regular growth during the whole period. The debt levels were higher in the A.C. with "low level of competencies" than in the ones with "high level" -see graph 7 above- (see for that information Dirección General de Acción Económica Territorial, 1996: p. 285, Dirección General de Coordinación con las Haciendas Territoriales, 1999: pp. 77-333)
The justification of the general growth of the debt in all the A.C. can be explained by the fact that most of the communities suddenly found that they had to increase their spending (thanks to the decentralization process), with a lack of experience in that matter and, in many cases, without the right means to finance it. This problem is greater in the regions (15 over the total of 17) with a
Common regime of financing, (31) because there is a lack of "fiscal
co-responsibility" among incomes and spending: the financing system is mainly based on grants coming from the Central government, instead of on the taxing power of the regions. The study of A.C. financing system is a really interesting topic, but one can not go further in this paper. Two authors who make great contributions are (Rubio and Sanz, 2000, Monasterio Escudero, 1997) Other important works about the financing means for the A.C. are, for instance (Monasterio Escudero and Zubiri, 1996, Martínez García-Moncó, 1996, Ezquiaga, 1996, Utrilla de La Hoz, 1995, several authors, 1995, Ruíz-Huerta Carbonell and López Laborda, 1995, Carpio, 1994, Monasterio Escudero, 1988)
As a summary, through the decentralization process, A.C. in Spain are spending basically more on social assistance, social goods, economic public goods and economic regulation of productive sectors. In
preferences. In this instance, one can think that decentralization makes sense, and, generally speaking in the context of traditional fiscal federalism theory, it can bring us closer to the theory of optimal jurisdictional size and to the principle of "fiscal equivalence". (32) But,
the problem is that, from an economic point of view, it is hard to explain why they are so many differences among regions. According to (Rosselló Villalonga, 2001: p. 20), "it seems that the level of population, the size of the territory or even historical arguments, cannot explain how regions were created. Although most of the theories related to the creation of new jurisdictional units assume that regions are created on an economic basis, the present territorial division in Spain is largely culturally and political determined", what is conditioning, at the same time, A.C.'s financing system, which is not based on the volume of assumed responsibilities, bringing us further off the principle of "fiscal equivalence. Moreover, "the lack of
an explicit agreement about the ceiling of responsibilities to be reached by A.C....has produced a series of juridical conflicts and inefficient duplicities of bureaucratic organisms" (Suárez-Pandiello, 1999: p. 232)
Because decentralization is caused largely by political reasons, it is therefore difficult to justify it through the fiscal federalism theory, which is based mainly on economic arguments. (for
a wider information in this sense, see Suárez-Pandiello, 1999: pp. 229-232, 250-251) From the spending point of view, regions are carrying out significant redistribution and stabilization activity. In this case, the economics arguments for the centralization of redistribution and stabilization functions does not work. In general,
economic federalism (33) seems too be biased in favor of
centralization, while cooperative federalism (the case of Spain) seems
to favor the fiscal constitution too in the other direction (Inman and Rubinfeld, 1997: p. 50) On the other hand, and from the point of view of income (although going further from the objective of this article), "fiscal decentralization in Spain...respects to a high degree fiscal federalism theory guidelines..., because taxes more closely related to redistributive or stabilising activities (income tax or corporation tax for example) were not decentralised with the exception of Foral regimes" (Suárez-Pandiello, 1999: p. 250)
As it has been already showed (remember graph 1), Local Corporations have not received many advantages from the decentralization process this paper is analyzing. Their spending only increased from 13% of total spending of Public Administrations in 1984 to almost 16% in 1997. Therefore, the interest of this section is to study if at least the spending composition has changed.
Looking at graph 8 below, one observes that spending percentages on social assistance did not change too much for L.C.
during the period of 1984-1997. One can also see that expenditures on
social goods (education, medical care and housing and related services) accounted for every single year of that period, the largest
fraction of total spending of L.C. However, these expenditures decreased from 44.16% in 1984 to 33.58% in 1997.
The determinant of the evolution of social goods spending is
that the local level of government was not the one that received competencies like education or medical care through the first step of
the decentralization process; rather it was the regional level that received them. For this reason, L.C. lost "power" in these spending groups between 1984 and 1997. In this sense, one could argue again political reasons driving this evolution.
Graph 8: Functional Distribution of Local Corporations Spending (% of the Total L. C. Spending)
0% 5% 10% 15% 20% 25% 30% 35% 40% 45% 50%
1984 1985 1986 1987 1988 1989 1990 1991 1992 1993 1994 1995 1996 1997
But, Local Corporations increased its percentages of spending on housing and related services with respect to the total spending on social goods: they went from 73% in 1984 to 84% in 1997 (see
appendix 5), even though this expenditure decreased with respect to total spending of L.C. This implies that, in some sense, the internal change within the category of social goods spending has also been
driven by economic determinants, because L.C. are more efficient and possess a greater knowledge of citizens' preferences for the provision of housing and related services spending (Ahmad et all., 1995)
The general expenditures group decreased at the central level,
but neither of the lower governments offset this reduction (see again graph 8) As it happened at the regional level, in the L.C. the percentages of this spending group also decreased. As can be seen, they went from 20.48% with respect to total spending in this government level in 1984, to 16.13% in 1997. In this case, The author believes that the Local Corporations, through the decentralization process, should have increased spending in this group: that is, expenditure on goods and services where L.C. have most of their competencies, as it has been seen in section three. Examples of these competencies are: security in public places, traffic, citizen protection and fire extinction, city plan and public ways, cemeteries, water, public lighting, trash collection, public transportation, etc. As for the case of housing and related services, there was sufficient economic
determinants for hoping the increase of general expenditures
category.
With respect to spending on other services group, which
decreased in the Central government, one sees that it clearly increased in the L.C., where the percentages went from 6.15% in 1984 to 13.29% in 1997. In this case, the local level received the "power" over this spending group through decentralization.
other hand, there are some economic reasons, because citizens are nowadays demanding to the L.C. newer kinds of services belonging to this spending category.
Finally, the percentages on non-classified expenditures
(grants to other public administrations and public debt) increased in
the period of study; they went from 21.67% of total L.C. spending in 1984, to 28.34% in 1997.
The importance of the subgroup grants to other public administrations was basically due to one of the local governments
called "Foral deputations" (35) of the Autonomous Community País Vasco, that have special competencies in this Community. In fact, the
financing of País Vasco is performed through grants coming from
"Foral Deputations".
In this government level, the public debt reached important
percentages during all the years of the period, but without high differences between 1984 and 1997. The justification of this persistent debt is that L.C. do not have the right means for financing their competencies, by not having sufficient grants coming from Central Government and A.C. Literature presents some papers (see Pérez García, 1995, Suárez-Pandiello, 1997, 2000, Ezquiaga, 2000) explaining the incomes' aspect for local government. In this sense, (Ezquiaga, 2000: p. 232) consider rachitic the tributary incomes L.C.
are handling. (Pérez García, 1995: p. 16) says that L.C. need a firm horizon of stability in both aspects: competencies and financing incomes.
As a summary, through decentralization process, L.C. in Spain are spending basically on housing and related services (relating to the
total of social goods) and economic regulation of productive sectors.
Although the author has pointed out above some economic reasons, again mainly political determinants have driven that process. Because of that, the study about how the decentralization process to L.C. in Spain has followed the general guidelines of the fiscal federalism theory is as unclear as the one that the author did for
In this sense, the author thinks some tendencies seems to bring us closer to those general guidelines. First, as in A.C., the taxes
which are more closely related to redistribution or stabilization activities were not decentralized to L.C. Second, the increase of
housing and related services spending category shows a greater
search of the coincidence between the geographic area of public good benefits and the jurisdictional area where the government provides that public good (the principle of "fiscal equivalence") and also a
maximization of benefits and a minimization of cost in its provision (the theory of optimal jurisdictional size)
But, other tendencies seems to bring us further off the general
guidelines of the fiscal federalism theory. First, L.C. are carrying out
redistribution and stabilization activity. Second, L.C.'s financing system, is not based on the volume of assumed responsibilities (against the principle of "fiscal equivalence")
6. Concluding observations
The most challenging task in this research was to find the statistics and, after that, to classify them in the most useful way in order to study how public spending decentralization takes place in Spain. In spite of the complexity of this enterprise, the paper provides a general picture of the evolution of spending among the different levels of government.
The main point is that the real "winners" of the decentralization process has been the A.C., which have increased their redistribution and stabilization activity during the period of analysis, but with many differences among the A.C. with "high level of competencies" and the ones with "low level of competencies". Moreover, the main problem here is that the process should have had a clearer arrival point and a parallel process of income decentralization from Central government.
In the case of L.C., they have reached greater percentages on stabilization spending, but here the process has just begun and nothing is really done. Again here, a greater means to finance the competencies transferred is needed in the local government.
mainly based on economic arguments, is not a clear issue. It will depend of the kind of aspects from what the process is seen.
Literature presents many authors who summarizes the problematic issue this paper handles. For instance, according to (Suárez-Pandiello, 1999: p. 251), "the Spanish process of decentralisation continues to be an incomplete and fundamentally unstable system, due...to the fact that its origin was political rather than economic". In this sense, (Rosselló Villalonga, 2001: p. 23) points out that the "inefficiencies are due to the non-cooperative behaviors of regional governments and to the competition that arises between all levels of government".
APPENDIX 1: Consolidated spending of the Public Administrations. Decentralized structure. Statistics in millions of pesetas and in percentages respect to the
consolidated total. CENTRAL
LEVEL (1) and (2)
A. C. (2) and (3)
L. C. (2) and (4)
PUBLIC ADMINISTRATIONS
Total % Total % Total % TOTAL %
1984 6,178,150 72.6% 1,227,650 14.4% 1,106,640 13.0% 8,512,450 100% 1985 6,931,130 70.7% 1,545,960 15.8% 1,321,600 13.5% 9,798,700 100% 1986 7,311,833 68.7% 1,833,479 17.2% 1,500,853 14.1% 10,646,165 100% 1987 7,711,673 66.6% 2,167,328 18.7% 1,692,919 14.6% 11,571,920 100% 1988 7,635,427 61.5% 2,816,318 22.7% 1,963,472 15.8% 12,415,217 100% 1989 9,150,571 60.7% 3,488,127 23.1% 2,437,762 16.2% 15,076,460 100% 1990 10,508,887 59.6% 4,210,321 23.9% 2,915,305 16.5% 17,634,513 100% 1991 11,169,503 58.3% 4,869,870 25.4% 3,104,698 16.2% 19,144,071 100% 1992 12,207,146 57.0% 5,704,963 26.6% 3,519,570 16.4% 21,431,679 100% 1993 13,573,856 58.1% 6,179,590 26.4% 3,618,649 15.5% 23,372,095 100% 1994 15,016,092 58.8% 6,806,344 26.7% 3,711,579 14.5% 25,534,015 100% 1995 15,367,393 58.0% 7,234,838 27.3% 3,872,514 14.6% 26,474,745 100% 1996 15,140,370 55.6% 7,930,660 29.1% 4,160,668 15.3% 27,231,698 100% 1997 14,771,943 53.2% 8,588,785 30.9% 4,427,368 15.9% 27,788,096 100% (1) Unemployment and Social Security pensions are not included.
(2) The spending in financial liabilities variation is not included.
(3) A.C.= Autonomous Communities.
(4) L.C.= Local Corporations.
Bibliography: Self elaboration from: Dirección General de Coordinación con las Haciendas Territoriales. La descentralización del gasto público en España. Periods: 1984-1994, 1985-1996
APPENDIX 2: Evolution of the functional distribution of the performed spending in the Central Administration. Period 1984-1997. In percentages respect to the total
Central Administration spending.
1984 1985 1986 1987 1988 1989 1990 General
Expenditures
9.36% 9.80% 8.60% 8.96% 8.49% 7.34% 7.19%
National Defense
5.62% 5.57% 4.92% 5.25% 4.61% 3.94% 3.58%
Public Order 2.27% 2.69% 2.36% 2.31% 2.40% 2.08% 2.15% General
Services
1.47% 1.54% 1.31% 1.40% 1.48% 1.32% 1.45%
Social Assistance
35.97% 36.74% 34.97% 34.78% 34.34% 31.89% 34.43% Social Goods 17.73% 17.85% 16.37% 16.81% 18.64% 16.73% 16.83%
Education 5.05% 4.74% 4.27% 4.17% 4.82% 4.17% 4.49% Medical Care 11.17% 11.50% 10.73% 11.39% 12.74% 11.50% 11.36% Housing and
related Services
1.51% 1.62% 1.37% 1.26% 1.09% 1.06% 0.98%
Spending on other Services
22.26% 16.59% 14.28% 13.82% 15.51% 14.11% 13.20% Non-Classified 14.69% 19.02% 25.79% 25.62% 23.02% 29.93% 28.36%
Grants to other Public
Administration s
6.85% 7.35% 9.47% 11.41% 11.63% 10.99% 12.03%
Public Debt 7.84% 11.66% 16.32% 14.21% 11.38% 18.94% 16.33%
TOTAL SPENDING
100.00% 100.00% 100.00% 100.00% 100.00% 100.00% 100.00% 1991 1992 1993 1994 1995 1996 1997 General
Expenditures
7.80% 5.76% 6.15% 5.72% 6.19% 5.80% 4.52%
National Defense
4.36% 2.54% 2.86% 2.57% 2.79% 2.54% 2.07%
Public Order 2.08% 1.95% 1.91% 1.81% 1.89% 1.88% 1.43% General
Services
1.36% 1.27% 1.37% 1.35% 1.51% 1.38% 1.01%
Social Assistance
34.56% 34.61% 36.15% 36.19% 36.58% 34.59% 28.02% Social Goods 16.68% 16.53% 16.67% 16.91% 17.53% 16.48% 12.97%
Education 4.43% 3.72% 3.78% 3.70% 3.97% 3.21% 2.49% Medical Care 11.41% 12.17% 11.93% 12.32% 12.62% 12.31% 9.84% Housing and
related Services
0.85% 0.64% 0.96% 0.89% 0.95% 0.95% 0.64%
Spending on other Services
11.88% 10.03% 10.98% 10.79% 10.55% 10.28% 7.53% Non-Classified 29.08% 33.07% 30.06% 30.39% 29.16% 32.85% 46.96%
Grants to other Public
Administration s
11.73% 12.88% 13.21% 13.54% 12.81% 13.39% 11.83%
Public Debt 17.35% 20.19% 16.85% 16.85% 16.35% 19.46% 35.13%
TOTAL SPENDING
Bibliography: Self elaboration from: Intervención General de la Administración del Estado.