PUBLIC DEBT MANAGEMENT
Hanif, Muhammad N.
2002
Online at
https://mpra.ub.uni-muenchen.de/10212/
PUBLIC DEBT MANAGEMENT
by
Muhammad Nadeem Hanif *
1. Introduction
Growing public debt is a worldwide phenomenon. It has become a common feature of the fiscal sectors of most of the economies. Contemporary economic wisdom does not consider public debt a major problem per se; rather problem is the mismanagement and unsustainability of the public debt. The modern theory for public debt sustainability discerns a fundamental relationship between economic stability and debt sustainability in a country. The inadequate debt management and a permanent and unlimited growth of debt to GDP ratio may result in some negative tendencies and changes in main macroeconomic indicators, like crowding out of investment, financial system instability, inflationary pressures, exchange rate fluctuations etc. There are also certain social and political implications of unustainable debt burden. Persistent and high public debt calls for a large piece of budgetary resources for debt servicing. For example, in Pakistan debt servicing uses up more than fifty percent of the total revenues (Table 6). Consequently, the government is forced to cut allocations for other public services and it faces serious difficulties in executing its electroal manifesto, if it has. Still more serious implications of high and unsustainable public debt are possibilities of windespread bankruptcies like in Mexico and Latin American countries during 1980s.
This paper examines the issue of managing public debt and analyses the present situation of pulbic debt in Pakistan. The next section discusses some theoretical aspects of the public debt including the debt management while Section 3 presents objectives and the functions of debt management and the location of the debt managment functions. Section 4 examines the situation of public debt in Pakistan. It details the structure of the public debt in Pakistan and analyses the trends in debt servicing. It also looks into the manageability and sustainability of the debt in Pakistan using some indicators of debt burden. The last section concludes the paper.
2. Theor etical Aspects of Public Debt
When the government resorts to borrowing instead of introducing additional tax measures, to finance the budget deficit, it creates a liability on itself known
This paper was written in December, 2001, Helpful comments from Rehana Siddiqui and Seminar participants at the Pakistan Institute of Development Economics (PIDE), Islamabad are greatly acknowledged. The author is Assistant Director in State Bank of Pakistan, Karachi. At present he is Ph. D. Candidate at PIDE. However, views expressed should not be attributed to the SBP or PIDE.
as public debt. A government has various alternatives to borrow from for the purpose of financing fiscal deficit. One way is to borrow directly from the central bank which is equivalent to printing of money. The other alternatives are; borrowing from domestic commercial banks, borrowing from domestic non-bank sector and borrowing from external sources. Each method has its own implications for various aspects of the economy. Government usually adopts a mix strategy and utilises a number of options at the same time.
Public debt accumulates over time if deficit in the budget persists for a long period of time. Here a number of questions arise: Does it make any difference whether the government pays for its expenditures by raising taxes or by issuing debts? What are the implications if debt is issued to central bank, domestic commercial banks, domestic non-banks or external sector? Is debt really a burden and under what conditions it becomes unmanageable and unsutainable? Different groups of economists have different views on these issuses.
With regard to the first question an important group of perfessionals believes in “Barro-Ricardo proposition of equivalence. ” The proposition is that there is basically no difference between the two ways of financing the deficit i. e. raising taxes or issuing debt. The argument is that financing deficit by issuing bonds merely postpones taxation. In a future time period the government has to raise taxes to service the debt and there is no difference (after proper discounting) between present and future taxes. When government finances its deficit by debt, people realise that they have to pay higher taxes in future. Thus, the people in anticipation of future payment of taxes do not consume increase in incomes due to expansionary fiscal policy. The proposition, therefore, suggests that private savings will increase due to debt financing (Barro, 1989). If the propostition holds then the budget deficit does not exert any pressure on interest rates and there is no fear of crowding out. However, empirical evidences do not support this proposition. The sharp decline in US Private saving rate during 1980s is obvious evidence against it. With respect to developing countries Haque and Montiel (1988) tested the equivalence hypothesis for a sample of sixteen countries and rejected it for fifteen countries including Pakistan.
Although Barro-Ricardo equivalence hypothesis is not proved for its consequences on private savings yet it has some implications on social grounds.The government who issues debt to finance its expenditure actually transfers tax burden to coming generations. Thus the debt finance policy gives all the benefit to current generation and postpones the burden of deficit to be borne by the comming one.
Public debt issued to different entities has different implications on macroeconomic variables. If debt is issued directly to central bank it increases the high power money which in turn transforms into monetary expansion through money multiplier. 1
Three benfits can be identified for the current generation; first their disposable income may rise due to expansionary fiscal policy (low taxes and high public expenditure), second they may enjoy high level of public services and third, since debt issued is the asset of the lenders, their net wealth may increase. Whereas coming generations may face tight fiscal policy, high taxes and inadequate public services.
This mode of financing is considered highly inflationary and thus economists generally discourage borrowing from the central bank. A significant part of public debt is owned by commercial banks. Although this type of debt is considered less inflationary as compared to debt to central bank yet the perception is that it crowds out private investment. However, in countries like Pakistan where banking system is less competitive, sectoral alloction of credit is practised by monetary authorities and in which people have a lot of black money [Shabsigh (1995)], it is difficult to believe that investment will be crowded as a result of public borrowing from commercial banks. The crowding out hypothesis in the context of Pakistan is further denied if we compare credit plans of several years in Pakistan and end-year actual performances of monetary sector. The factual position is that the private sector always gets its full share from overall credit despite excessive borrowing by the government. Thus one can safely conclude, at least for Pakistan, that public debt issued to commercial banks creates no problem of crowding out private investment. Hyder (2002) attempted to test the crowding out hypothesis for Pakistan using vector error-correction farmework using data for 1964-2001. His study found the absence of crowding out phenomena in Pakistan.
Third source of government debt is domestic non-bank private sector. Government borrowing from non-bank private sector has no effect on money supply and hence no implications for interest rates and inflation from supply side. However, according to portifolio-balance model of demand for money, the debt held by people does exert an upward pressure on interest rates. According to this model asset-holders distribute their demand for financial assets across the available menu of assets, optimising a risk-return trade-off. Money enters the portfolio-balance problem as a riskless asset. When debt holdings of people increase they demand more money to offset the potential risk attached to these debts . With unchanged money supply, interest rates tend to rise due to excess demand for money (Dornbusch, 1975). Thus issuing debt to people has a fear of crowding out due to pressures on interest rates. This is why the theory of public debt advocates a mix strategy of debt finance which ensures a moderate increase in money supply through borrowing from banking sector while avoiding excessive bank borrowing and generating funds from non-bank sector.
Another important source is the foreign or external source. Borrowing from abroad has become a major feature particularly of the developing countries [Gray and Woo, 2000]. Foreign borrowing allows a country to invest and consume beyond the limits of current domestic production and, in effect, finance capital formation not only by mobilizing domestic savings but also by tapping resources from capital
surplus countries. Foreign borrowing can lead to more rapid growth. However, debt accumulation and growth has non-linear relationship. Up to cretain level the impact is positive and beyond a theshold the relationship is negative. Foreign resource inflows increased the resource availability and as a result it contributed to economic growth in South Asia (Siddiqui and Malik, 2002). However, if a country borrows abroad, it must manage debt prudently. Exessive foreign borrowing and its improper use generate severe debt service obligations and country accumulates more and more debt that constrains future economic policy and, so, growth, as is the case with Pakistan (Kemal A.R. 2002).
Other important issues related to public debt are whether public debt really is a burden and why sometimes it becomes unmanageable and unsustainable. Public debt is generally considered a matter of serious concern. Often an argument is given that each individual of a certain country bears so much debt burden . Is this perception correct and is the fear genuine? In a fairly crude sense the answer is not! The reason is that liabilities created by the government have their counterpart in the form of financial assets (treasury bills, government bonds etc.) held by people. Thus taking government and people of a country combined as a nation, the overall liabilities of the nation are equal to its assets; so net burden on the nation is zero (keeping aside the debt held by foreigners). So public debt is not a matter of serious concern as long as the nationals of the same country hold its major part. Real burden is external debt since in this case asset holders are foreigners and the country as a whole is net debtor.
Debt is not a matter of concern as long as it is manageable and sustainable. Debt management is the process by which the government acquires and utilizes the debt efficiently and effectively. Debt is manageable as long as the cost of acquiring debt is reasonably low and the debt thus obtained is used efficiently in such a way that it helps growth in nation resources least in the long run. Debt is used efficiently if the ratios of debt service to total revenue and external debt service to exports fall or remain constant. The underlying assumption is that projects for which borrowed money is used will generate sufficient output and exports for debt repayment. In past, Pakistan’s debt management strategy generally focused on finding new and cheap sources of finance and ignores the proper use of borrowed funds. Kemal (2002) discussed the major four reasons of the improper use of borrowed money in Pakistan, viz the donor’s agenda, corruption, capital flight, and the adverse impact of loans on domestic savings. This is why the debt management has become a much serious problem in our country. There is a need for early resolution of debt problem in Pakistan because it could otherwise slowdown the declining growth rate further, and adversely impact the overall macroeconomic situation in the country (GOP, 2001).
In Pakistan, per capita debt is Rs. 28,784 as on 30-06-2001 as compared to per capita GDP of Rs. 24,965 only during FY 01.
2
Sustainability of debt is a situation where debt-to-income ratio declines or, at least, remains constant over years. There is a formal model in literature on public debt to determine the factors contributing in its unsustainability. The model is based on macroeconomic theory and some imprtant research studies made by professors J. Tobin, L. Spaventa and R. Dornbusch (see Botousharov, 1993 for detailed exposition of the model). There are two debt determinants which influence the debt-to income ratio; (i) primary budget deficit , and (ii) the difference between the real interest rate and real GDP growth. If there is a high primary deficit (as a percent of nominal GDP) then debt-to-income ratio tends to fall. Thus the stability in debt -to -income ratio or equivalently sustainability of public debt depends on the relative strength of the above opposite forces. It is usually concluded that if primary defict is zero and the economy is growing reasonably then public debt is no longer unsustainable. The underlying assumption is that if the real output grows, the resource generating capacity of the economy would also grow with the same proportion. Thus, if the real interest rates are low and the rate of resource generation is high then debt would no longer accumulate unsustainably. It was exactly the situation in USA during 1950s and 60s when interest rates were practically zero, output grew steadily and primary budget deficit was zero (even there was primary budget surplus during certain years) and debt grew less rapidly than nominal income. By contrast, in 1980s, the opposite was the case. Real interest rates were very high, growth was sluggish and non-interest budget was in deficit. As a result debt-to-income ratio was rising. In a period of slow growth and high real interest rates, deficit translates into a rapidly rising debt-income ratio (Dornbusch, 1999).
3. Objectives and Functions of Debt Management, and Location of Functions.
3.1 Objectives
A clearly defined debt management objective (or objectives) is an important element of the debt management framework since: (1) it facilitates the design of the debt management program in a manner consistent with the attainment of the debt management goals while avoiding conflicting objectives; (2) it enables the measurement of performance of the debt management funcion; and (3) it harmonizes debt management policies with other policies, particularly monetary policy.
The basic objective is to cover the government borrowing needs. The other objective may be to raise the funds required by the government at the minimum long-term cost, while at the same time keeping variability in the cost at reasonable level. However, in economies in transition cost minimization may lead
Primary budget deficit is equal to overall budget deficit minus interest payments.
3
to excessive borrowing from central bank (fuelling inflation) or from ‘captive markets’ at below market interest rates (retarding the development of secondary markets). In such a case the aim may be to support the monetary policy. Coordinating the debt activities with the monetary policies of central bank may strengthen the monetary management. It may aim at improving the functioning of the financial markets, particularly the treasury bills and the bond market, through interest liberalizations and integration of various market segments. Development of the domestic capital market may be another goal of the public debt management. The purpose may be to finance the government’s long term requirements and to finance the overall requirements by keeping a balance in short and long-term liabilities. Another objective may be to avoid market disruption and keep the market smoothly function in order to provide the government with continuous funding at the competitive cost. Debt manager may also target foreign investors as well as to encourage domestic savers to make investable funds available for financing purposes. Another objective may be to diversify borrowing and broadening the debt distribution. The purpose may be to diversify (with respect to currency and/or market) debt instruments in order to facilitate debt absorption and tail instruments to market requirements. The private market may be used to broaden the funding. Promoting balanced maturity structure may be an objective in order to manage the size and frequency of the refunding. Lastly, maintaining the creditworthiness may be an aim of the debt management.
Deciding about the list of objectives and establishing an appropriate hierarcy of objectives is an important task. The hierarchy of objectives depends, in an important way, on the stage of market and institutional development and will evolve over time with the financial and government securities markets and the achievement of economic stabilization goals.
Countries with less developed government securities and financial markets or a history of high inflation attach primary importance to monetary policy and market development considerations. Pakistan has support of monetary policy as primary debt management objective, then comes minimizing the borrowing cost, encouragement of savings, diversification of borrowing and broadening the debt distribution, and so on [Dattels, P. and Carracedo, M.F.(1997)].
3.2 Functions
Debt management is the process by which the government acquires and utilises the debt efficiently and effectively for budgetary purposes keeping its objectives of debt management. It refers to the technical and institutional aspects of organizing the public debt. The technical aspects focus on the need to determine the level of financing requirements and to ensure that terms and conditions of those borrowings are commensurate with the future debt service capacity of the country. The
institutional aspects deal with the organizational, legislative, accounting and monitoring of new borrowings as well as the total stock of debt. Following are the fundamental functions of debt management.
3.2.1 Accounting Function
For managing the debt one should know the debt. For example, information on external debt and debt service payments is essential for the day to day management of foreign exchange transactions, as well as managing debt and for planning foreign borrowing strategies. At the most detailed level, such information enables central authorities to ensure that individual creditors are paid smoothly; at more aggregated levels, debt data are needed for assessing current foreign exchange needs, projecting future debt service obligations, evaluationg the consequences of further foreign borrowing, and the management of external risk. Accounting provides the firm basis for best knowing, in details, the extent of debt and the payments of debt service (interest and redemption).
Major requirement to discharge this function is microcomputer-based systems for recording and reporting debt and for triggering debt service payments.
3.2.2 Forecasting Function
The government’s borrowing requirements are a function of the flows of its revenue and expenditure over time. Such flows should be forecasted on weekly and monthly basis, so that cost-effective arrangements can be put in place for the financing of cash deficits and for the investment of temporary surpluses, if any. Forecasts depend heavily on projections based on the accounting system but must often supplement them with analytical work on specific issues, surveys among government agencies, and so forth. In the latter case, the quality of the information received is clearly influenced by the ability of the authorities to engage in a constructive dialogue with the suppliers of data and forecasts. Calculating debt service payments when a large share of the debt stock has been raised in the form of short-term borrowings, or at floating rates of interest, futher complicates forecasting. Thus, government debt manager must have a satisfactory capacity to analyse and project trends in the global and national economy and in the financial markets.
3.2.3 Policy and Planning Function
48
As in the case of Pakistan around 85% of our total exports is in US$; and if one looks at the exchange rate composition of our external debt, around 20% of it is in yen.
4
try to tap all pockets of savings in the economy more or less at the same time; on the other hand, if they are small, he or she can afford to take a longer view and to develop and use one or two market segments at a time. Which subsector will have priority depends as much on tradition and national institutions as on macroeconomic and financial conditions. Clearly the availability of funds and the market conditions will be important for the choice of sector and the design of borrowing instruments. Thus, familiarity with the investment habits and preferences of each category of savers, and with the market for the kind of instruments that might attract them becomes a significant element in policy formulation.
3.2.4 Risks Management Function
One of the debt management functions is to cover the risks created by exchange rate and interest rate swings. Sometimes a country is exposed to the balance of payments shocks arising from unfavourable changes in the relative prices of exports and imports. Suppose that the country’s exports earnings are in US dollars and its foreign debts are repayable in Japanese yen . Deterioration in the exchange rate of the dollar vis-a-vis the yen will add to the debt- servicing obligation of the borrowing country. A similar problem can be caused by variable interest rate loans.
3.2.5 Primary Issuance Function
Strictly speaking, this function should be limited to the decisions and activities of the government debt manager leading up to the time that a loan or bond issue is ready for launching. In some countries, the task of actually selling the issue into the market is undertaken not by the treasury (the issuer) but by the central bank (as in Pakistan), and the objectives may be as much those of monetary management as of debt management for the government. However, in other countries, the responsibility for palcing the issue in the market remains with the issuer the treasury or separate debt office and the issuing function must then be seen as a continuum, that is , it covers the whole relationship between the state borrower and the primary market for government paper. Characteristics of the primary issuance function vary from country to country partly because of admiistrative structures and national traditions but more significantly because of differences in government objectives and policies, with regard to the markets that the government wants to tap, the variety of instruments used, selling teachniques (such as auctions), and so forth.
A widespread practice among some countries is that of appoiniting primary dealers that participate regularly in a significant way in auctions of newly issued government securities. The government thus creates a public or private sector network to
prerform the issuing function. The use of primary dealers has been the established practice for many years in countries such as the United Kingdom and the United States.
3.2.6 Secondary Market Function
The secondary market function is normally performed by players other than government debt manager but can be of vital importance to the success of their operations, particularly if government borrowing needs are high and expected to remain so and if the securities markets are dominated by professional investors. For them the secondary market will guarantee the liquidty of their investments set prices on a day-to- day basis. Naturally, they will be more willing to take up new ussues if they know that they can liquidate some of their holdings at any time for cash and at reasonable prices.
But a secondary market may not spring up by itself and experience of various countries shows that it typically requires both active intervention from the authorities and the reduction of various regulatory obstacles like:
A controlled or administered structure of interest rates through which the effective yields on government bonds are kept below the levels of the credit market;
Protection by the commercial banks of their privileged position as lenders to the private sector;
Legal restricions on the issuance of corporate debt by enterprises;
High minimum denominations of new issues, which bar individual investors from participating; and
The lack of securities infrastructure in the form of a competitive auction system, rating agencies, and clearing and settlement systems.
50 3.2.7 Clearing and Settlement Function
In small and undeveloped secondary markets, clearing and settlement (i.e., the transfer of ownership of securities and the transfer of sales proceeds) are normally undertaken by the banks (each bank making such transfers between the accounts of its own customers, and banks also making transfers among themselves), or by the central bank in case of transactions involving government securities held by different banks. However, this structure is not likely to foster a high turnover market, and other solutions have therefore come to dominate more developed markets. While all of them feature a central despository centre, there is a rather rich variety of models to consider. In some countries, the central bank has agreed to enlarge its role as agent for the government debt manager by operating a computerized debt registry and payments scheme for the secondary market. In other countries the government as market participant has joined hands with the banks and the dealers to create a separate securities depository centre, which effects legally binding transfers of ownership and which may or may not also make payment transfers through a clearing process. To guard investors against counterparty risk (i.e. the failure of a party to a securities transaction to fulfil his obligations,) the centre may have the right and the resources to step in and meet the failing party’s obligation. Through sophisticated legal and technical means, countries strive to achieve a fail-safe application of the principle of “delivery against payment,” this being a prerequistite for the success of transactions involving a chain of separate deals.
3.2.8 The Information Function
The importance of timely and accurate information from government debt manager to the market is highly important. Equally important is that the debt managers receive relevant information from the market in order to tailor their issuing activities to the goals set by policymakers. Increasingly, the debt manager is also a participant in electronic information systems that have been set up in most of the countries by the electronic information services, by banks and dealers, or occasionally by the authorities to facilitate the functioning of the primary and secondary markets. Thus, in a number of countries, traders are concerned to other traders, to issuers, and to investors through screen - based information and market - making systems that allow quick execution of sell and buy orders (and can be used to call for bids at a primary auction). The advent of fibre-optic cables and other technical advances are likely to allow a very rapid growth of such information systems, facilitating the role of debt managers but also making demands on their time.
3.2.9 Supervisory and Coordinating Function
central role in market surveillance. Different models can be followed to implement this function: some countries have separate agencies for the supervision of banks and of capital markets, reporting to parliament through the ministry of finance. In other cases, the ministry has delegated certain tasks and powers to the central bank, to the stock exchange, or to self-regulatory organizations. Recent experience has taught many countries the lesson that the supervisory function requires forethougt and vigilance, which can only be achieved with staff resources in sufficient numbers and of the right quality. There is a need also to coordinate the debt management functions.
3.3 Location of the Functions
Public debt management comprises a number of separate but related functions. Where are these debt management functions located? Because the rationale for borrowing is to finance the budget, the legal authority and responsibility to borrow is normally given to the institution that formulates the budget and is accountable to the parliament. Generally, this is the ministry of finance establishing the link between “budget making” and “budget financing”. Thus the principal debt management authority, the ministry of finance, has the responsibility for managing the public debt. However, the tasks and functions of debt management may be delegated by the ministry of finance to other institutions or to specialized departments or agencies of the ministry. Three possible institutional arrangements for the general conduct of debt management are:
The Ministry of Finance
The ministry of finance is responsible for the tactical and strategic policy functions as well as many other debt management functions (e.g.,in Argentina, Japan, and the United States). Certain divisions within the ministry usually undertake debt management functions. Alternatively, a treasury directorate may be established within the ministry of finance, centralizing the management of financial resources and liabilities of the governement and consolidating fiscal and debt management functions (Brazil, France, and Spain fall within this arrangement). Broadly speaking, in these arrangements, the central bank is responsible for only the more technical aspects of debt management, such as selling, banking, or settlement arrangements.
The Central Bank
policy and operational discretion to the central bank in debt management (as compared with the above arrangement) as is apporpriate when debt management is integrated with monetary operations or when the central bank is responsible for market development and functioning (e.g., debt program implementation is carried out by the central bank in Italy and in the United Kingdom). In Pakistan State Bank is responsible for the management of government debt under sub-section 13(e) of section 17 of the SBP Act, 1956.
A Special Autonomous Agency under Governmental Supervision (the Debt Office.)
The establishment of a separate debt management office dealing with many debt management functions is a thrid type of institutional arrangement (e.g., in Ireland, New Zealand, and Sweden). This arrangment provides for greater institutional separation between fiscal, monetary, and debt management policies, though they generally operate within well- specified policies established by the ministry of finance. These offices are a fairly recent phonomenon, dating from the late 1980s, with the exception of Sweden, where the debt office was created in 1789 to borrow on behalf of the Kingdom of Sweden and manage the state debt. Parliament was responsible for the debt office until July1, 1989, at which time it was transferred to the government. It is now an independent government agency subordinate to the ministry of finance. It is the sole institution that may borrow on behalf of the Kingdom of Sweden and is responsible for debt management.
Other debt management agents may be designated (or instituted) to support primary and secondary markets or both. For example, primary dealer groups are sometimes formed with specific obligations to facilitate the development, organization, and liquidity of efficient wholesale markets for government securities(e.g., in France, Mexico, Pakistan, Spain, Sweden, the United Kingdom, and the United States). In the case of retail instruments that are sold to the general public, separate agencies are sometimes used to sell and service these specialized instruments for example, the Central Directorate of National Savings Schemes in Pakistan; the United Kingdom uses the post offices as a distribution system for retail debt instruments. A securities commisson may regulate and supervise government securites markets. The clearing and settlement functions may be suppported by a central depository organization, either publicly or privately owned. Finally, special consultation groups are sometimes formed to assist in improving the design of debt management programs and to encourage the transparency of operations.
The scope of institutions and operating arrangements differ depending on country circumstances, the stage of market development, and efficiency considerations. Debt management functions under consideration can be passed through the criteria listed below, which serve as a guide for locating debt management functions. For
each country, depending on the stage of market development and other circumstances, different institutional answers may present themselves for the appropriate execution and coordination of debt management functions.
What is the objective of the debt management function? This guides the locating of each of debt management function.
Can accountability be established for the performance of the debt management function by the institution that is performing the function? This is an important tool for measuring the attainment of the objective.
Are there overall efficiencies - economies of scale, comparative advantage, of information externalities - to be gained by an institution performing the function?
Are public confidence and transparency enhanced by locating the debt management function within a particular institution?
4. Public Debt in Pakistan
4.1 Structure of Public Debt
In Pakistan outstanding public debt has exceeded our GDP and thus income per capita is lower than per citizen indebtedness (See footnote 2). This accumulated public debt is the result of structural weaknesses in the domestic economy and external account. Debt in Pakistan is raised through a number of ways. Around 42.7% of the present stock of total debt is domestic debt [Table-1(b)]. Excessive government expenditures, stagnant tax revenuse, high returns on government securities and inappropriate sequencing of financial reforms, led to bludgeoning domestic debt profile. In domestic market there are a number of instruments available to the government through which it mobilises funds for financing budget deficit. Different instruments of debt have different terms and conditions in the form of availability, costs and maturity periods. About 55.5% of the total debt is obtained from external sources. Remaining 1.8% is the explicit libilities . Large current account deficits, stagnat export receipts, and declining workers remittances, effectively forced Pakistan into an unsustainable situation. It appears that external financing of domestic budget
53 5
6
There are some definitional issues with respect to Public Debt in Pakistan. Consistent series as per new definitions by SBP is not available prior to 1998. However for the purpose of detailed comparison data prior to 2000 is taken from SBP Annual Reports for the years 1999(i.e., FY-99) and earlier. Data for the year 1998 and onward is taken from the latest SBP Annual Report (for the year 2001). One may feel overlapping in the data presented but it also highlights the differences caused due to definitional changes (For further detail one may consult SBP Annual Report for the year 2001).
As per SBP AR (2000 -2001) total debt comprises DD, ED and explicit liabilities (which includes Special US $ Bonds, FEBCs, FCBCs, and DBCs,’ of which special US $ Bond is a foreign liability, while FEBCs, FCBCs, and DBCs are also foreign liabilities payable in Rupees.
5
deficit is cheaper than the domestic financing. However, under certain circumstances external financing is significantly more expensive than the domestic financing [Gray and Woo, 2000].
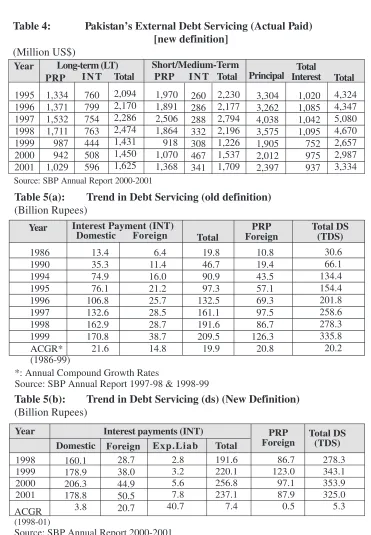
The structure and composition of public debt in pakistan is given in Tables 1 and 2 respectively. Number of changes has occurred in the structure of debt over years. In 1986, the share of external debt in the total outstanding debt was 48.2% and now in 2001 the share of external debt and liabilities is 57% of the total. However, annual compund growth rate of total debt declined slightly from 16.8%[Table 1(a)] during 1986-99 to 15.1% during 1994-99 and to 14.4% during 1998-2001.
Presently domestic debt is 42.7% of the total debt. It is classified into three categories: permanent debt, floating debt and unfunded debt. During the last 15 years unfunded debt has shown highest growth as compared to other components (Table-2). The share of unfunded debt in total domestic debt increased from 26.7% in 1986 to 40.4% in 2001. The share of permanent debt declined during the previous fifteen years. It declined from about one third of the total domestic debt in 1986 to one sixth of it in 2001. Though the share of floating debt decreased from 44% in 1986 to 36.7% in 1997, it again rose to almost same level at 43.2% in 2001. Floating debt is used to meet mismatches between federal government receipts/payments and forms the basis of central bank’s monetary policy. Earlier these loans were available to the government at rates considerably lower than the market interest rates. But after the introduction of financial liberalisation which included, among others, the rationalisation of interest rates and promulgation of auction system, the cost of floating debt increased considerably.
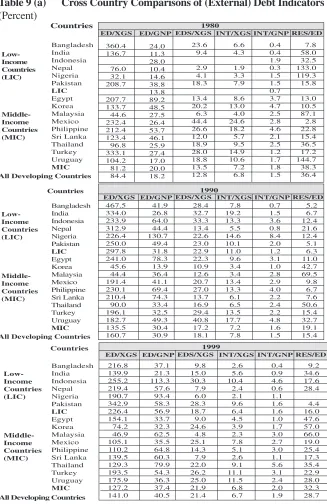
There has been a shift from the long-term external debt to short or medium term debt during 1990s and it increased share of high-cost loans in the external loan portfolio of the government. The expenditure on servicing of external debt increased sharply from less than one billion dollar in 1980 to around two billion dollar in 1990 . It surged to more than five billion dollar in 1997; and decreased to U.S$ 3334 million in 2001 [Tables 4), but this decrease is largely due to the rescheduling of debt.
Overall debt servicing increased with a compound growth rate of 20.2% during 1986-99. Interest payments on domestic and foreign debt grew by 21.6% and 14.8% respectively [Table 5 (a) ]. However, there has been a slower growth in debt servicing during 1998-2001 just beacuse of rescheduling of debt [Table 5 (b)].
54 7
8
9
10
The term’unfunded debt’ seems superfluous, but used traditionally.
There is a significant impact on outstanding amount of floating debt, and hence in the overall domestic debt,, due to recent restructuring agreement with Paris Club
(for details see SBP Second Quarterly Report for the year 2001-2002).
Ea rlier short and medium - term loans were used to combine. Now , as per new format (introduced in the SBP AR (2000-2001), long and medium-term loans are combined together to depict actual picture of short-term loans separately. Since we are talking of overall external debt servicing, this issue does not affect our analysis. In 1980 total debt servicing paid was $869 million which in 1990 rose to S1,902 million (See World Bank, 2001a).
7 8
9
Debt servicing claimed a share of 50% in total budgetary resources in 2001 while its share in mid eighties was around 21 per cent [Table6(a) & 6(b)]. It indicates that high expenditure on debt servicing is pre-empting scarce public resources and suffocating public sector development efforts.
4.2 Indicators of Debt Burden
From the above analysis it is clear that Pakistan is experiencing a high growth in overall public debt with its composition changing towards high cost debt. Due to accumulation of high cost debt, ist servicing has increased sharply with a mounting pressure on budgetary resources. The debt has become a burden on the economy. There are various measures of debt burden used in literature. Some of them are reported in Table 6(a) & 6(b) in the context of Pakistan. Analysts attach different degrees of importance to each of these indicators, none of which alone provides an accurate prediction of a country’s capacity to meet its debt service obligations.
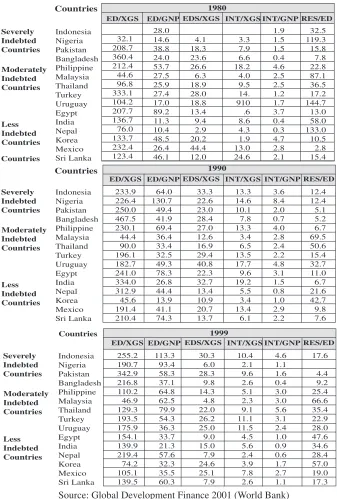
The ratio of total debt outstanding to GDP is the basic indicator of the level of indebtedness of a country. It illustrates the burden of debt placed on the productive capacity of the economy. In Pakistan this ratio was slightly below 100% in 1998 and it surpassed this level in 1999 [Table 6(b)]. A cross-country comparison (Table 8) shows that it is a high ratio compared with other developing countries. Our debt to GDP ratio (at 106.7% in 1999) is more than double of the same for a sample of 15 developing countries (at 43.4% in 1999). Ratios of external debt to GDP and export are other indicators widely used by international investors while making judgements about a country’s creditworthiness. In Pakistan, external debt to GDP ratio increased from 38.4% in 1990 to 64% in 2001 [Table 6(a) & 6(b)]. External debt to export ratio also increased during the same period, though it showed some decline during the last few years. If we make a cross- country comparison, both these indicator are higher than the respective averages of the low-income countries. [Table 9(a)]. Comparison of these ratios and some other ratios is also made among countries in the sample grouped on the basis of indebtedness [Table 9(b)]. Other indicator used for similar purpose is the ratio of international reserves to external debt. International reseves act as a cushion against fluctuations in foreign exechange earnings. A country with high ratio of international reserves to external debt would be in a better position to service its debt. The rule of thumb for this ratio is a reserve to debt ratio above 18% is satisfactory. In Pakistan this ratio is not satifactory though it improved significantly to 6.1 % in 2001 from 4.5% previous year [Table 6(b)].12
11
11The classification is based on World Bank estimates of per capita GNI during 1999. Countries for
which estimates of per capita GNI are US$ 755 or less are classified as Low Income Countries, those for which estimates of per capita GNI are in the range US$ 756-2,995 are classified as Lower Middle Income countries those for which estimates of per capita GNI are in the range US$ 2996-9,265 are classified as Upper Middle Income Countries,and those for which estimates of per capita GNI are US$9,265 or more are classified as High Income Countries (World Bank, 2001b).
The reserve to debt ratio has jumped to 9.3 after unprecedented increase in the foreign exchange reserves due significant behavioural shifts in the foreign exchange market that came in the aftermath
Using a rule of thumb World Bank classifies countries as serverely, moderately and less indebted countries. According to the World Bank classification, Pakistan did not fall in the category of severely indebted countries on the basis of 1998 data, though it was on the sharp edge. It falls in this category in 1999. Fifteen comparable countries in the sample are grouped on the basis of their indebtedness in the Table 10(a) &10(b). Most interesting feature of these tables is that in 1998 both Pakistan and India were moderately indebted countries butin 1999 Pakistan became severely indebted country whereas india improved to be classified as less indebted country.As also noted by Siddiqui and Siddiqui (2002), Pakistan is the only country in South Asia classified as severely indebted country by the World Bank (2001). Our ratio of net present value of EDS to XGS increased from 220% in 1998 to 226% in 1999. According to latest IMF country report, on Pakistan, it further increased to 250% in 2001.
We have discussed above that if real interest rate is below the GDP growth rate, with a zero primary dificit, further debt financing does not contribute to make the public debt unsustainable i.e., the government can continue debt financing without a resulting rise in debt to GDP ratio. In Pakistan, primary budget deficit remained generally greater than zero, however, the primary surplus is observed during the last three years in a row. The real GDP growth remained higher than real interest rate during the last decade except in 2000[Table 7]. The period-average growth inreal GDP is 3.7 while period-average real interest rate is - 2.0 for 1994-2001. The difference between the two is favourable except for the year 2000 when the economy grew slowly than the real interest rate. However, in spite of lower GDP growth rate in 1999 & 2001 the difference between the real interest rate and GDP growth rate is positive. It is Just because of rescheduling, and hence it is not a true indicator of whether debt financing is contributing toward debt usustainability or not . In such a situation, only the trend in debt-to-income ratio tells the true story regarding the sustainability of public debt, which in case of Pakistan is rising.
Pakistan has needed fairly regular access to the IMF during the last two decades. In the last few years, the maintenance of a program with the IMF has been a condition for obtaining debt relief from the Paris Club. Recently we have obtained $1.3 billion PRGF from IMF for the next three years, which has helped in getting further debt relief from the Paris Club (recent restructuring). The country needs to clearly define
13
World Bank’s Global Development Finance (GDF) classifies indebted countries on the basis of two ratios: the ratio of the present value of total (external) debt service to GNP[PV(EDS)/GNP] and the ratio of the present value of total (external) debt service to exports of goods & services (PV(EDS)/XGS]. These ratios cast a country’s indebtedness in terms of two important aspects of its potential capacity to service the debt: XGS (because they provide foreign exchange to service debt) and GNP( because it is the broadest measure of income generation in an economy). A country is classified as severely indebted if [PV(EDS) /XGS]>220% or [PV (EDS)/GNP]>80%,and is classified as moderately indebted if 132%<[PV(EDS)/XGS]<220% or 48%<[PV(EDS)/GNP]<80%, and is classified as less indebted if [PV(EDS)/XGS]<132 % or [PV (EDS)/GNP]< 48%.
and set the goal of an exit strategy from the IMF. However, our debt managers believe that this programme and the subsequent restructuring will eliminate our future needs of recourse to IMF assistance. Yes, it can. As using the overall history of debt rescheduling of Pakistan Siddiqui and Siddiqui (2002) have found that after each rescheduling of debt. investment rate increased indicating that current exercise may help us to promote investment and hence growth. But to ensure this improvement in our debt management process is a must. It was our inability to service our external debt that led to two consecutive reschedulings by Paris Club members and one from the quasi London Club during 1998-99 to 2000-2001. The Euro Bond of the maturity over 1999 to February 2000 Period was rescheduled through a voluntary exchange with a single bond of extended maturity. The huge rollovers are in addition to the rescheduling exercises. The recent restructuring is for a longer period and on softer terms [for details of rescheduling/ restructuring see Table 11, and for terms of Paris Club rescheduling see Box 1 of the Annexure]. It clearly shows that we have been unable to build our repaying capacity. As indicated by the trend in debt to GDP ratio our public debt is no loger sustainable and if one look on accrual basis will decide that we are in debt trap. However, as mentioned above, with current restructuring there is a hope for arrest in the ratio of debt to GDP if we improve our debt management process.
5. Conclusion
This paper examined the issue of managing public debt and analyses the present situation of public debt in Pakistan. When the government resorts to borrowing instead of introducing additional tax measures, to finance the budget deficit, it creates liability on itself known as public debt. Public debt accumulates over time if deficit in the budget presists for a long period of time. Growing public debt is a global phenomenon. Contemporary economic wisdom does not consider public debt a major problem per se; rather problem is the mismanagement and unsustainability of the debt.
58 develop domestic capital market, avoid market disruption, attract foreign investors, encourage savings of the public, diversify borrowing and broaden debt distribution, promote balanced maturity structure, and maintain creditworthiness. The list and the hierarchy of objectives depends on country’s situation. To achieve its set objectives, the debt manager should perform some fundamental functions like: accounting, forecasting, policy and planning, risks management, primary issuance, secondary market, clearing and settlement, information, and supervising and coordination function.
References:
Arby, M.F. (1997), “Major Issues and Remedies with regard to Public Debt in Pakistan” Journal of the Institute of Bankers, Pakistan, (June Issue).
Barro, Robert (1974), Are government bonds net wealth?, Journal of Political Economy, Dec. 1974.
Barro, Robert (1989), The Ricardian Approach to budget deficits, Economic Perspectives, Spring, 1989
Botousharov, P. (1993), Sustainability of Bulgaria’s Domestic Debt, Bank Review of Bulgarian National Bank, No. 3/1993
Chiliah, Raja (1991), The growth of Indian public debt; Dimensions of the problem and corrective measures, IMF Working Paper WP/91/72 July 1991
Dattels, P. and Carracedo, M.F. (1997), “Survey of Public Debt Management Framework in Selected Countries” an IMF Study.
Dornbusch, R ( 1975), A portfolio- balance model in the open economy, Journal of Monetary Economics, January 1975
Dornbusch, R (1999), Macroeonomics, 7th Edition, Mc Graw-Hill International Edition, Economics Series, 1999
GOP (2001), Summary of the Report of “Debt Reduction & Management Committee”.
Gray, Simon and Woo, David (2000), “Reconsidering External Financing of Domestic Budget Deficits: Debunking Some Received Wisdom”, IMF- PDP/00/8, International Monetary Fund, Washington D.C.
Haque, N & Montiel, P. (1988), Fiscal Policy and private saving behaviour in developing countries, IMF Staff Paper, 5, June 1988
Haque, N & Montiel, P. (1993), Fiscal Adjustments in Pakistan: Some simulation results, IMF Staff Papers, Vol. 40,, June, PP 471-80
IMF (1997), “Coordinating Public Debt and Monetary Management” Edited by V. Sundararajan, Peter Dattles, and Hans J. Blommestien
IMF (2000), Country Report ( for Pakistan) No. 01/178, October 2001 IMF, Government Finance Statistics, various issues
IMF, International Financial Statistics, various Issues
Jungsoo, L. (1983), The external debt servicing capacity of Asian developing countries, Asian Development Review, Vol. 1,No.2,1983
Kalderen, Lars (1997), “Debt Management Functions and their Location” in Coordinating Public Debt and Monetary Management, an IMF publication
Kemal, A. R. (2002),“ Debt Accumulation and Its Implications for Growth and Poverty,” Paper presented in th 17th Annual General Meeting of PSDE, held in Islamabad in January 2002.
Siddiqui, Rehana and Malik A. (2002), “Debt and Economic Growth in South Asia”. paper presented in the 17th Annual General Meeting of PSDE, held in Islamabad in January 2002.
Siddiqui, Rizwana and Siddiqui, Rehana (2002), “Determinants of Debt Rescheduling in Pakistan”, paper presented in the 17th Annual General Meeting of PSDE, held in Islamabad in January 2002.
Shabsigh, Ghiath (1995), “ The Underground Economy: Estimation, and Economic Implications- The Case of Pakistan” IMF Working Paper No. 95/101.
Spaventa, L. (1987) The growth of public debt: sustainability, fiscal rules and monetary rules, IMF Staff Papers, June 1987
State Bank of Pakistan (various issues) Annual Report, Karachi.
State Bank of Pakistan (2002),2nd Quarterly Report for 2001-2002, Karachi.
World Bank (1990),“Debt Management Systems”. World Bank Discussion Papers No. 108, Washington D.C.
World Bank(1994), “External Debt Management: An introduction” World Bank Technical Paper No. 245. Washington D.C.
World Bank (2001a), Global Development Finance for the year 2000 and 2001. Washington D.C.
Accronyms
ACGR Annual Compound Growth Rate CBD Central Bank Deposits
DBC Dollar Bearer Certificate
DD Domestic Debt
DDS Domestic Debt Servicing
ED External Debt
EDS External Debt Servicing
FCBC Foreign Currency Bearer Certificate
FD Foreign Debt
FEBC Foreign Exchange Bearer Certificate FEE Foreign Exchange Earning
GDF Global Development Finance GDP Gross Domestic Product GFS Government Finance Statistics GOP Government of Pakistan
HIC High Income Country
IMF International Monetary Fund
INT Interest
LIC Low Income Country
LT Long Term
MIC Middle Income Country NBP National Bank of Pakistan NSS National Savings Schemes
PRP Principal
PV Present Value
R Reserves
RES Reserves
SBP State Bank of Pakistan
ST Short Term
TAR Tax Revenue
TD Total Debt
TDS Total Debt Servicing
TE Total Expenditure
TR Total Revenue
X Exports
Annexure
Table 1(a): Structure of Public Debt in Pakistan (on the Basis of Old Definition)
(Billion Rupees) 200.8 378.3 702.0 805.4 916.1 1,049.6 1,159.5 1,362.4 Domestic Debt (DD) Growth Rate(%) DD ED TD
Share (%) DD ED
14.7 13.7 14.6 10.5 17.5 15.9 14.2 5.0 20.5 15.8 20.8 18.0 17.8 15.9 9.7 17.1 15.2 15.8 17.8 16.8 15.1 51.8 53.5 48.4 50.6 49.1 48.9 46.7 46.5 48.2 46.5 51.6 49.4 50.9 51.1 53.3 53.5 1986 1990 1994 1995 1996 1997 1998 1999 Year 186.8 328.9 749.4 787.1 948.1 1,097.7 1,326.0 1,565.0 External Debt (ED) 387.6 707.2 1,451.4 1,592.5 1,864.2 2,147.3 2,485.5 2,927.4 Total Debt (TD)
Annual Compound Growth Rate (1986-99) Annual Compund Growth Rate (1994-99) Source: SBP Annual Reports 1997-98 & 1998-99
Table 1(b): Structure of Public Debt in Pakistan (on the Basis of New Definition)
(Billion Rupees) 1998 1999 2000 2001 Year 1,176.2 1,375.9 1,559.9 1,708.5 1,483.1 1,695.9 1,788.4 2,223.8 Explicit Liabilities DD ED 12.6 63.6 67.8 71.0 Total Debt 2,671.9 3,135.4 3,416.1 4,003.3 Share (%) TD Growth Rate(%)
DD ED Ex.Liab. DD ED Ex.Liab.
17.0 13.4 9.5 13.3 14.3 5.5 24.3 14.5 404.8 6.6 4.7 77.9 17.3 9.0 17.2 14.4 44.0 43.9 45.7 42.7 55.5 54.1 52.4 55.5 0.5 2.0 2.0 1.8
Annual Compound Growth Rate (1998-2001) Source: SBP Annual Reports 2000-2001
Share in 1986 Share in 2001
[image:23.595.127.466.445.696.2]Annual Compound Growth Rate (1986-99) Annual Compound Growth Rate (1994-99) Source: SBP Annual Reports 1995-96 & 1998-99
Table 2(a): Composition of Domestic Debt in Pakistan (Old Definition) (Million Rupees) 1986 1990 1994 1995 1996 1997 1998 1999 58,200 102,800 267,633 293,568 294,705 296,283 289,707 319,440 87,300 145,000 257,637 294,233 361,298 433,833 473,850 561,590 52,900 130,600 176,710 210,819 252,892 319,483 395,988 481,414 198,400 378,400 701,980 798,620 908,895 1,049,599 1,159,545 1,362,444
Table 2(a): Composition of Domestic Debt in Pakistan (New Definition) (Million Rupees) 1998 1999 2000 2001 277,140 256,928 259,597 281,077 473850 561,590 647,428 737,776 425,244 557,389 652,922 689,679 1,176,234 1,375,907 1,559,947 1,708,532 -7.3 1.0 8.3 0.5
Permanent Floating Unfunded Permanent Floating Unfunded Growth Rate(%) 18.5 15.3 14.0 15.9 31.1 17.1 5.6 17.5 17.0 13.4 9.5 13.3 23.6 18.7 16.6 16.5 40.3 40.8 41.5 43.2 36.2 40.5 41.9 40.4 Annual Compound Growth Rate (1998-2001)
Source: SBP Annual Report 2000-2001
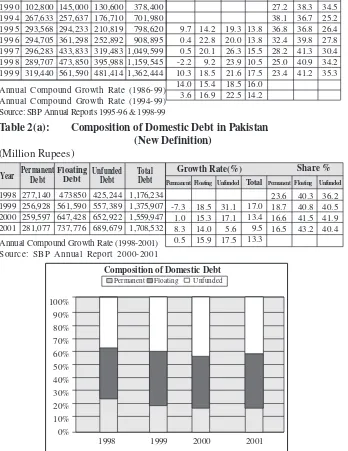
1998 1999 2000 2001
Composition of Domestic Debt
14.2 22.8 20.1 9.2 18.5 15.4 16.9 19.3 20.0 26.3 23.9 21.6 18.5 22.5 13.8 13.8 15.5 10.5 17.5 16.0 14.2 29.3 27.2 38.1 36.8 32.4 28.2 25.0 23.4 44.0 38.3 36.7 36.8 39.8 41.3 40.9 41.2 26.7 34.5 25.2 26.4 27.8 30.4 34.2 35.3 9.7 0.4 0.5 -2.2 10.3 14.0 3.6 Growth Rates(%) Permanent Debt Floating
Debt UnfundedDebt Total Debt
Permanent Debt
Floating
Debt UnfundedDebt Total Debt
Year
Year Share %
100% 90% 80% 70% 60% 50% 40% 30% 20% 10% 0% Share % Unfunded Floating Permanent Total
[image:24.595.117.465.253.704.2]Table 3(a): Pakistan’s External Debt (Dld Definition)
(Million US$)
Table 3(b): Pakistan’s External Debt & Liabilities (New Definition) (Million US$) 1970 1980 1990 1994 1995 1996 1997 1998 1999 Year 3,257 8,520 16,643 23,887 25,381 25,613 26,307 28,799 30,736 45 674 836 1,557 1,613 1,396 1,281 1,360 1,704 104 737 3,185 1,938 3,235 2,816 2,481 2,160 1,830 3,406 9,931 20,664 27,382 30,229 29,825 30,069 32,319 34,270 Long
Term Use of IMFCredit Short Term Total Debt LT 6.3 0.9 2.7 9.5 6.7 8.0 5.2 3.6 -13.5 -8.2 6.2 25.3 13.4 1.8 66.9 -13.0 -11.9 -12.9 -15.3 10.4 -1.1 95.6 85.8 80.5 87.2 84.0 85.9 87.5 89.1 89.7 10.4 -1.3 0.8 7.5 6.0 8.3 4.6 1.3 6.8 4.0 5.7 5.3 4.7 4.3 4.2 5.0 3.1 7.4 15.4 7.1 10.7 9.4 8.3 6.7 5.3
Growth Rates (%)
IMF ST Total LT IMF ST Share (%)
Annual Compound Growth Rate (1970-99) Annual Compound Growth Rate (1994-99)
Source: Global Development Finance 2001 (World Bank)
Annual Compound Growth Rate (1998-2001) Source: SBP Annual Report 2000-2001
1998 1999 2000 2001 29,663 29,921 31,470 31,782 1,415 1,825 1,550 1,529 450 700 700 700 552 418 561 675 32,080 32,864 34,281 34,686 0.9 5.2 1.0 2.3 29.0 -15.1 -1.4 2.6 55.6 0.0 0.0 15.9 -24.3 34.2 20.3 6.9 2.4 4.3 1.2 2.6 92.5 91.0 91.8 91.6 4.4 5.6 4.5 4.4 1.4 2.1 2.0 2.0 1.7 1.3 1.6 1.9 Year Medium & LT
Use of IMF
Credit CBD ShortTerm Total Debt
Growth Rates (%)
Total
M/LT IMF CBD ST M/LT IMF CBD ST
[image:25.595.124.466.223.406.2]Table 4: Pakistan’s External Debt Servicing (Actual Paid) [new definition]
(Million US$)
Source: SBP Annual Report 2000-2001
Table 5(a): Trend in Debt Servicing (old definition)
(Billion Rupees)
ACGR* (1986-99)
ACGR
(1998-01)
Source: SBP Annual Report 2000-2001 1995 1996 1997 1998 1999 2000 2001 Year 1,334 1,371 1,532 1,711 987 942 1,029 760 799 754 763 444 508 596 2,094 2,170 2,286 2,474 1,431 1,450 1,625
PRP I N T Total PRP I N T Total 1,970 1,891 2,506 1,864 918 1,070 1,368 260 286 288 332 308 467 341 2,230 2,177 2,794 2,196 1,226 1,537 1,709 Principal 3,304 3,262 4,038 3,575 1,905 2,012 2,397 Total Interest 1,020 1,085 1,042 1,095 752 975 937 Total 4,324 4,347 5,080 4,670 2,657 2,987 3,334 13.4 35.3 74.9 76.1 106.8 132.6 162.9 170.8 21.6 Domestic 6.4 11.4 16.0 21.2 25.7 28.5 28.7 38.7 14.8 Foreign 19.8 46.7 90.9 97.3 132.5 161.1 191.6 209.5 19.9 10.8 19.4 43.5 57.1 69.3 97.5 86.7 126.3 20.8 Total PRP Foreign Long-term (LT) Short/Medium-Term
1986 1990 1994 1995 1996 1997 1998 1999
Interest Payment (INT) Year
Table 5(b): Trend in Debt Servicing (ds) (New Definition)
(Billion Rupees) 28.7 38.0 44.9 50.5 20.7 160.1 178.9 206.3 178.8 3.8 1998 1999 2000 2001 Year Domestic Foreign
Interest payments (INT) Exp.Liab 2.8 3.2 5.6 7.8 40.7 Total 191.6 220.1 256.8 237.1 7.4 PRP Foreign 86.7 123.0 97.1 87.9 0.5 278.3 343.1 353.9 325.0 5.3 Total DS (TDS) 30.6 66.1 134.4 154.4 201.8 258.6 278.3 335.8 20.2 Total DS (TDS)
*: Annual Compound Growth Rates
[image:26.595.123.478.199.332.2] [image:26.595.125.479.575.674.2]Table 6(a): Indicators of Debt Burden (Old Definition) (Percent) 82.6 38.4 307.3 5.1 58.0 40.4 29.2 31.0 21.5 18.4 5.5 29.6 20.4 92.3 47.6 371.6 10.4 64.5 49.6 36.8 35.9 27.5 20.5 5.8 54.0 33.4 84.6 41.8 323.6 11.6 59.6 48.6 36.1 29.5 23.6 17.8 5.2 55.7 34.9 86.1 43.8 339.8 9.1 66.0 54.8 39.0 34.9 28.1 20.6 6.1 52.3 33.9 88.4 45.2 347.7 4.8 79.7 67.3 47.3 40.9 34.5 24.5 6.6 62.8 39.3 92.8 49.5 364.0 3.9 77.0 63.8 47.2 45.1 37.9 25.7 7.2 55.4 34.9 99.6 53.3 444.3 6.0 83.0 65.5 54.7 42.2 36.4 26.4 7.1 34.9 23.0
1990 1994 1995 1996 1997 1998 1999
75.3 36.3 393.4 8.5 51.4 33.5 21.0 22.5 14.9 11.2 3.8 35.7 15.7 1986 Indicators
TD to GDP Ratio (TD/GDP) ED to GDP Ratio (ED/GDP) ED to Exports Ratio (ED/X) Reserve (R) to ED Ratio (R/ED) TDS to Tax Rev. Ratio (TDS/TAR) TDS to Total Rev. Ratio TDS/TR) TDS to Total Exp. Ratio (TDS/TE) DDS to Tax Rev.Ratio ( DDS/TAR) DDS to Total Rev. Ratio (DDS/TR) DDS to Total Exp. Ratio (DDS/TE) INT to GDP Ratio (INT/GDP) EDS to X Ratio (EDS/X)
EDS to Fr.Ex.Er.Ratio (EDS/FEE)
Source: SBP Annual Report 1993-94,1997-98 & 1998-99
Table 6(b): Indicators of Debt Burden (New Definition)
(Percent) 115.3 64.0 426.3 6.1 68.9 57.0 49.5 37.9 31.3 23.6 6.8 37.4 23.3 2001 107.3 56.2 421.8 4.5 87.2 65.9 47.6 50.8 38.4 27.7 8.1 36.5 23.4 2000 106.7 57.7 481.5 5.6 87.8 73.2 53.0 44.2 38.2 27.6 7.5 35.3 23.6 1999 99.8 55.4 407.1 3.5 78.4 64.8 43.9 44.3 37.3 25.3 7.2 55.4 34.9 1998 Indicators
TD to GDP Ratio (TD/GDP) ED to GDP Ratio (ED/GDP) ED to Exports Ratio (ED/X) Reserve (R) to ED Ratio (R/ED) TDS to Tax Rev. Ratio (TDS/TAR) TDS to Total Rev. Ratio (TDS/TR) TDS to Total Exp. Ratio (TDS/TE) DDS to Tax Rev.Ratio (DDS/TAR) DDS to Total Rev. Ratio (DDS/TR) DDS to Total Exp. Ratio (DDS/TE) INT to GDP Ratio (INT/GDP) EDS to X Ratio (EDS/X)
Table 7: Determinants of Debt Sustainability
*: From 1998 and onwards as per definition of SBP Annual Report 2000-2001 (new definition)
Sources:
SBP Annual Reports (Various Issues) GOP Economic Survey( Various Issues) Government Finance Statistics (IMF),2000
Average (MIC)
Ave (All Above Countries)
Table 8: Cross country Comparisons of (Overall ) Debt to GDP Ratios
(Percent) Countries Low Income Countries (LIC) Average (LIC) Bangladesh India Indonesia Nepal Nigeria Pakistan Middle-Income Countries (MIC) Egypt Korea Malaysia Mexico Philippines Sri Lanka Thailand Turkey Uruguay (Primary Deficit)
Ave.1994 - 01
Year INT on DD INT on ED INT on TD GDP Deflator Real Interest Rate Real GDP Growth Primary Deficit/ GDP 1.8 0.2 -6.8 -8.1 -0.9 -5.8 -0.5 1.0 4.4 0.5 -2.0 6.6 4.6 4.5 5.3 4.6 1.3 4.3 3.1 3.9 2.6 3.7 2.1 -2.2 0.1 0.4 0.2 -0.2 0.5 -1.4 -1.6 -1.5 -0.4 1986 1990 1994 1995 1996 1997 1998 1999 2000 2001 6.7 9.3 10.7 9.4 11.7 12.6 13.6 13.0 13.2 10.5 11.8 3.4 3.5 2.1 2.7 2.7 2.6 2.1 2.3 2.7 2.5 2.5 5.1 6.6 6.3 6.1 7.1 7.5 7.2 7.0 7.5 5.9 6.8 3.3 6.4 13.1 14.2 8.0 13.3 7.7 6.0 3.1 5.4 8.9 4.8 4.4 11.3 13.4 5.5 7.1 4.8 2.1 -0.5 2.1 5.7
1 2 3 4 5 6 = 4 - 5 7 8 = 7 - 6 9 Difference 33.3 0.5 6.4 15.8 24.2 16.1 7.9 18.1 3.7 30.2 15.0 41.2 18.6 19.5 54.4 33.4 48.7 1.7 14.9 10.4 44.0 23.9 5.9 40.7 37.7 114.6 34.8 46.7 47.7 0.6 14.6 21.0 2.9 44.2 51.2 32.8 50.6 44.8 65.9 53.8 DD 4.0 34.9 7.6 44.2 16.6 14.3 4.3 18.0 17.2 10.1 9.1 9.3 34.2 4.6 8.0 4.6 11.4 12.7 14.1 44.0 16.9 78.4 21.1 22.4 8.9 29.4 30.9 5.1 60.5 22.4 27.3 41.6 12.7 14.6 7.4 23.9 23.9 2.9 20.9 24.0 24.0 55.0 4.3 15.7 24.2 21.4 31.1 7.9 81.4 46.4 51.3 96.6 17.0 30.3 31.6 45.3 55.1 31.3 11.0 0.0 49.1 13.9 27.6 22.2 21.8 6.1 14.6 0.0 45.9 7.6 22.3 16.1 21.6 37.4 25.6 0.0 95.1 21.5 50.0 38.3 43.4 1980
[image:28.595.130.472.467.709.2]68 1980 24.0 11.3 28.0 10.4 14.6 38.8 13.8 89.2 48.5 27.5 26.4 53.7 46.1 25.9 27.4 17.0 20.0 18.2 23.6 9.4 2.9 4.1 18.3 13.4 20.2 6.3 44.4 26.6 12.0 18.9 28.0 18.8 13.5 12.8 6.6 4.3 1.9 3.3 7.9 8.6 13.0 4.0 24.6 18.2 5.7 9.5 14.9 10.6 7.2 6.8 0.4 0.4 1.9 0.3 1.5 1.5 0.7 3.7 4.7 2.5 2.8 4.6 2.1 2.5 1.2 1.7 1.8 1.5 7.8 58.0 32.5 133.0 119.3 15.8 13.0 10.5 87.1 2.8 22.8 15.4 36.5 17.2 144.7 38.3 36.4 Low-Income Countries (LIC) Bangladesh India Indonesia Nepal Nigeria Pakistan LIC Egypt Korea Malaysia Mexico Philippine Sri Lanka Thailand Turkey Uruguay MIC 360.4 136.7 76.0 32.1 208.7 207.7 133.7 44.6 232.4 212.4 123.4 96.8 333.1 104.2 81.2 84.4
ED/XGS ED/GNP EDS/XGS INT/XGS INT/GNP RES/ED
Middle-Income Countries (MIC)
All Developing Countries
Countries Bangladesh India Indonesia Nepal Nigeria Pakistan LIC Egypt Korea Malaysia Mexico Philippine Sri Lanka Thailand Turkey Uruguay MIC 467.5 334.0 233.9 312.9 226.4 250.0 297.8 241.0 45.6 44.4 191.4 230.1 210.4 90.0 196.1 182.7 135.5 160.7 41.9 26.8 64.0 44.4 130.7 49.4 31.8 78.3 13.9 36.4 41.1 69.4 74.3 33.4 32.5 49.3 30.4 30.9 28.4 32.7 33.3 13.4 22.6 23.0 22.9 22.3 10.9 12.6 20.7 27.0 13.7 16.9 29.4 40.8 17.2 18.1 7.8 19.2 13.3 5.5 14.6 10.1 11.0 9.6 3.4 3.4 13.4 13.3 6.1 6.5 13.5 17.7 7.2 7.8 0.7 1.5 3.6 0.8 8.4 2.0 1.2 3.1 1.0 2.8 2.9 4.0 2.2 2.4 2.2 4.8 1.6 1.5 5.2 6.7 12.4 21.6 12.4 5.1 6.3 11.0 42.7 69.5 9.8 6.7 7.6 50.6 15.4 32.7 19.1 15.4 1990
ED/XGS ED/GNP EDS/XGS INT/XGS INT/GNP RES/ED
Low-Income Countries (LIC) Bangladesh India Indonesia Nepal Nigeria Pakistan LIC Egypt Korea Malaysia Mexico Philippine Sri Lanka Thailand Turkey Uruguay MIC Middle-Income Countries (MIC)
All Developing Countries
1999 216.8 139.9 255.2 219.4 190.7 342.9 226.4 154.1 74.2 46.9 105.1 110.2 139.5 129.3 193.5 175.9 127.2 141.0 37.1 21.3 113.3 57.6 93.4 58.3 56.9 33.7 32.3 62.5 35.5 64.8 60.3 79.9 54.3 36.3 37.4 40.5 9.8 15.0 30.3 7.9 6.0 28.3 18.7 9.0 24.6 4.8 25.1 14.3 7.9 22.0 26.2 25.0 21.9 21.4 2.6 5.6 10.4 2.4 2.1 9.6 6.4 4.5 3.9 2.3 7.8 5.1 2.6 9.1 11.1 11.5 6.8 6.7 0.4 0.9 4.6 0.6 1.1 1.6 1.6 1.0 1.7 3.0 2.7 3.0 1.1 5.6 3.1 2.4 2.0 1.9 9.2 34.6 17.6 28.4 4.4 16.0 47.6 57.0 66.0 19.0 25.4 17.3 35.4 22.9 28.0 32.3 28.7 ED/XGS ED/GNP EDS/XGS INT/XGS INT/GNP RES/ED
Countries Low-Income Countries (LIC) Middle-Income Countries (MIC)
All Developing Countries
Countries
Table 9 (a) Cross Country Comparisons of (External) Debt Indicators
(Percent)
[image:29.595.139.466.162.666.2]Table 9: (b) Cross Country Comparisons of (External) Debt Indicators (Percent) 1980 Severely Indebted Countries Indonesia Nigeria Pakistan Bangladesh Philippine Malaysia Thailand Turkey Uruguay Egypt India Nepal Korea Mexico Sri Lanka 32.1 208.7 360.4 212.4 44.6 96.8 333.1 104.2 207.7 136.7 76.0 133.7 232.4 123.4
ED/XGS ED/GNP EDS/XGS INT/XGS INT/GNP 28.0 14.6 38.8 24.0 53.7 27.5 25.9 27.4 17.0 89.2 11.3 10.4 48.5 26.4 46.1 Moderately Indebted Countries Less Indebted Countries 4.1 18.3 23.6 26.6 6.3 18.9 28.0 18.8 13.4 9.4 2.9 20.2 44.4 12.0 3.3 7.9 6.6 18.2 4.0 9.5 14. 910 .6 8.6 4.3 1.9 13.0 24.6 1.9 1.5 1.5 0.4 4.6 2.5 2.5 1.2 1.7 3.7 0.4 0.3 4.7 2.8 2.1 32.5 119.3 15.8 7.8 22.8 87.1 36.5 17.2 144.7 13.0 58.0 133.0 10.5 2.8 15.4 Countries Countries 1990 Severely Indebted Countries Indonesia Nigeria Pakistan Bangladesh Philippine Malaysia Thailand Turkey Uruguay Egypt India Nepal Korea Mexico Sri Lanka 233.9 226.4 250.0 467.5 230.1 44.4 90.0 196.1 182.7 241.0 334.0 312.9 45.6 191.4 210.4
ED/XGS ED/GNP EDS/XGS INT/XGS INT/GNP RES/ED
Moderately Indebted Countries Less Indebted Countries 3.6 8.4 2.0 0.7 4.0 2.8 2.4 2.2 4.8 3.1 1.5 0.8 1.0 2.9 2.2 12.4 12.4 5.1 5.2 6.7 69.5 50.6 15.4 32.7 11.0 6.7 21.6 42.7 9.8 7.6 64.0 130.7 49.4 41.9 69.4 36.4 33.4 32.5 49.3 78.3 26.8 44.4 13.9 41.1 74.3 33.3 22.6 23.0 28.4 27.0 12.6 16.9 29.4 40.8 22.3 32.7 13.4 10.9 20.7 13.7 13.3 14.6 10.1 7.8 13.3 3.4 6.5 13.5 17.7 9.6 19.2 5.5 3.4 13.4 6.1 Countries Countries 1999 Severely Indebted Countries Indonesia Nigeria Pakistan Bangladesh Philippine Malaysia Thailand Turkey Uruguay Egypt India Nepal Korea Mexico Sri Lanka 255.2 190.7 342.9 216.8 110.2 46.9 129.3 193.5 175.9 154.1 139.9 219.4 74.2 105.1 139.5
ED/XGS ED/GNP EDS/XGS INT/XGS INT/GNP RES/ED
Moderately Indebted Countries Less Indebted Countries 4.6 1.1 1.6 0.4 3.0 3.0 5.6 3.1 2.4 1.0 0.9 0.6 1.7 2.7 1.1 17.6 4.4 9.2 25.4 66.6 35.4 22.9 28.0 47.6 34.6 28.4 57.0 19.0 17.3 30.3 6.0 28.3 9.8 14.3 4.8 22.0 26.2 25.0 9.0 15.0 7.9 24.6 25.1 7.9 10.4 2.1 9.6 2.6 5.1 2.3 9.1 11.1 11.5 4.5 5.6 2.4 3.9 7.8 2.6 113.3 93.4 58.3 37.1 64.8 62.5 79.9 54.3 36.3 33.7 21.3 57.6 32.3 35.5 60.3 69 RES/ED
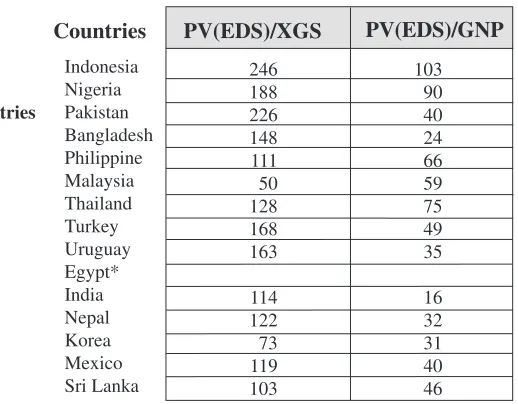
[image:30.595.128.465.186.685.2]70 Table 10: (b) Cross Country Comparisons -Indebtedness (1999)
(Percent)
Countries PV(EDS)/XGS
Indonesia Nigeria Pakistan Bangladesh Philippine Malaysia Thailand Turkey Uruguay Egypt* India Nepal Korea Mexico Sri Lanka
Severely
Indebted Countries
Moderately Indebted Countries
Less Indebted Countries
246 188 226 148 111 50 128 168 163
114 122 73 119 103
103 90 40 24 66 59 75 49 35
16 32 31 40 46
Source: Global Development Finance 2001(World Bank)
*: Though data is not available, it is classified as moderately indebted country in the GDF 2001
Table 10: (a) Cross Country Comparisons -Indebtedness (1998)
(Percent)
Countries PV(EDS)/XGS PV(EDS)/GNP
Indonesia Nigeria Bangladesh India Pakistan Philippine Malaysia Thailand Turkey Uruguay Egypt Nepal Korea Mexico Sri Lanka
Severely
Indebted Countries
Moderately Indebted Countries
Less Indebted Countries
238 184 151 147 220 102 54 116 176 162 129 118 83 121 97
84 81 24 20 42 57 55 58 52 38 32 31 31 44 43
Source: Global Development Finance 2000(World Bank)
[image:31.595.158.440.188.386.2] [image:31.595.182.441.455.657.2]Table 11: Pakistan: History of Paris Club Debt Rescheduling/Restructuring
Terms
Amounts Reshd/Restd
Million US$
Maturity (Years)
Grace Period (Years)
December 14,2001 January 23,2001 January 30,1999 January 14,1981 June 28,1974 May 26,1972
Ad-Hoc Houston Houston Classic Ad-Hoc Ad-Hoc
12,500 1,752 3,254 260 650 234
38 20 15
23 18 15
5 3 3
ODA credits Non-ODA credits
15 10 8
Maturity (Years)
Source: SBP Second Quarterly Report for 2001-2002