© 2018, IRJET | Impact Factor value: 7.211 | ISO 9001:2008 Certified Journal | Page 3211
A COMPREHENSIVE EVALUATION ON PARTIAL REPLACEMENT OF
CEMENT AND FINE AGGREGATES BY STAINLESS STEEL SLAG
SHETTI SHARAN
1, ANUPAMA NATESH
21
PG Student Department of Civil Engineering SDIT Kenjar, Mangaluru, India.
2Assistant Professor Department of Civil Engineering SDIT Kenjar, Mangaluru
---***---Abstract: -
This project is carried out to extract theresults of experimental work carried out to investigate the optimum percentage of SSS in concrete to partially replace the cement and fine aggregates effectively. The experimental work is been carried out to determine the optimum percentage of stainless steel slag to replace cement and fine aggregates effectively in concrete. An attempt is made to replace fine aggregates with SSS from 0 to 60% at an interval of 10% for M40 Grade concrete and is tested for fresh and hardened properties to identify the optimum percentage of SSS in concrete. Then the optimum fine aggregates replacement mix cement is replaced in concrete from 0 to 25% at an increment of 5% by weight of cement to enhance the properties of concrete and is tested for fresh and hardened properties to identify the optimum percentage. Then the optimum replacement mixes of fine aggregates and cement Durability tests such as water Absorption and Water permeability test, Ultrasonic pulse velocity test and Rebound hammer test has been conducted to compare the strength and durability parameters for various replacement percentages.
Keywords:- Stainless steel slag, M40 grade, optimum percentage, durability test, Silica fume
1. INTRODUCTON
Sustainability is the important issue that being considered for the improvement and development of infrastructure. The development of construction field in the world requires more quantity of cement for the sustainable growth. However the production of cement releases enormous amount of carbon di-oxide to the atmosphere which affects ecosystem of the earth. Hence it is necessary to consider the alternative industrial by products to replace the cement effectively in concrete. In the recent stages the use of mineral admixtures like Stainless Steel Slag (SSS) has become an alternative material to substitute cement in concrete which leads to savings in cement and also results in environmental benefits.
At the same time it is necessary to improve the ductility and resistance to crack growth in concrete with improvement in the compressive strength of the concrete. Hence the inclusion of Stainless Steel Slag (SSS) in concrete will increase the toughness and capacity to stand firm against crack growth in concrete.
1.1 Stainless steel slag (SSS)
Stainless steel slag is the by-product of manufacturing stainless steel from scrap iron. It has been reported that chromium is the most harmful element in stainless waste. The stainless steel slag, because of its micro structural morphology, chemical composition and CaO– Al2O3–SiO2 three-phase diagram analysis is nearly
similar to blast furnace slag. Then the stainless steel has both the cementation and pozzolanic reaction characteristics like blast furnace slag to be the binder of concrete.
The reaction involved in this addition of GGBFS in concrete in Place of cement is as shown below Cement (C3S/C2S) + water (H2O)——> C-S-H + Ca(OH)2
GGBFS+H2O ————————>C-S-H+Sio2
Ca (OH)2 + Sio2 ————————> C-S-H
When the GGBFS is mixed in to the concrete as substituting material, it starts reacting with the water and results in the formation of CSH with the assistance of calcium oxides and silicates. A pozzolanic reaction will starts and it consumes additional SiO2 from the GGBFS,
on the other hand, Ca(OH)2 produced with the hydration
of cement and water, yields necessary (Calcium Silicate Hydrates) CSH gel which results GGBFS is a good mineral admixture considering the strength parameters and also durability parameters of the concrete.
1.2 SCOPE
The main scope of this project work is to study the Strength and Durability parameters of Stainless Steel Slag (SSS) based concrete to replace cement and fine aggregates effectively. The major aim of this project is to study suitability and the performance of Stainless Steel Slag (SSS) based concrete which is an alternative to Ordinary Portland Cement (OPC) and Fine aggregates in the concrete production.
1.3 OBJECTIVES
1. To minimize the emission of CO2 from the
manufacture of cement by replacing supplementary cementious materials in concrete.
2. To utilize the industrial waste SSS in concrete which would otherwise disposed.
3. To enhance the strength of the concrete by partially replacing cement and fine aggregates with SSS.
© 2018, IRJET | Impact Factor value: 6.171 | ISO 9001:2008 Certified Journal | Page 3212 5. To establish the optimum suitable combination of
Cement + Stainless Steel Slag for compressive strength test and split tensile strength under laboratory conditions.
6. To reduce the demand of cement and cost of concrete by the addition of mineral admixtures. 7. To contribute to the environment by reducing
pollution.
8. To compare the durability parameters of the concrete for the optimum percentages of Stainless steel slag in place of cement and fine aggregates.
2. MATERIALS TESTING AND METHODOLOGY
2.1 MATERIALS USED 1. Binder
Cement
Stainless Steel Slag 2. Aggregates
Fine aggregates Coarse aggregates
Stainless Steel Slag aggregates 3. Water
4. Super plasticizer
2.1.1 CEMENT
In the present project Birla super cement of grade 53 has been used confirming to the IS: 8112-1976. The physical properties of the cement use has been listed below
Table 2.1: Physical properties of the cement
2.1.2 STAINLESS STEEL SLAG (SSS)
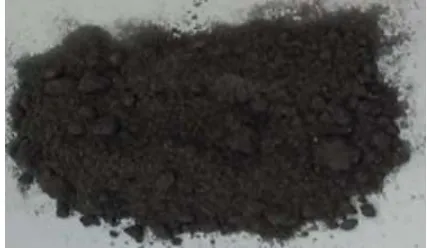
[image:2.595.318.558.355.422.2]Steel slag is obtained from Agni Steels Private Limited, Ingur, TamilNadu. The steel slag is crushed to get the desired size of aggregates and for binder content.
Figure 2.1: Stainless Steel Slag
Table 2.2: Physical properties of SSS
2.1.3 FINE AGGREGATE
For the experimental investigations, locally available fine aggregates (M-sand) have been used.
Table 2.3: Physical properties of Fine aggregate
2.1.4 COARSE AGGREGATE
Coarse aggregates of size 12.5mm down and 20mm down size were used in the experimental investigation. The test results on coarse aggregates are tabulated below
Table 2.4: Physical properties of 20mm down size CA Aggregate impact
value 15.73% Max. 45%
Specific gravity 2.65 2.6 – 2.8
Elongation index 18.65% -
[image:2.595.35.281.437.566.2]Flakiness index 23% -
Table 2.5: Physical properties of 12.5mm down size CA Aggregate impact
value 17.45% Max. 45%
Specific gravity 2.67 2.6 – 2.8
Elongation index 10.79% -
Flakiness index 16.10% -
2.1.5 SUPERPLASTICIZER
In the present experimental investigations MASTER RHEOBUILD SP11 has been as a chemical admixture which is developed by BASF. The main characteristic of this super plasticizer is to enhance the high early strength of the concrete.
Marsh Cone test has been carried out to determine the optimum dosage content of the admixture. For the test it has been optimum dosage of chemical admixture (superplasticizer) is 0.8.
3 MIX PROPORTIONS FOR THE ADDITION OF
SSS TO REPLACE FINE AGGREGATES (FA)
The mix proportions for the addition of SSS have been tabulated below. The concrete cubes will be casted for different percentages SSS and the investigations will be carried out with respect to the Fresh and hardened properties of concrete. As per mix design mix proportion is taken as 1:1.71:3.04.
Sl
no. Properties values
As per the IS:
12269-1987 1 Specific Gravity of cement 3.11 ≤3.15 2 Fineness of cement 6% <10%
3 Initial setting time of cement 60 min >30 min
4 Final setting time cement 385 min <600 min
Sl.no. Physical Property Values
1 Specific gravity 2.70
2 Fineness (In 90µ Sieve) 7%
Sl. no Properties Values
1 Specific gravity 2.64
[image:2.595.50.264.640.764.2]© 2018, IRJET | Impact Factor value: 6.171 | ISO 9001:2008 Certified Journal | Page 3213 Table 3.1: Mix proportions addition of SSS to replace FA
RESULTS AND DISCUSSIONS
For the experimental programme explained the results are tabulated and discussed with respect to fresh and hardened property of blended concrete.
3.1 WORKABILITY TEST ON CONCRETE WITH
SSS TO REPLACE FINE AGGREGATES
[image:3.595.314.565.329.636.2]The workability test is been conducted as per IS: 1199-1959 for the various replacement percentages of SSS and also for the conventional concrete.
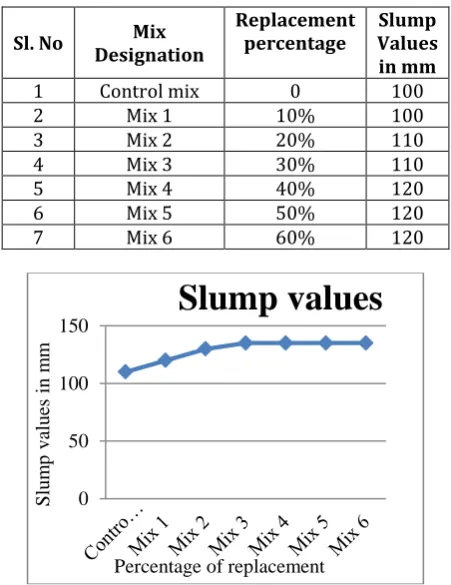
Table 3.2: Slump values for the replacement of SSS
Sl. No Designation Mix Replacement percentage Values Slump in mm
1 Control mix 0 100
2 Mix 1 10% 100
3 Mix 2 20% 110
4 Mix 3 30% 110
5 Mix 4 40% 120
6 Mix 5 50% 120
7 Mix 6 60% 120
Figure 3.1: Slump values for the replacement of SSS in place of FA
From the above results obtained, it can be observed that the initial slump value for the control concrete is in the range of 100mm, as the replacement of FA with SSS increases the slump value increases from 100mm to 120mm with reference to control concrete.. Therefore it is seen that the replacement of partial amount of SSS in to the concrete to replace cement will improves the workability of the concrete without varying the w/c ratio used for control concrete.
3.2 HARDENED TESTS ON CONCRETE WITH SSS
TO REPLACE FINE AGGREGATES
3.2.1 COMPRESSIVE STRENGTH TEST
The determination of compressive strength was carried out as per standard practice IS 4031(part 6-1988The following table shows the average compressive strength of various samples after testing. In this case Fine aggregates are replaced by partial amount of SSS.
Table 3.3: Compressive Strength results for the replacement of SSS
Figure 3.2: Varying compressive strength test results for 7, 14 and 28 days.
The strength parameters in the compressive strength of concrete for 7 days, 14 days and 28 days is shown in the above graphs. From the graph we can note that the compressive strength increases up to 30% replacement of SSS but with 40%, 50% and 60% the compressive strength decreases.
0 50 100 150
Slu
m
p
v
alu
es
in
m
m
Percentage of replacement
Slump values
010 20 30 40 50 60
C
ompre
ssi
ve
stre
ngth i
n
N/mm
2
Percentage of replacement
7 Days 14 Days 28 Days
Mix Desig natio n (Kg/
m3)
Ceme nt
% of Rep lace men t
Wat er cont ent
Fine aggreg
ates SSS
Coarse aggreg
ates Supe
r plasti
cizer W/
C Rat
io
Contr
ol mix 395.0 0% 158 679.05 0 1202.6 0.8% 0.4
Mix 1 395.0 10% 158 611.14 67.09 1202.6 0.8% 0.4
Mix 2 395.0 20% 158 543.24 135.8 1202.6 0.8% 0.4
Mix 3 395.0 30% 158 475.35 203.7 1202.6 0.8% 0.4
Mix 4 395.0 40% 158 407.43 271.6 1202.6 0.8% 0.4
Mix 5 395.0 50% 158 339.5 339.5 1202.6 0.8% 0.4
Mix 6 395.0 60% 158 271.6 407.4 1202.6 0.8% 0.4
Mix Designation
Replac ement percen tage
Average compressive strength(N/mm2)
7
Days Days 14 28 Days
Control mix 0 34.99 37.2 43.39
Mix 1 10% 36.62 40.44 45.43
Mix 2 20% 39.34 42.29 49.06
Mix 3 30% 40.60 43..05 51.36
Mix 4 40% 38.62 42.14 46.34
Mix 5 50% 31.65 34.07 39.31
[image:3.595.45.271.433.726.2]© 2018, IRJET | Impact Factor value: 6.171 | ISO 9001:2008 Certified Journal | Page 3214 3.2.2 SPLIT TENSILE STRENGTH TEST
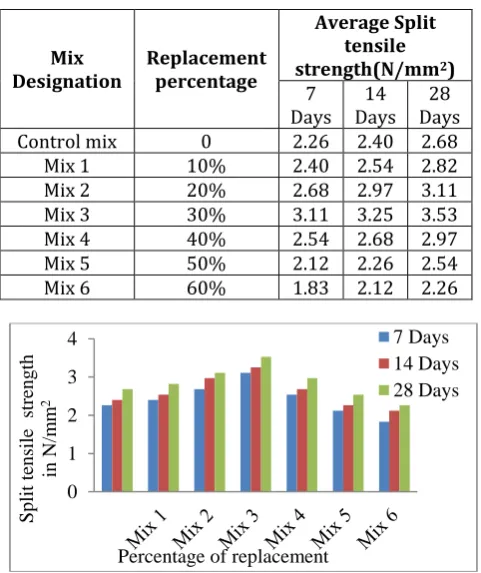
[image:4.595.331.550.58.205.2]The determination of Split tensile strength of the prepared samples was carried out as per standard practice. The following table shows the average split tensile strength of various samples after testing. In this case Fine aggregates are replaced by partial amount of SSS.
Table 3.4: Split tensile strength results for the replacement of SSS
Figure 3.3: Split tensile strength results for 28 days and varying split tensile strength for 7,14 and 28 days
3.2.3 FLEXURAL STRENGTH TEST
The determination of Flexural strength of the prepared samples was carried out as per standard practice. The following table shows the average Flexural strength of various samples after testing. In this case Fine aggregates are replaced by partial amount of SSS.
[image:4.595.36.277.182.469.2]Table 3.5: Flexural strength results for the replacement of SSS
Fig 3.4: Flexural strength test results for 7, 14 and 28 days.
Discussions
From the graph we can note that the split tensile strength increases up to 30% replacement of SSS but with 40%, 50% and 60% the strength decreases gradually. From the workability test results obtained it is seen that, the slump increases as the replacement percentage increases but up to certain limit only i.e., up to 40%. Beyond this replacement limit there is no improvement in workability.
Then from the results obtained for compressive strength test, the mix containing 30% of SSS by weight of Fine aggregates shows the higher compressive strength compared to the other replacement percentages. Hence for the replacement of 30% SSS by weight of Fine aggregates is found to be having optimum compressive strength.
4. Mix Proportions for Replacement of Cement
by Powdered form SSS
Table 4.1: Mix proportions for the replacement of Cement by SSS
4.1 WORKABILITY TEST ON CONCRETE WITH
POWDERED FORM SSS TO PARTIALLY REPLACE
CEMENT
The workability test has been conducted per IS: 1199-1959 for the different replacement percentages of powdered form SSS by fixing the constant percentage of 0
1 2 3 4
Sp
lit ten
sile
s
tr
en
g
th
in
N/m
m
2
Percentage of replacement
7 Days 14 Days 28 Days
0 0.5 1 1.5 2 2.5 3 3.5 4
F
lexur
al st
re
ngth i
n
N/mm
2
Percentage of replacement
7 Days
14 Days
28 Days
Mix
Designation Replacement percentage
Average Split tensile strength(N/mm2)
7
Days Days 14 Days 28
Control mix 0 2.26 2.40 2.68
Mix 1 10% 2.40 2.54 2.82
Mix 2 20% 2.68 2.97 3.11
Mix 3 30% 3.11 3.25 3.53
Mix 4 40% 2.54 2.68 2.97
Mix 5 50% 2.12 2.26 2.54
Mix 6 60% 1.83 2.12 2.26
Mix
Designation Replacement percentage
Average Flexural strength in N/mm2
7
Days Days 14 Days 28
Control mix 0 2.68 2.80 3.04
Mix 1 10% 2.84 2.96 3.18
Mix 2 20% 3.06 3.39 3.38
Mix 3 30% 3.38 3.46 3.78
Mix 4 40% 2.94 3.35 3.48
Mix 5 50% 2.48 3.06 3.16
Mix 6 60% 2.44 2.98 3.02
Mix Des ign atio n
Re pla ce me
nt %
Cem ent
Po wde
red for
m SSS
Wat
er SSS FA CA SP W /C Ra tio
Mix
7 5% 375.2 19.7 158 203.7 475.3 1202.6 0.8% 0.4
Mix
8 10% 355.5 39.5 158 203.7 475.3 1202.6 0.8% 0.4
Mix
9 15% 335.7 59.2 158 203.7 475.3 1202.6 0.8% 0.4
Mix
10 20% 316 79 158 203.7 475.3 1202.6 0.8% 0.4
Mix 11
25 %
296. 2
98.7
5 158 203.7 475.3
120 2.6
0.8
© 2018, IRJET | Impact Factor value: 6.171 | ISO 9001:2008 Certified Journal | Page 3215 FA replaced SSS that is optimum of 30%. The values of
[image:5.595.323.557.58.200.2]Slump in concrete increases as the water content increases. The table below shows the results obtained for Slump test.
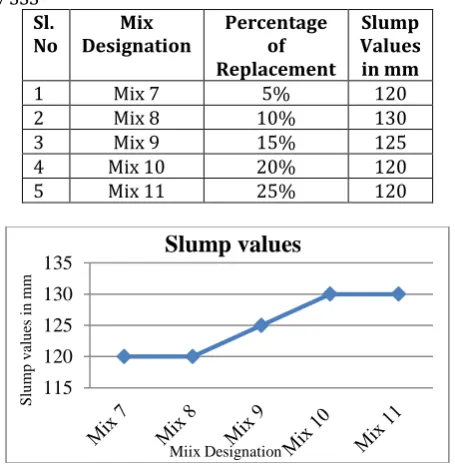
Table 4.2 : Slump values for the replacement of Cement by SSS
Sl.
No Designation Mix Percentage of Replacement
Slump Values in mm
1 Mix 7 5% 120
2 Mix 8 10% 130
3 Mix 9 15% 125
4 Mix 10 20% 120
5 Mix 11 25% 120
Figure 4.1: Slump values for the replacement of Cement by SSS
From the above results obtained, it can be observed that the slump values increases from 120mm to 130mm for the replacement percentage of 5% of SSS and 25% of SSS respectively. This is mainly because of better dispersion of cementitious particles and surface characteristics of SSS particles which are smooth and absorbs little water during mixing.
4.2 HARDENED TESTS ON CONCRETE WITH SSS
TO REPLACE CEMENT
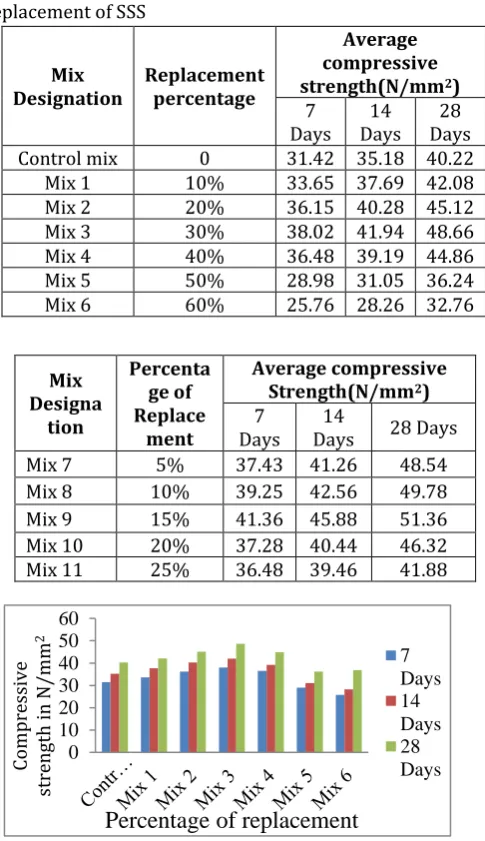
4.2.1 COMPRESSIVE STRENGTH TEST
The determination of compressive strength was carried out as per standard practice IS 4031(part 6-1988). The following table shows the results of average compressive strength of concrete specimens after testing. In this case cement is replaced by partial amount of SSS.
Table 4.3 : Compressive Strength results for the partial replacement of Cement by SSS
Figure 4.2 : Compressive strength test results for 7, 14 and 28 Days
The above graph shows the compressive strength test results for the replacement of SSS. From the results obtained it is found that mix containing 30% of SSS by replacing with Fine aggregates and 15% of powdered form SSS by replacing with cement is having optimum compressive strength.
4.2.2 SPLIT TENSILE STRENGTH TEST
The determination of Split tensile strength of the prepared samples was carried out as per standard procedure. The following table shows the average split tensile strength of various samples after testing. Cement is replaced by partial amount of SSS.
Table 4.4: Split tensile strength results for the replacement cement by SSS
Mix Designation
Percentage of Replacement
Average Split tensile strength(N/mm2)
7
Days Days 14 Days 28
Mix 7 5% 2.68 3.25 3.53
Mix 8 10% 3.25 3.53 3.67
Mix 9 15% 3.39 3.67 4.10
Mix 10 20% 3.11 3.25 3.39
Mix 11 25% 2.80 3.11 3.25
Figure 4.3 : Split tensile strength results for 28 days and varying split tensile strength for 7,14 and 28 days 115
120 125 130 135
S
lu
mp
v
al
u
es i
n
mm
Miix Designation
Slump values
0 10 20 30 40 50 60
C
ompre
ssi
ve
stre
ngth
in N/m
m
2
Mix Designation
7 Days 14 Days 28 Days
0 0.5 1 1.5 2 2.5 3 3.5 4 4.5
S
pli
t
tensil
e stre
ngth i
n
N/mm
2
Mix Designation
7 Days 14 Days 28 Days
Mix Design
ation
% of Repl acem
ent
Average compressive Strength(N/mm2)
7 Days 14 Days 28 Days
Mix 7 5% 41.18 46.37 52
Mix 8 10% 42.07 46.96 52.3
Mix 9 15% 43.11 49.63 54.1
Mix 10 20% 40.15 44.3 48
[image:5.595.44.272.139.372.2] [image:5.595.317.557.450.734.2]© 2018, IRJET | Impact Factor value: 6.171 | ISO 9001:2008 Certified Journal | Page 3216 The above graph shows the Split tensile strength test
results for the replacement of SSS. From the results obtained it is found that mix containing 30% of SSS by replacing with Fine aggregates and 15% of powdered form SSS by replacing with cement is having optimum Split tensile strength.
4.2.3 FLEXURAL STRENGTH TEST
[image:6.595.318.558.59.182.2]The determination of Flexural strength of the prepared samples was carried out as per standard practice. The following table shows the average Flexural strength results of various samples after testing. In this case Cement is replaced by partial amount of SSS.
Table 4.5: Flexural strength results for the replacement cement by SSS
Figure 4.4: Flexural strength test results for 7, 14 and 28 Days
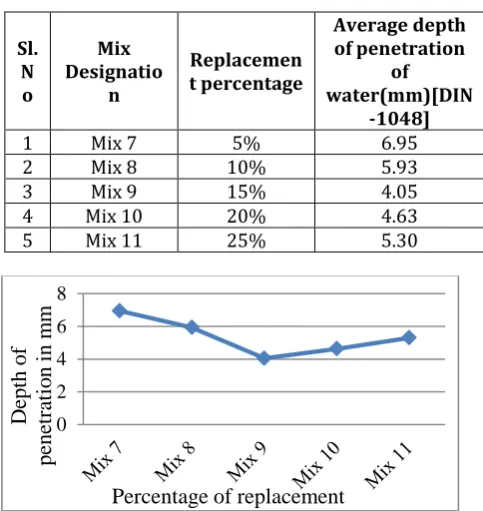
4.2.4 WATER PERMEABILITY TEST
The test is carried out as per German standards DIN 1048 to determine depth of penetration of water into the concrete specimens
Table 4.6 : Water Permeability test results for the replacement of SSS
[image:6.595.322.564.259.515.2]Figure 4.5: Varying depth of penetration for the replacement of FA by SSS
Table 4.7: Water permeability test results for the replacement of cement by SSS
Sl. N o
Mix Designatio
n
Replacemen t percentage
Average depth of penetration
of water(mm)[DIN
-1048]
1 Mix 7 5% 6.95
2 Mix 8 10% 5.93
3 Mix 9 15% 4.05
4 Mix 10 20% 4.63
5 Mix 11 25% 5.30
Figure 4.6: Varying depth of penetration for the replacement of Cement by SSS
From the graphical representation it can be seen that as the replacement percentage of SSS increases the resistance offered for the penetration of water also increases but up to certain limit, on further increment in replacement percentage the resistance offered for the penetration decreases. Hence from the results it can be concluded that the addition of SSS in concrete greatly improves the permeability resistance of concrete.
4.2.5 REBOUND HAMMER TEST RESULTS: (As per IS 8900:1978)
This test is also known as surface hardness test. In this test the rebound hammer is pressed against the surface of the concrete before testing the specimen is made even without any undulations usually the rebound is pressed against the surface 6 positions. The table below represents the rebound hammer test results.
0 2 4 6 8 10 12
Dep
th
o
f
p
en
etr
atio
n
in
m
m
Percentage of replacement
0 2 4 6 8
D
ept
h
of
pene
tr
at
io
n
in
m
m
Percentage of replacement
Mix Designation
Percentage of Replacement
Average Flexural strength(N/mm2)
7
Days Days 14 Days 28
Mix 7 5% 2.94 3.65 3.96
Mix 8 10% 3.74 3.98 4.14
Mix 9 15% 3.84 4.08 4.46
Mix 10 20% 3.68 3.74 3.99
Mix 11 25% 3..24 3.42 3.74
Sl. No
Mix Designation
Percentage of Replacement
Average depth of penetration of
water(mm)[DIN-1048]
1 Control mix 0 10.06
2 Mix 1 10% 9.81
3 Mix 2 20% 8.61
4 Mix 3 30% 7.11
5 Mix 4 40% 7.05
6 Mix 5 50% 8.00
7 Mix 6 60% 9.10
0 1 2 3 4 5
Flex
u
ral
s
tr
en
g
th
in
N/m
m
2
Percentage of replacement
[image:6.595.40.282.265.503.2]© 2018, IRJET | Impact Factor value: 6.171 | ISO 9001:2008 Certified Journal | Page 3217 Table 4.8: Rebound hammer test results for the
[image:7.595.44.274.545.659.2]replacement of SSS
Figure 4.7: Varying strength results of rebound hammer test for the replacement of FA by SSS
Figure 4.8: Varying strength results of rebound hammer test for the replacement of SSS
From the results obtained it is found that mix containing 30% of SSS by replacing with Fine aggregates and 15% of powdered form SSS by replacing with cement is having optimum strength values.
5. CONCLUSION
From the workability test results, it can be concluded that the workability of the concrete increases with the addition of SSS to replace Fine aggregates effectively without change in w/c ratio used for the control concrete, up to certain limit.
The optimum percentage of SSS to replace Fine aggregates effectively is 30% to achieve higher strength.
The optimum percentage of silica fume to replace cement effectively is 15% to achieve better strength. As the SSS percentage increases it was noticed that the
surface hardness of concrete reduces as per Non-destructive test conducted
From the results obtained with respect to Strength and durability of the concrete, it is concluded that the cement can be replaced by 30% SSS to replace FA and 15% Powdered form SSS to replace cement in the concrete.
REFERENCES
1. Arivalagan,S., (2012), ‘Moment Capacity, Cracking Behaviour And Ductile Properties of Reinforced Concrete Beams Using Steel Slag As a Coarse Aggregate’, Global Journal of researches in engineering Civil And Structural engineering, Volume 8, Issue 8.
2. Dilip Kumar Singha Roy, Amitava Sil, (2012) “Effect Of Partial Replacement Of Cement By SilicaFume On Hardened Concrete”, International Journal of Emerging Technology and Advanced Engineering, IJETAE, Volume 2, Issue 8.
3. Mrs. Veena G. Pathan1, Mr. Vishal S. Ghutke2, Mr. Gulfam Pathan, (2012), “EVALUATION OF CONCRETE PROPERTIES USING GROUND GRANULATED BLAST FURNACE SLAG” International Journal of Innovative Research in Science, Engineering and Technology Volume 1, Issue 1.
4. P.S.Kothai and Dr.R.Malathy, (2012), “Utilization Of Steel Slag In Concrete As A Partial Replacement Material for Fine Aggregates” International journal of innovative research in science engineering and technology. Volume 3, Issue 4.
5. Ansu John and Elson John (2013), ‘ Study on the Partial Replacement of Fine Aggregate using Induction Furnace Slag’, American Journal of Engineering Research, Volume 4, Issue 5.
6. Ajay Wanode , Ranjana Samrit, Kanchan Suryawanshi, (2015),“Effect of Industrial Steel Slag on Compressive Strength of Concrete”International journal of emerging trends engineering basic sciences, Volume 2, Issue 4.
7. Banothu Ravinder, (2017), “Experimental study for investigating properties of concrete by using steel slag” IJRET Volume 4, Issue 11.
0 10 20 30 40 50 60
Comp
re
ss
ive
str
en
gth
in
N
/mm
2
Percentage of replacement
7 Days 14 Days 28 Days
0 20 40 60
Com
pre
ss
iv
e
stre
ngth
in
N
/mm
2
Percentage of replacement 7 Days
14 Days
28 Days Mix
Designation Replacement percentage
Average compressive strength(N/mm2)
7
Days Days 14 Days 28
Control mix 0 31.42 35.18 40.22
Mix 1 10% 33.65 37.69 42.08
Mix 2 20% 36.15 40.28 45.12
Mix 3 30% 38.02 41.94 48.66
Mix 4 40% 36.48 39.19 44.86
Mix 5 50% 28.98 31.05 36.24
Mix 6 60% 25.76 28.26 32.76
Mix Designa
tion
Percenta ge of Replace
ment
Average compressive Strength(N/mm2)
7
Days Days 14 28 Days
Mix 7 5% 37.43 41.26 48.54
Mix 8 10% 39.25 42.56 49.78
Mix 9 15% 41.36 45.88 51.36
Mix 10 20% 37.28 40.44 46.32
© 2018, IRJET | Impact Factor value: 6.171 | ISO 9001:2008 Certified Journal | Page 3218 8. M.S.Shetty, (2004), “Concrete Technology and Theory
of Practice”, S.Chand & Co.ltd .
9. Domoaa R. Hussein, Mohammed M. Salman and Khalid M. Owaid, (2016), “Impact of iraqi steel slag used as a partial replacement on ordinary portland cement properties” Applied research journal. Volume 3, Issue 6.