International Journal of Computer Applications (0975 – 8887) Volume 45– No.21, May 2012
A Comparative Analysis of Image Contrast Enhancement
Techniques based on Histogram Equalization for Gray
Scale Static Images
Vinod Kumar
Govt. Polytechnic College Bikaner (Raj) India
Rahul Raj Choudhary
Govt. Engineering College Bikaner (Raj) India
ABSTRACT
Contrast enhancement of digital images is conveniently achieved by spreading out intensity values over the total range of values, known as Histogram Equalisation. Since the enhancement is defined as the processing of an image to achieve more suitable than original image, it is purely application dependent and well proved with the simulation results of various image enhancement techniques. In this paper, we evaluate the performance of different Histogram Equalization techniques proposed for gray scale static images. In order to evaluate, the performance of these techniques, are examined on the basis of AMBE, PSNR and Entropy metrics. In this process enhancement techniques are applied on the images with different sizes and received from different application fields like real images, medical images etc. It is well illustrated in this paper that Brightness Preserving Dynamic Histogram Equalization (BPDHE) is the most suitable technique in terms of mean brightness preservation as it has least average AMBE value. In terms of PSNR, MPHEBP is the most suitable technique because it has the highest average PSNR value. In terms of Entropy, BBHE and RSIHE(r=2) are the best techniques, since these have the highest average Entropy values. The performance of BPDHE is not satisfactory in terms of Entropy.
KEYWORDS
Performance Metrics, Absolute Mean Brightness Error (AMBE), Peak Signal to Noise Ratio (PSNR), Entropy, Contrast Enhancement, Histogram Equalization
1. INTRODUCTION
The primary objective of image enhancement is to improvise the visual aspect and interpretation of information represented by an image. Contrast enhancement is an important area in digital image processing. Histogram Equalization (HE) is one of the most popular, computationally fast and simple to implement techniques for contrast enhancement of digital images [1]. The histogram of a discrete gray-level image represents the frequency of occurrence of all gray-levels in the image [1]. An image histogram is an estimation of the probability distribution of discrete gray-level which provides a graphical representation of the total distribution of the gray values in a digital image [2]. The re-assignment of gray levels in the image can be performed with the Histogram Equalization techniques in order to uniformly distribute intensities of pixels in output image. It is a process of flattening the histogram and using cumulative density function of the image, the dynamic range of the gray-levels is stretched over the complete range [1]. On the other hand this method tends to suffer from brightness saturation and hence it is never used in real applications such as TV. The main applications of HE are found in Medical Image Processing and Radar Image
Processing [3]. Lots of research has already been carried out in this area and many methods have already been proposed for histogram equalization in literature.
Mean preserving Bi-histogram equalization (BBHE) has been proposed to overcome the aforementioned problem of HE [4]. In this method original image’s histogram is divided into two parts based on the mean intensity of the original image and each part is equalized independently.
Recursive mean separate histogram equalization (RMSHE) which is a generalization of BBHE, is proposed to provide not only better but also scalable brightness preservation [5]. In RMSHE the separation is done recursively by separating each new histogram further based on their respective mean. Recursive sub-image histogram equalization (RSIHE) which is a novel extension of HE, is able to preserve the mean energy and overcome the problem facing the conventional HE [6]. RSIHE and RMSHE share the same characteristics in equalizing an input sub-image, except that RSIHE chooses to separate the histogram based on gray level with cumulative probability density equal to 0.5, whereas RMSHE uses mean-separation approach.
Though there are still cases that they are not handled well by BBHE, as they require higher degree of brightness preservation. Minimum mean brightness error Bi- Histogram Equalization (MMBEBHE) which is a novel extension of BBHE, is proposed to provide maximum brightness preservation [7]. In this method, the separation is based on the threshold level, which would yield minimum Absolute Mean Brightness Error.
However, the global histogram equalization will cause an effect on brightness saturation in some almost homogeneous area. To overcome this problem, Multi-peak histogram equalization with brightness preserving (MPHEBP) has been proposed [8]. In this method, the histogram of an image will be considered of many peaks.
Volume 45– No.21, May 2012
2. HISTOGRAM EQUALIZATION
In this section, we describe the details regarding histogram equalization. Suppose x ={x(i,j)} is an input image with L discrete gray levels {𝑋0,𝑋1,𝑋2,… … . , 𝑋𝐿−1}, where x(i,j) is the
intensity of the image at the 2D position (i,j)and x(i,j) ∈{𝑋0,𝑋1,. . . , 𝑋𝐿−1}.
H(X)={ 𝑛0,𝑛1,… . 𝑛𝑘,… … . , 𝑛𝐿−1} is the image x’s histogram,
where nk is the number of pixels whose gray level is Xk.
Based on the histogram H(X), the probability density function (PDF) of the image is defined as-
P(k)=𝑛𝑛𝑘=𝑛 𝑛𝑘
0+𝑛1+⋯……..+𝑛𝐿−1 (1) for k= 0,1,……….,L-1. Where n is the total number of pixels in the image.
From the PDF in (1) the cumulative distribution function (CDF) is defined as
𝐶 𝐾 = 𝑘 𝑃 𝑗
𝑗 =0 (2)
for k= 0,1,……….,L-1.
From the CDF, we define the level transformation function f(k) as -
f(k)=X0+(XL-1–X0).C(k) (3)
for k=0,1,2,…..,L-1
This level transformation function f(k), remaps the input image into the entire dynamic range [X0, XL-1].
3. PERFORMANCE METRICS
The comparison of various image enhancement techniques based on histogram equalization is carried out in objective manner for gray scale images. In this paper, Absolute Mean Brightness Error (AMBE), Entropy and Peak Signal to Noise Ratio (PSNR) are used as the objective measures for performance evaluation of various HE based methods.
3.1 AMBE
AMBE is defined as –
AMBE(x,y) =│Xm - Ym │ (4)
Where Xm is mean intensity of input image x={x(i,j)} and Ym is mean intensity of output image y={y(i,j)}. The value of AMBE should be least for the better brightness preservation.
3.2 PSNR
PSNR is defined as –
Assume that N is the total number of pixels in the input or output image, MSE (Mean Squared Error) is calculated as –
MSE = 𝑥 𝑖,𝑗 −𝑦 𝑖,𝑗 𝑖 𝑗 2
𝑁 (5)
The PSNR is calculated as-
𝑃𝑆𝑁𝑅 = 10𝑙𝑜𝑔10(𝐿−1)
2
𝑀𝑆𝐸 (6)
Where L is the number of discrete gray levels
The value of PSNR should be greater for the better of the output image quality.
3.3 Entropy
For a given PDF P, Entropy Ent[P] is computed as- Ent[P]= − 𝐿−1𝑘=0𝑃 𝑘 𝑙𝑜𝑔2𝑃(𝑘) (7)
The Entropy is a used to measure the richness of the details in the output image.
4. SIMULATION RESULTS
In this section, we implemented seven histogram based techniques for digital image enhancement and performance metrics AMBE, PSNR and Entropy are calculated. These techniques are HE, BBHE, RMSHE, RSIHE, MMBEBHE, MPHEBP and BPDHE. AMBE is used to assess the degree of brightness preservation while both PSNR and Entropy are employed to quantitatively assess the degree of contrast enhancement. In addition, for the qualitative assessment of contrast enhancement, we visually inspect the output image. Simulation of various Histogram Equalization techniques, were performed using Mat-lab v7.7 software. Enhancement techniques are applied on the images of different sizes and from different application fields like real images, medical images etc.
4.1 Assessment of Brightness Preservation
Table 1 represents the AMBE values, where rows correspond to 5 test images and columns correspond to 7 HE-based techniques. The recursive level of RMSHE and RSIHE are fixed to r = 2 and r = 3. From this table, we found that BPDHE can preserve the mean brightness better than HE, BBHE, RMSHE, RSIHE, MMBEBHE, and MPHEBP methods, since it has least AMBE values in all the 5 test images. Second Best technique, in terms of AMBE, is RSIHE (r=3). In the last row of table, Average AMBE is calculated.
4.2 Assessment of Output Image Quality
Table 2 and Table 3 shows matrix of PSNR values and Entropy values respectively. In both Tables, the last row shows the average value of each technique.From Table 2, we found that BPDHE performed well for circuit image only since it has the highest PSNR value for circuit image. Similarly, In terms of PSNR, for the test images pout and chest, MPHEBP performed better than all other methods, and for the test images tire and cameraman, RMSHE (r=3) performed better than all other methods.
From the table 3, we found that in terms of Entropy, RSIHE (r=2) is best in 3 images (pout, tire and circuit), BBHE is best in 3 images (chest, pout and cameraman) and MPHEBP is best in 1 image (cameraman). The performance of BPDHE is not satisfactory in terms of Entropy.
International Journal of Computer Applications (0975 – 8887) Volume 45– No.21, May 2012 Table 1: AMBE - Measurement of The Brightness Preservation
Images HE BBHE
RMSHE RSIHE
MMBEBHE MPHEBP BPDHE
r = 2 r = 3 r = 2 r = 3
Pout 20.11 3.43 0.76 59.12 4.81 2.13 0.21 10.66 0.03
Tire 75.84 19.29 4.97 0.48 7.46 2.46 17.91 12.04 0.03
Chest 15.53 3.25 0.36 86.22 0.51 0.21 0.01 2.01 0.01
Circuit 52.41 18.85 10.18 7.23 11.03 5.23 8.32 1.51 0.04
Cameraman 10.09 24.02 11.38 4.55 9.48 4.45 0.11 13.06 0.02
[image:3.595.53.522.277.452.2]Average 34.80 13.77 5.53 31.52 6.66 2.89 5.31 7.86 0.03
Table 2: PSNR - Used To Assess The Quality Of Output Image
Images HE BBHE
RMSHE RSIHE
MMBEBHE MPHEBP BPDHE
r = 2 r = 3 r = 2 r = 3
Pout 61.61 62.23 65.89 57.39 65.15 68.88 64.39 72.27 66.49
Tire 57.91 68.93 77.53 85.93 73.75 80.88 68.81 73.11 71.49
Chest 67.61 69.61 74.11 54.42 73.59 74.63 73.54 76.75 76.08
Circuit 60.78 65.71 68.21 64.89 67.91 71.06 73.72 80.32 82.17
Cameraman 67.21 66.32 68.71 73.93 69.28 73.26 66.51 70.41 71.61
Average 63.02 66.56 70.89 67.31 69.94 73.74 69.39 74.57 73.57
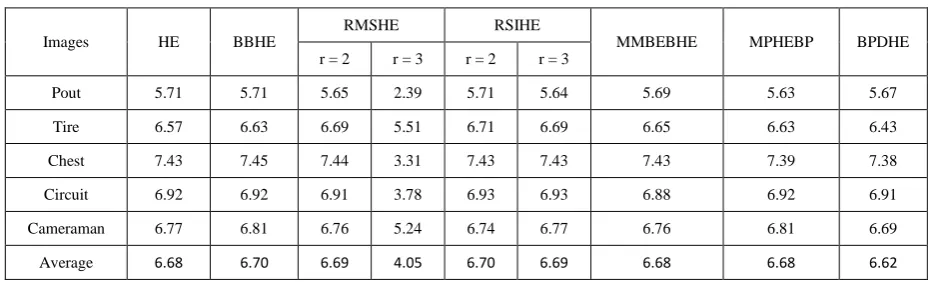
Table 3: Entropy - Used To Measure Richness of Details in Output Image
Images HE BBHE
RMSHE RSIHE
MMBEBHE MPHEBP BPDHE
r = 2 r = 3 r = 2 r = 3
Pout 5.71 5.71 5.65 2.39 5.71 5.64 5.69 5.63 5.67
Tire 6.57 6.63 6.69 5.51 6.71 6.69 6.65 6.63 6.43
Chest 7.43 7.45 7.44 3.31 7.43 7.43 7.43 7.39 7.38
Circuit 6.92 6.92 6.91 3.78 6.93 6.93 6.88 6.92 6.91
Cameraman 6.77 6.81 6.76 5.24 6.74 6.77 6.76 6.81 6.69
Average 6.68 6.70 6.69 4.05 6.70 6.69 6.68 6.68 6.62
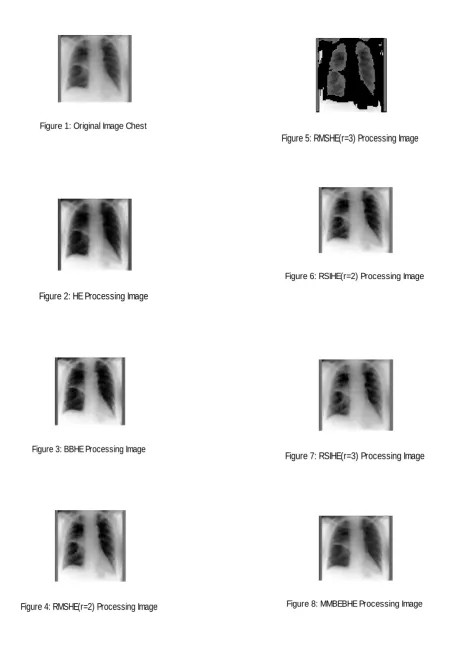
4.3 Inspection of Visual Quality of Output
Images
For the qualitative assessment of contrast enhancement, we also visually inspect the output image. This assessment is used to judge the visual quality of output image and to see whether the output image is quite acceptable to human eyes or have unnatural appearance. We use 5 test images to evaluate the performance of various enhancement techniques based on
[image:3.595.51.523.494.635.2]Figure 1: Original Image Chest
Figure 2: HE Processing Image
Figure 3: BBHE Processing Image
Figure 4: RMSHE(r=2) Processing Image
Figure 5: RMSHE(r=3) Processing Image
Figure 6: RSIHE(r=2) Processing Image
Figure 7: RSIHE(r=3) Processing Image
[image:4.595.375.448.94.174.2]International Journal of Computer Applications (0975 – 8887) Volume 45– No.21, May 2012
5. CONCLUSION
The contribution of this work has made an objective comparison among all the HE methods under study, using quantitative measures, such as the MBP, AMBE, PSNR and Entropy. An analysis showing the preferences of the HE technique on the basis of application for contrast enhancement, brightness preservation and natural appearance has been made. There are various histogram equalization techniques for contrast enhancement of gray scale images. From the experimental results, it is observed that all of these techniques yield improvement in different aspects for different parameters under study.
From the simulation results shown in tables, it is found that Brightness Preserving Dynamic Histogram Equalization (BPDHE) is the most suitable technique in terms of mean brightness preservation because it has least average AMBE value. In terms of PSNR, MPHEBP is the best technique because it has the highest average PSNR value. In terms of
Entropy, BBHE and RSIHE(r=2) are the best techniques, since they have the highest average Entropy values. The performance of BPDHE is not satisfactory in terms of Entropy.
6. REFERENCES
[1] R. Gonzalez and R. Woods, Digital Image Processing, 2nd ed. Prentice Hall, Jan. 2002.
[2] Free scale Semiconductor Document Number: AN4318 [3] Application Note Rev. 0, June 2011
[4] Yeong-Taeg Kim, “Contrast Enhancement using Brightness Preserving Bi-Histogram Equalization”, IEEE Transactions on Consumer Electronics, vol. 43, no. 1, February 1997.
[5] Soong-Der Chen,Abd. Rahman Ramli, “Contrast Enhancement using Recursive Mean-Separate Histogram Equalization”, IEEE Transactions on Consumer Electronics, vol. 49, no. 4, November 2003. [6] K.S. Sim, C.P. Tso, Y.Y.Tan, “Recursive Sub-Image
Histogram Equalization Applied to Gray Scale Images”, Pattern Recognition Letters, vol. 28(2007),pp. 1209-1221.
[7] Soong-Der Chen and Abd. Rahman Ramli, “Minimum Mean Brightness Error Bi-Histogram Equalization in Contrast Enhancement”, IEEE Transactions on Consumer Electronics, vol. 49, no. 4,pp. 1310-1319, November 2003.
[8] K. Wongsritong, K. Kittayaruasiriwat, F. Cheevasuvit, K. Dejhan and A. Somboonkaew, “Contrast Enhancement using Multipeak Histogram Equalization with Brightness Preserving”, IEEE Asia-Pacific Conference on Circuit and System, pp. 455-458, November 1998.
[9] Haidi Ibrahim and Nicholas Sia Pik Kong,“ Brightness Preserving Dynamic Histogram Equalization for Image Contrast Enhancement”, IEEE Transactions on Consumer Electronics, vol. 53, no. 4, November 2007.
Figure 9: MPHEBP Processing Image