GLOVE BASED COMMUNICATION SYSTEM FOR HEARING
AND SPEECH IMPAIRED COMMUNITY USING SIGN
LANGUAGE INTERPRETATION
1S. SAYEED
,
2J. HOSSEN,
3A. HUDAYA, 4M. F. A. ABDULLAH, 5N. MUHAIMAN, 6I. YUSOF1,3,4,5,6Faculty of Information Science and Technology (FIST), Multimedia University (MMU), Malaysia
2Faculty of Engineering and Technology (FET), Multimedia University (MMU), Malaysia,
E-mail: 1[email protected]
,
2[email protected], 3[email protected], 4[email protected] , 5[email protected] , 6[email protected]ABSTRACT
This paper is to enlighten the diversified utility of Data glove as a rehabilitation communication tool as well as a novel and crucial way of secure authentication for hearing and speech impaired community. Apart from that, this system can be used as an interface for robotic control by the aged and disable people which enables the robots to act according to the affective signs. In this novel way of communication where we combined the conventional sign language used by deaf and dump community incorporated with an electronic glove as the medium of communication from which signals are taken and the exacted message is interpreted. The experiments using Singular Value Decomposition (SVD) method of feature selection was showing the evidence of potential application of this idea. The data glove experiments of identifying sign language communication and identifying people were resulted in significant and distinguished models that are suitable for any communication and authentication systems.
Keywords: SVD, American Sign Language, Data Glove, Eucildean Distance, Chebychev Distance,
Mahalanobis Distance. Minikowski Distance
1. INTRODUCTION
Among the several applications of glove based communication which include communication by vocally disabled people, military communication devices and security authentication devices the communication application encompasses the rehabilitation component in it. In this project the main focus will be critical communication using sign language. ASL (American Sign Language) was chosen because it is the most common sign language used all over the world. It is used in most of the English speaking countries all over the world including Canada, Kenya, Malaysia, Singapore and others.
The focus of this study is on the interpretation of sign language symbols which are attained from the electronic glove the subject is wearing. Sign language recognition has been discussed by many researchers (Lichtenauer et al., 2008; Joke Schuit, 2007).
These objectives were attained by the use of SVD (Singular Value Decomposition) feature extraction techniques and distance based classifications.
Different distance classifiers are used on the extracted data to classify the different symbols. A comparison between the different results of the classifiers is made.
The sign language communication chosen is ASL (American Sign Language) because it is the most common sign language used all over the world. It is being used in most English speaking countries all over the world including Canada, Kenya, Malaysia, Singapore and others.
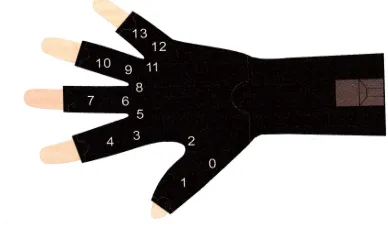
Figure 1: The American Sign Language Letters
In all societies that have vocally disabled people a sign language is formed. Some societies have their very own forms of sign language communication. In most societies the deaf go to educational institutions where a formal and more universal sign language is taught. Some of the more common sign languages taught are: ASL (American Sign Language), BSL (British Sign Language), JSL (Japanese Sign Language), LSA (Argentine Sign Language), GSL (German Sign Language), LSF (French Sign Language) and KSL (Korean Sign Language)
2. MATERIALS AND METHODOLGY
2.1 Data Collection Using Data Glove
The data is an electronic signal acquisition technology that measures signals from hand gestures and movements using flexure sensor located at strategic points of the hand/fingers. The reasons this glove was chosen for this project are: User comfort is high, one size fits all and the noise/crosstalk is low between fingers. Several research experiments have been done in the area of online signature verification using data glove, a number of research have investigated and the experimental results have been reported by the researchers (Sayeed, Andrews, Loo & Rosli, 2007; Sayeed, Kamel & Rosli, 2008; Kamel & Sayeed, 2008; Sayeed, Kamel & Rosli, 2009; Sayeed, Samraj, Besar & Hossen, 2010).
[image:2.612.91.518.408.715.2]Fig. 3 and Fig. 4 show respectively the 5DT Data Glove with the location of the sensors (5DT-Fifth Dimension Technologies, 2013; 5DT glove series, 2013).
Figure 3: The 5DT Data Glove Ultra 14
Figure 4: Sensor Mappings for 5DT Data Glove Ultra 14
Data signals were collected from six random volunteer subjects. 10 symbols were chosen to be tested in the project, these symbols were ; A , D , E , N , Number five(NO5) , O , R , S , W and Y. Each subject was to perform the sign language symbol for each symbol 10 times. In total there were 100 data signal files from all six subjects and hence 600 data signal files.
The 5DT glove which has 14 sensors was used. Each subject was to wear the 5 DT glove on his right hand and get into a seated position. Before any recording would take place a subject had to be in a very relaxed position (seated) with the glove hand rested flat on the table palm down, this is what was referred to as the BASE position while steadily watching the signal movement in the glove manager software another person would wait for the signals to be flat then he would start the recording.
[image:3.612.98.292.267.383.2]When the recording process has begun the subject would wait 3 seconds at the BASE position then steadily raise his hand and perform the Sign language symbol and hold at that position for 3 seconds then steadily go back to the BASE , at this point the recording would be stopped and the signal would be saved.
Figure 5: Subject With Hand At BASE Position (Applications Lab MMU Melaka)
This process was repeated for all the subjects until all the required signals were collected. Analyzing data which has been collected from the hand movement while producing a specific sign using the data glove system is the main working area of this experiment. Every subject have to do each sign ten times while wearing the glove which will then result in ten feature matrices for each symbol. We have randomly selected 10 symbols to be the part of this experiment for which the signals were captured from six subjects. This ten symbols resulted in (10x6x10) = 600 feature matrices for all subjects.
2.2 Feature Extraction
The purpose of feature extraction is to get the important features from the data signal because we need to use these features to classify the data signals. Initially the data signal is a very large matrix full of errors and unnecessary data so extraction will be needed to get the significant features which will represent the entire matrix. The method of feature extraction chosen is SVD.
distance for a particular symbol. These distances are crafted on a graph to make it easier to differentiate between symbols and subjects in the results section.
2.2.1 Singular Value Decomposition (Singular Value Decomposition, 2013; MathWorks, 2013;
Cheng-Ding et al., 2010):
SVD is a powerful tool in linear algebra that is used for feature extraction. Many researchers have used SVD as a useful tool in several domains of application (Francisco et al., 2011; Zhang et el., 2008; Yunus L. E., and A. Demirci, 2008). Cheng,
Chien & Bernard (2010) have used it to condense the dimension and to reduce the effects of overlapping spectral information between noise and signature features, singular value decomposition (SVD) approach was applied.
"The SVD for a complex matrix takes the form shown below:
*
USV
M
=
(1)Where U(m by m), and V(n by n) are orthogonal matrices and S (m x n) is the diagonal matrix. The columns, ui and vi of U and V are the left and right singular vectors respectively, and the diagonal elements of ơi of S are called the singular values" as
mentioned in previous work by (Andrews, Sayeed & Mastorakis, 2010).
"Via the SVD, any matrix M can be written as the sum of r =rank(M)
(2)
Where (
u
i,
σ
i,
v
iT ) is the ith singular triplet of matrix M. Forbenius norm of m x n matrix M of A of rank r2 2 2
1 1 1
||
||
m n r
F i j k
i j k
M
a
a
= = =
=
∑ ∑
=
∑
(3)Where ak are the singular values of M.
The total energy in vector sequence (ak)
associated with matrix M as defined in definition 1, is equal to the energy in the singular spectrum."
The smallest nonzero singular value corresponds to the distance in Forbenius norm, of the matrix to the closest matrix of lower rank, this property makes SVD attractive for approximation and data reduction purposes.
After computing the SVD calculation the diagonal entries of S are equal to the singular values of matrix M. In our case the matrix M is the original matrix containing the data signals.
[U, S, V] = svd(M) produces a diagonal matrix S of the same dimension as M, with nonnegative diagonal elements in decreasing order, and unitary matrices U and V.
The SVD calculation extracts Eigen vectors from the original matrix so the diagonal entries of S are considered to be the Eigen vectors is used to represent the features of the symbols . The selections of SVD values from the total SVD is done as the first 4 largest values and is considered as the feature.
2.3 Feature Classification and Identification
There are several classifiers have been used in this research such as Euclidean Distance, Chebyshev Distance, Mahalanobis Distance and Minikowski distance for the classification and identification of the sign language symbols.
2.3.1 Euclidean distance (Euclidean Distance, 2013; Javed et al., 2007):
"The Euclidean distance between the two points p and q is the length of the segment connecting them. In Cartesian coordinates, if p = (p1, p2,..., pn) and q = (q1, q2,..., qn) are two
points in Euclidean n-space, then the distance from p to q, or from q to p is given by:
2 2 2 2 2 1
1
)
(
)
...
(
)
(
)
,
(
p
q
p
q
q
p
q
np
nd
=
+
+
−
+
+
−
(4)The position of a point in a Euclidean n-space is a Euclidean vector. So, p and q are Euclidean vectors, starting from the origin of the space, and their tips indicate two points. The Euclidean norm, or Euclidean length, or magnitude of a vector measures the length of the vector:
p
p
p
p
p
P
||
...
n.
||
=
21+
22+
+
2=
(5)where the last equation involves the dot product.
A vector can be described as a directed line segment from the origin of the Euclidean space (vector tail), to a point in that space (vector tip). If we consider that its length is actually the distance from its tail to its tip, it becomes clear that the Euclidean norm of a vector is just a special case of Euclidean distance: the Euclidean distance between its tail and its tip."
1
. .
r
T i i i i
M
u
σ
v
=
The Euclidean distance between p and q is just the Euclidean length of this distance (or displacement) vector:
||
q
−
p
||
=
(
q
−
p
).(
q
−
p
)
(6)Which is equivalent to previous equation, and also to:
.
.
2
||
||
||
||
|
||
||
q
−
p
=
p
2+
q
2−
p
q
(7)In one dimension, the distance between two points on the real line is the absolute value of their numerical difference. Thus if x and y are two points on the real line, then the distance between them is computed as
|
|
)
(
x
−
y
2=
x
−
y
(8)In our research, Euclidean distance calculation is used as a means of classifying both the symbols. In the case of symbols we calculate the Euclidean distance between a reference symbol and the trial SVDs of all other symbols.
Furthermore, a number of researchers have used Euclidean distance as the features of classification measurement in various application domains (Mingxin, Z., Z. Lu and J. Shen, 2008; Navaz, K., and M. R. Rahiminejad, 2008; Pirkhezri, M., M.E. Hossain and J. Hadian, 2010; Hui, L. and X. Chen, 2011; Nadir, N. and B. B. Samir, 2011; Fahmi et al., 2012).
2.3.2 Chebyshev Distance (Chebyshev Distance, 2013):
"Is a metric defined on a vector space where the distance between two vectors is the greatest of their differences along any coordinate dimension.It is named after Pafnuty Chebyshev.
It is also known as chessboard distance, since in the game of chess the minimum number of moves needed by a king to go from one square on a chessboard to another equals the Chebyshev distance between the centers of the squares, if the squares have side length one, as represented in 2-D spatial coordinates with axes aligned to the edges of the board.
The Chebyshev distance between two vectors or points p and q, with standard coordinates pi and qi, respectively, is
( )
,
: max
(
i i)
Chebyshev
p q
ip
q
D
=
−
(9)This equals the limit of the Lp metrics: 1 1
lim
n k k i k ip
q i
→ ∞ =
−
∑
(10) hence it is also known as the L∞ metric.Mathematically, the Chebyshev distance is a metric induced by the supremum norm or uniform norm. It is an example of an injective metric.In two dimensions, i.e. plane geometry, if the points p and
q have Cartesian coordinates (x1,y1) and (x2,y2), their
Chebyshev distance is
Chess
max
(
2 1,
2 1)
i
x
x
y
y
D
=
−
−
(11)Under this metric, a circle of radius r, which is the set of points with Chebyshev distance r from a center point, is a square whose sides have the length 2r and are parallel to the coordinate axes."
2.3.3 Mahalanobis Distance (Mahalanobis Distance, 2013):
"Mahalanobis distance is a distance measure introduced by P. C. Mahalanobis in 1936. It is based on correlations between variables by which different patterns can be identified and analyzed. It is a useful way of determining similarity of an unknown sample set to a known one. It differs from Euclidean distance in that it takes into account the correlations of the data set and is scale-invariant. In other words, it is a multivariate effect size." There are a number of research works carried out for the feature classification using Mahalanobis distance in various field of applications (Ramirez et al., 2010; Subaiba, B. A. and M. Habshah, 2010; Helmi, Z. M. S. and R. M. Zeen, 2011).
"The Mahalanobis distance of a multivariate vector
from a group of values with mean
and covariance matrix S is defined as:
1
( )
(
)
T(
)
M
D
x
=
x
−
µ
S
−x
−
µ
(12)
Mahalanobis distance (or “generalized squared interpoint distance” for its squared value) can also be defined as a dissimilarity measure between two
random vectors and of the same distribution with the covariance matrix S :
d x y
( , )
=
(
x
−
y
)
TS
−1(
x
−
y
)
r
r
r
r
r
r
(13)
distance. If the covariance matrix is diagonal, then the resulting distance measure is called the
normalized Euclidean distance."
2.3.3 Minikowski distance (Minikowski distance, 2013):
"The Minkowski distance is a metric on Euclidean space which can be considered as a generalization of both the Euclidean distance and the Manhattan distance.
The Minkowski distance of order p between two points
is defined as:
1
1
n p
p i i i
x
y
=
−
∑
(14)Minkowski distance is typically used with p being 1 or 2. The latter is the Euclidean distance, while the former is sometimes known as the Manhattan distance. In the limiting case of p reaching infinity we obtain the Chebyshev distance:
(
)
1
1 1
lim
max
n p p n
i i i i
k i
i
x
y
x
y
→∞ = =
−
=
−
∑
(15)"3. EXPERIMENTS AND RESULTS
In the context of our proposed glove based communication system, the SVD feature values for all the symbols were calculated
Then the average SVD for all trails of a given symbols is calculated and this average has been used as a reference. Several distance classifiers were used. In this experiment, SVD has been used
to alongside the Euclidean distance to find difference between symbols.
The SVD of a chosen reference symbol A and calculated the Euclidean distance between the reference and the rest of the symbols.
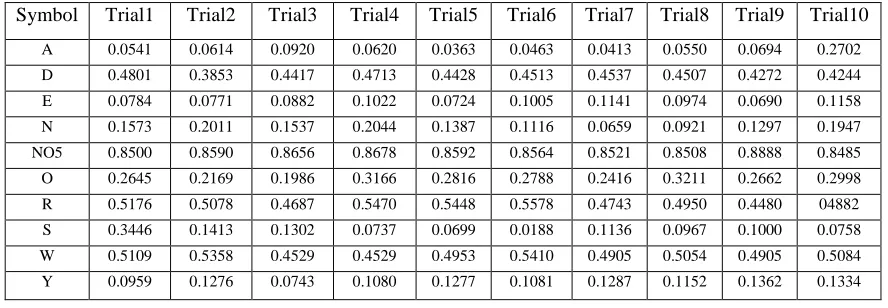
[image:6.612.316.526.272.400.2]The distance of the SVD values of every other trials of symbol A with the SVD features of reference A is very small as compared to the distance between the reference and the other symbols and this shows that the use of SVD is eminent in differentiating the signals by resulting a good classification distances.
Figure 6 : Euclidean Distance Between Symbol A And The All Other Symbols
The graphical representation of Euclidean Distance Between symbol A and the all other symbols are depicted in Fig. 6.
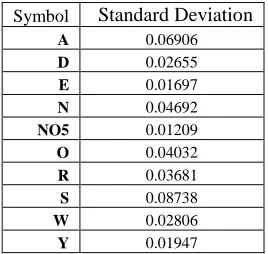
The standard deviation is calculated for the Euclidean distances and we get the average standard deviation for different subjects. The ranges for Symbol Trial1 Trial2 Trial3 Trial4 Trial5 Trial6 Trial7 Trial8 Trial9 Trial10
A 0.0541 0.0614 0.0920 0.0620 0.0363 0.0463 0.0413 0.0550 0.0694 0.2702 D 0.4801 0.3853 0.4417 0.4713 0.4428 0.4513 0.4537 0.4507 0.4272 0.4244 E 0.0784 0.0771 0.0882 0.1022 0.0724 0.1005 0.1141 0.0974 0.0690 0.1158 N 0.1573 0.2011 0.1537 0.2044 0.1387 0.1116 0.0659 0.0921 0.1297 0.1947 NO5 0.8500 0.8590 0.8656 0.8678 0.8592 0.8564 0.8521 0.8508 0.8888 0.8485 O 0.2645 0.2169 0.1986 0.3166 0.2816 0.2788 0.2416 0.3211 0.2662 0.2998 R 0.5176 0.5078 0.4687 0.5470 0.5448 0.5578 0.4743 0.4950 0.4480 04882 S 0.3446 0.1413 0.1302 0.0737 0.0699 0.0188 0.1136 0.0967 0.1000 0.0758 W 0.5109 0.5358 0.4529 0.4529 0.4953 0.5410 0.4905 0.5054 0.4905 0.5084 Y 0.0959 0.1276 0.0743 0.1080 0.1277 0.1081 0.1287 0.1152 0.1362 0.1334
[image:6.612.82.526.511.665.2]standard deviations of Euclidean distance is also calculated.
Table 2. Average Standard Deviation For Euclidean Distance Values With A As A Reference
[image:7.612.353.488.158.288.2]In the next experiment, we used the chebychev distance as the classifier and illustrated the results in Table 3.
Figure 7: Chebychev Distance Between With Symbols With A As A Reference
The graphical representation of Chebyshev Distance Between symbol A and the all other symbols are illustrated in Fig. 7.
Table 4. Average Standard Deviation For Chebyshev Distance Values With A As A Reference
The average standard deviation for chebychev distance is calculated and the results are shown in the Table 4.
In the next experiment the distance vector used is Mahalanobis distance. It is used in this experiment based on correlations between variables by which different symbols patterns such as A, D, E, N, 5, O, R, S, W and can be identified and analyzed. Symbol Standard Deviation
A 0.06906
D 0.02655
E 0.01697
N 0.04692
NO5 0.01209
O 0.04032
R 0.03681
S 0.08738
W 0.02806
Y 0.01947
Trial1 Trial2 Trial3 Trial4 Trial5 Trial6 Trial7 Trial8 Trial9 Trial10 A 0.0309 0.0505 0.0706 0.0543 0.0240 0.0340 0.0398 0.0456 0.0533 0.1970
D 0.4707 0.3750 0.4300 0.4677 0.3344 0.3650 0.3560 0.3490 0.3670 0.3450
E 0.0779 0.0759 0.0843 0.0997 0.0670 0.0930 0.0966 0.0850 0.0680 0.1034
N 0.1445 0.1927 0.1489 0.1934 0.1030 0.0923 0.0598 0.0840 0.1040 0.0945
NO5 0.8105 0.8420 0.8570 0.8230 0.7450 0.7345 0.7324 0.7844 0.7490 0.7234
O 0.2100 0.1944 0.1890 0.2790 0.1980 0.1990 0.2001 0.2110 0.1993 0.2334
R 0.5072 0.4987 0.4350 0.5230 0.5010 0.4980 0.4390 0.3970 0.3890 0.3490
S 0.3300 0.1320 0.1234 0.0680 0.0580 0.0100 0.0980 0870 0.0900 0.0670
W 0.5020 0.5234 0.4422 0.4532 0.3450 0.4320 0.3980 0.4340 0.3890 0.4390
Y 0.0959 0.1196 0.0689 0.1030 0.1030 0.0930 0.1134 0.0940 0.1240 01270
Symbol Standard Deviation A 0.04998
D 0.0509
E 0.01291
N 0.0459
NO5 0.04977
O 0.02678
R 0.06039
S 0.08584
W 0.05112
Y 0.0182
[image:7.612.85.540.365.653.2]Figure 8: Mahalanobis Distance Between Symbols With Symbols A as a Reference
The graphical representation of Mahalanobis Distance Between symbol A and the all other symbols are illustrated in Fig. 8.
The average standard deviation for mahalanobis distance is calculated and the results are shown in the Table 6.
Table 6. Average Standard Deviation For Mahalanobis Distance Values With A As A Reference
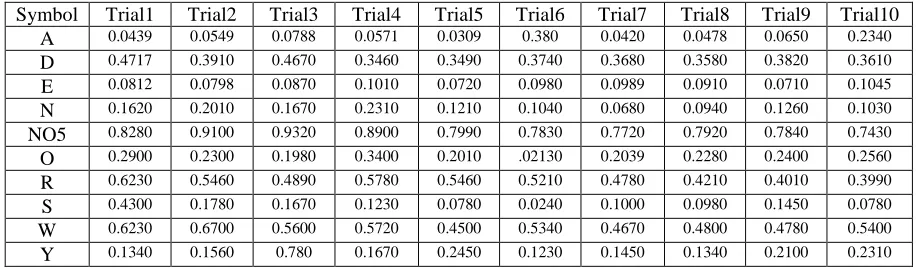
In the next experiment, minkowski distance has used as the distance vector and the results are shown in the Table7.
Symbol Trial1 Trial2 Trial3 Trial4 Trial5 Trial6 Trial7 Trial8 Trial9 Trial10 A 0.0439 0.0549 0.0788 0.0571 0.0309 0.380 0.0420 0.0478 0.0650 0.2340
D 0.4717 0.3910 0.4670 0.3460 0.3490 0.3740 0.3680 0.3580 0.3820 0.3610
E 0.0812 0.0798 0.0870 0.1010 0.0720 0.0980 0.0989 0.0910 0.0710 0.1045
N 0.1620 0.2010 0.1670 0.2310 0.1210 0.1040 0.0680 0.0940 0.1260 0.1030
NO5 0.8280 0.9100 0.9320 0.8900 0.7990 0.7830 0.7720 0.7920 0.7840 0.7430
O 0.2900 0.2300 0.1980 0.3400 0.2010 .02130 0.2039 0.2280 0.2400 0.2560
R 0.6230 0.5460 0.4890 0.5780 0.5460 0.5210 0.4780 0.4210 0.4010 0.3990
S 0.4300 0.1780 0.1670 0.1230 0.0780 0.0240 0.1000 0.0980 0.1450 0.0780
W 0.6230 0.6700 0.5600 0.5720 0.4500 0.5340 0.4670 0.4800 0.4780 0.5400
Y 0.1340 0.1560 0.780 0.1670 0.2450 0.1230 0.1450 0.1340 0.2100 0.2310 Symbol Trial1 Trial2 Trial3 Trial4 Trial5 Trial6 Trial7 Trial8 Trial9 Trial10
A 0.0439 0.0549 0.0808 0.0571 0.0309 0.0411 0.0349 0.0503 0.0608 0.2654 D 0.4717 0.3762 0.4311 0.4616 0.4318 0.4408 0.4407 0.4409 0.4163 0.4129 E 0.0693 0.0654 0.0756 0.0911 0.0646 0.0848 0.1004 0.0852 0.0612 0.1008 N 0.1472 0.1939 0.1406 0.1955 0.1280 0.0998 0.0582 0.0798 0.1223 0.1917 NO5 0.8167 0.8254 0.8322 0.8330 0.8246 0.8228 0.8192 0.8186 0.8570 0.8141 O 0.2559 0.1998 0.1771 0.3066 0.2669 0.2648 0.2257 0.3038 0.2541 0.2882 R 0.5083 0.5041 0.4630 0.5416 0.5367 0.5552 0.4668 0.4857 0.4350 0.4827 S 0.3370 0.1334 0.1230 0.0621 0.0601 0.0152 0.1096 0.0834 0.0941 0.0671 W 0.5045 0.5333 0.4491 0.4587 0.4892 0.5368 0.4728 0.4851 0.5018 0.5020 Y 0.0829 0.1122 0.0637 0.0947 0.1156 0.0916 0.1106 0.0941 0.1133 0.1138
Symbol Standard Deviation
A 0.05953 D 0.04569 E 0.01229 N 0.0513 NO5 0.06465
[image:8.612.92.302.291.408.2]O 0.04511 R 0.07655 S 0.11108 W 0.07153 Y 0.05212
Table 5. Mahalanobis Distance Between Reference Symbol A And All Other Symbols
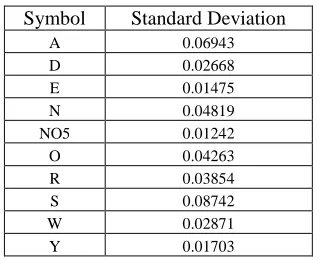
[image:8.612.82.542.583.717.2]Table 8. Average Standard Deviation For Minkowski Distance Values With A As A Reference
The average standard deviation for minkowski distance is calculated and the results are shown in the Table 8.
Figure 9: Minkowski Distance Between Symbols With Sysmbol A As A Reference
The graphical representation of minkowski distance for all the symbols are shown in Fig. 9.
As an overall comparison, Table 9 shows the standard deviation values of all distance classifiers with respect to the sign language symbols. The classifiers with lower standard deviation have less error and hence are more accurate.
From the several experimentals, it has carried out that for symbol A the Chebychev has the lowest while Minowski has the highesr standard deviation. Moreover, in case of symbol D Euclidean has the lowest standard deviation while Chebyshev has the highest. Apart from this, it has also found that in case of sysmbol E Minowski has the lowest standard deviation while mahalanobis has the highesr standard deviation.
Moreover, from the experimental observations, it has revealed that in case of symbol N Chebyshev has the lowest standard deviation while Mahalanobis has the highest. Aperantly, in case of symbol number 5 Euclidean has the lowest standard deviation while Mahalanobis has the highest.
Furthermore, the experimental results demonstrated that in case symbol O Chebyshev has the lowest standard deviation while Mahalanobis has the highest and consequently, in the case of symbol R Euclidean has the lowest standard deviation while Mahalanobis has the highest.
Eventually, in case of symbol S Chebyshev has the lowest standard deviation while Mahalanobis has the highest and on the other hand, in the case symbol W Euclidean has the lowest standard deviation while Mahalanobis has the highest. Lastly, in case of symbol Y Chebychev distance has the lowest standard deviation while Mahalanobis has the highest.
It is noticeable to all these experiments that there was a clear boundary seen among the symbols and subjects in the feature values. We also observed that some distance classifiers have higher standard deviation values than others. High standard Symbol Standard Deviation
A 0.06943 D 0.02668 E 0.01475 N 0.04819 NO5 0.01242 O 0.04263 R 0.03854 S 0.08742 W 0.02871 Y 0.01703
Symbol Euclidean Chebychev Mahalanobis Minowski
A 0.06906 0.04998 0.05953 0.06943
D 0.02655 0.05090 0.04569 0.02668
E 0.01697 0.01291 0.01229 0.01475
N 0.04692 0.04590 0.05130 0.04819
NO5 0.01209 0.04977 0.06465 0.01242
O 0.04032 0.02678 0.04511 0.04263
R 0.03681 0.06039 0.07655 0.03854
S 0.08738 0.08584 0.11108 0.08742
W 0.02806 0.05112 0.07153 0.02871
[image:9.612.96.446.328.602.2]Y 0.01947 0.01820 0.05212 0.01703
[image:9.612.84.520.330.598.2]deviation indicates that there was some error in the data collection process.
It also indicates that a good classification was not achieved which can be seen in the graph. Chebyshev distance and Euclidean distance had the lowest standard deviations and this leads us to the conclusion that they are the better classifiers.
4. CONCLUSION
In conclusion, it has revealed that the distance based classification gives a clear separation among the symbol classes which in turn helps the system to interpret the sign language symbols. The intra distance between a reference symbol K and the trail symbols of kx is small while the distance between reference symbol K and all other symbols features is evidently larger and this shows that each symbol has its own unique features. The percentage of matching we attained was 100% for symbol identification on genuine to genuine cases. So this method can help in the identification of symbols in the glove based communication system. It is also seen that Chebyshev distance and Euclidean distance have better performance than other distance classifiers. The research made here was done to demonstrate that there are differences between subjects’ features of sign language symbols and also to reveal that different sign language symbols can be classified and identified separately. This is to provide a basis on which a secure glove based communication system can be created for hearing and speech impaired community. Apart from this, the applications of a glove based communication also can be included in military applications, Robotic control using gestures and sign language, Rehabilitation engineering, patient and aged people monitoring systems, medical communication applications, to domestic usage by the vocally impaired.
5. REFFERENCES
[1] 5DT (Fifth Dimension Technologies), 2013. Available at: http://www.5dt.com/
[2] 5DT glove series, 2013. Available at: http://www.vrlogic.com/html/5dt/5dt
dataglove_ultra.html
[3] Andrews S., S. Sayeed and N. E. Mastorakis, 2010. Eliminating forgers based on Intra trial variability in online signature verification using Hand glove and photometric signals,
Journal of Information security, Scientific Publications, USA. 1(1):23-28.
[4] Chebyshev distance, 2013, Wikipedia. Available at: http://en.wikipedia.org/wiki/ Chebyshev distance
[5] Cheng-Ding C., W. Chien-Chih and C. J. Bernard, 2010. Singular Value Decomposition Based Feature Extraction Technique for Physiological Signal Analysis, Journal of Medical Systems.
[6] Euclidean Distance, 2013. Available at: http://en.wikipedia.org/wiki/Euclidean
distance
[7] Fahmi, A. I., O. M. Assal, A. A. Nawar, A. A. El-Hosary and M. M. Mohammed, 2012. Genetic Diversity of Brassica napus L. Varities Estimated by Morphological and Moecular Markers. International Journal of Plant Breeding and Genetics., 6(2):83-93. [8] Fancisco O., F. Wong, and A. Ho et al., 2011.
Extraction of Alignment Relationships in Comparable Corpora Based on Singular Value Decomposition. Information Technology Journal., 10(11):2076-2083.
[9] Helmi, Z. M. S. and R. M. Zeen, 2011. Mapping Malaysian Urban Environment from Airborne Hyperspectral Sensor System in VIS-NIR (0.4 – 1.1µm) Spectrum. Research Journal of Environmental Sciences., 5(6): 587-594.
[10] Hui, L. and X. Chen, 2011. A New Particle Swarm Optimization with a Dynamic Intertia Weight for Solving Constrained Optimization Problems. Information Technology Journal., 10(8):1536-1544.
[11] Javed, J., H. Yasin and S.F. Ali, 2007. Human movement Recognition using Euclidean Distance. Journal of Image and Signal Processing, (CISP), pp. 317 – 321. [12] Joke Schuit. 2007. The typological
classification of sign language morphology, Research MA Linguistics Universiteit van Amsterdam. Master’s Thesis.
[13] Kamel, N.S. and S. Sayeed, 2008. SVD-Based Signature Verification Technique Using Data Glove. International Journal of Pattern Recognition and Artificial Intelligence (IJPRAI), World Scientific Publication, 22(3): 431–443.
[15] Lichtenauer, J.F., E.A. Hendriks and M.J. Reinders, 2008. Sign Language Recognition by Combining Statistical DTW and Independent Classification. Inf. & Commun. Theor. Group, Delft Univ. of Technol., Delft. 30:2040 - 2046.
[16] Mahalanobis distance, 2013. Available at: http://en.wikipedia.org/wiki/Mahalanobis distance.
[17] MathWorks, 2013. Available at: http://www.mathworks.com/help/techdoc/ ref/svd.html
[18] Mingxin, Z., Z. Lu and J. Shen, 2008. Salient Region: Presentations of Image Main Contents and its Exaction Algorithms, Inormation Technology Journal., 7(7):992-1000.
[19] Minowiski distance, 2013. Available at: http://en.wikipedia.org/wiki/Minowiski distance.
[20] Nadir, N. and B. B. Samir, 2011. Statistical Model and Wavelet Function for Face Recognition. Journal of Applied Sciences., 11(7):1213-1218.
[21] Navaz, K., and M. R. Rahiminejad, 2008. Chemotaxonomy of Wild Diploid Triticum L. (Poaceae) Species in Iran. International Journal of Botany., 4(3):260-268.
[22] Pirkhezri, M., M.E. Hossain and J. Hadian, 2010.Genitic Diversity in Different Populations of Matricaria Chamomilla L. Growing in Southwest of Iran, Research Journal of Medicinal Plant., 4(1):1-13.
[23] Ramirez, J. S., C. Quinonez-Velazquez, F. J. Garcia-Rodriguez, R. Felix-Uraga and F. N. Melo-Brrenra, 2010. Using the Shape of Sagitta Otoliths in the Discrimination of Phenotypic Stocks in Scomberomorus Sierra (Jordan and Starks, 1895). Journal of Fisheries and Acuatic Science., 5(2):82-93.
[24] Sayeed, S., A. Samraj, R. Besar and J. Hossen, 2010. Online Hand Signature Verification: A Review, Journal of Applied Sciences, 10 (15):1632-1643
[25] Sayeed, S., N.S. Kamel and B. Rosli, 2008. A Sensor-Based Approach for Dynamic Signature Verification using Data Glove. Signal Processing: An International Journal (On-line), 2(1):1-10.
[25] Sayeed, S., N.S. Kamel and B. Rosli, 2009. A Novel Approach to Dynamic Signature Verification Using Sensor-Based Data glove. American Journal of Applied Sciences, USA, 6 (2), 233-240.
[26] Sayeed, S., S. Andrews, C.K. Loo and B. Rosli, 2007. Forgery Detection in Dynamic
Signature Verification by Entailing Principal Component Analysis. Discrete Dynamics in Nature and Society, Hindawi Publishing Corporation , USA, vol. 2007, pp. 1- 8. [27] Sign Language, 2013. Available at:
http://en.wikipedia.org/wiki/sign_language
[28] Singular Value Decomposition, 2013. Available at: http://en.wikipedia.org/wiki/ Singular_value_decomposition.
[29] Subaiba, B. A. and M. Habshah, 2010. Robust Logistic Diagnostic for the Identification of High Leverage points in Logistic Regrassion Model. Journal of Applied Sciences., 10(23):3042-3050.
[30] Yunus L. E., and A. Demirci, 2008. A Damped Least-Squares Inversion Program for the Interpretation of Schlumberger Sounding Curves. Journal of Applied Sciences., 8(22):4070-4078.