The Impact of Joint Replacement on Driver Function and
Safety
Stephanie J. Muh1*, Yousef Shishani1, Jonathan Streit1, Carissa Ann Lucas2, Vinod Sahgal3, Matthew Kraay3, Reuben Gobezie4
1Case Shoulder and Elbow Service, Case Western Reserve University School of Medicine, University Hospitals of Cleveland, Cleve-
land, USA; 2Department of Hematology/Oncology—Solid Tumor Department, The Cleveland Clinic, Cleveland, USA; 3Department of
Orthopaedics, Case Western Reserve University School of Medicine, University Hospitals of Cleveland, Cleveland, USA; 4Cleveland
Shoulder Institute, University Hospitals of Cleveland, Cleveland, USA. Email: *[email protected]
Received June 24th, 2012; revised July 28th, 2012; accepted August 10th, 2012
ABSTRACT
Background: The timing of return-to-driving following total joint replacement has not been well-defined. The primary aim is to study the impact of joint replacement on driver safety. A secondary aim is to investigate the possible predictors for increased car accidents in patients undergoing total joint replacement surgery. This data will provide the background to support further prospective studies on the relationship of driver safety to joint replacement surgery. Methods: A ret-rospective analysis of driver safety in the postoperative period was performed by analyzing the self-reporting of 485 patients who had undergone a Total Hip Arthroplasty (n = 196), Total Knee Arthroplasty (n = 258) or Total Shoulder Arthroplasty (n = 31). The mean age was 70 (28 - 88) with 164 male (34%) and 319 female (66%). Patients were mailed a questionnaire and the responses were analyzed to determine what factors affect driving after joint replacement. Re-sults: Overall, increased patient age and gender were associated with increased accidents following surgery. Our sub-group analysis demonstrated that in patients undergoing TSA, increased patient age was associated with increased acci-dents. TKA patients showed that older patient age predicted increased accidents following surgery. Conclusion: While age and gender are correlated with increased accidents after joint replacement in general, no factors specific to joint replacement surgery are related to increased incidence of accidents.
Keywords: Total Hip Arthroplasty; Total Knee Arthroplasty; Total Shoulder Arthroplasty; Driving; Driver Safety; Traffic Accidents
1. Background
Long term projections of joint replacement show a con- tinued increase in demand for total shoulder, hip and knee arthroplasties [1,2]. After a joint replacement, a pa- tient’s everyday life is profoundly affected due to the in- ability to drive postoperatively [3]. Many patients are ea- ger to resume driving as early as possible and it is often up to the orthopaedic surgeon to advise their patient on when to drive. With little evidence available and limited guidelines in the literature, the orthopaedic surgeon has the difficult task of making a recommendation in regards to a patient’s ability to return to driving after surgery. Most surgeons do not know when patients return to driv-ing regardless of their recommendations. It is possible that multiple factors, such as patient confidence, prior injury, and other socioeconomic issues impact a patient’s decision to resume driving. To better understand our
pa-tients’ expectations and habits in the postoperative period, we conducted a survey to see how soon they began driv-ing followdriv-ing total hip arthroplasty (THA), total knee arthroplasty (TKA) and total shoulder arthroplasty (TSA). Additionally, we asked the patients to rate the impact of surgery on their confidence and perceived ability to drive.
2. Materials and Methods
inability to read English, prior surgery, revision arthro-plasty, and any post-operative complications.
All procedures were performed by three fellowship- trained total joint replacement surgeons. A standard post- operative course was followed for each patient, which consisted of inpatient hospitalization until adequate pain control had been achieved, and regular follow-up visits beginning two weeks after surgery. Although rehabilita-tion exercises were prescribed, no specific guidelines were given to patients with regard to the timing of return to driving following surgery, other than complete cessa-tion of narcotics. Patients were encouraged to practice in a parking lot prior to driving on roads, and to use good judgment in assessing their ability to drive safely.
A total of (1025) patients met the criteria for inclusion in this study. Of those, there were (424) THA patients, (514) TKA patients and (87) TSA patients. These pa- tients were mailed a questionnaire as well as a detailed letter from the principal investigator (RG) inviting them to participate. The questionnaire asked patients to recall how soon following surgery they began driving an auto- matic transmission, as well as how confident they were in their driving abilities after surgery. Additionally, they were asked to rate the impact joint replacement surgery had on their ability to drive. Patients were instructed to return the completed questionnaires and were then de- identified and collected in a database for review. Four hundred and eighty-five (485) patients agreed to partici- pate in the study. Of these, (196) were THA patients, (258) were TKA patients and (31) were TSA patients. The questionnaire was sent between 24 and 144 months from the time of surgery. A logistics model was used to predict factors that affected the number of accidents a patient would have after any type of arthroplasty. Sig-nificance was set at p < 0.05.
3. Results
The average age of patients in the study was 70.0 +/– 9.0 years, with the average total hip arthroplasty (THA) be-ing 70.5 +/– 10.1 years, total knee arthroplasty (TKA) being 70.1 +/– 7.6 years and total shoulder arthoplasty (TSA) being 66.3 +/– 11.5 years (Table 1).
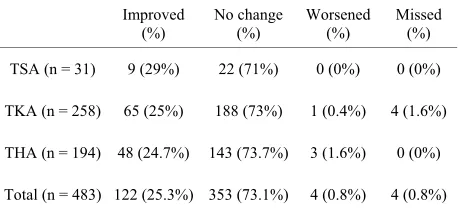
In general, patients were very confident in their driv-ing abilities followdriv-ing arthroplasty of all three joints. On a scale of 1 to 5, with 5 being most confident and 1 being not confident, patients reported a confidence of 4.9 +/– 0.4. TSA patients reported a mean of 4.90 +/– 0.3, pa-tients post THA reported a mean 4.89 +/– 0.45, and TKA patients reported a mean of 4.91 +/– 0.38 (Table 2). Fur-thermore, 100% of patients after TSA, 98% of patients after THA, and 98% of patients following TKA reported no change or improvement in driving ability after total joint arthroplasty (Table 3).
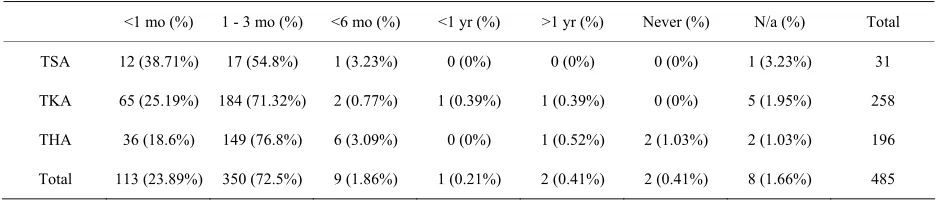
[image:2.595.309.538.373.501.2]Most patients following total joint replacement re-turned to driving in less than 6 months (Table 4). In gen-eral, 24% (n = 113) of patients started driving in less than 1 month after surgery. Within 3 months, 96% (n = 463) of patients were driving and 98% (n = 472) were driving within 6 months. There were a total of 49 patients who were involved in accidents after having a joint replace-ment and 96% (47/49) were within the first six months post-operatively (Table 5). 38.7% (n = 12) of the patients with a total shoulder replacement started driving within 1 month, 93.5% (n = 29) within 3 months, and 96.7% (n = 30) within 6 months. There were 2 accidents in the TSA group with 1 in a patient who returned to driving within 1 month of surgery (8.33%), and another who returned in 1 - 3 months (5.89%). The TKA and THA groups resumed driving slower than TSA patients, with only 25.2% and 18.6% respectively, resuming driving within 1 month of their surgery. However, following TKA, 96.5% of pa-tients resumed driving within 3 months, and 97.3% had resumed driving within 6 months. In this group there were a total of 25 accidents with 10 occurring in patients who returned to driving within 1 month (15.4%), 15 in
Table 1. Patient demographics.
Age Significance Male Female Significance
TSA (+/– 11.5)66.3 p = 0.03* 17 (55%) 14 (45%) p = 0.87
TKA (+/– 7.6)70.1 p = 0.06 73 (28%) 185 (72%) p = 0.01*
THA (+/– 10.1)70.5 p = 0.43 74 (38%) 120 (62%) p = 0.35
Total (+/– 9.0)70.0 p = 0.016* 164 (34%) 319 (66%) p = 0.039*
[image:2.595.307.538.550.585.2]*p < 0.05 = statistically significant.
Table 2. Confidence in driving ability following total joint replacement.
TSA TKA THA Total
4.90 +/– 0.30 4.91 +/– 0.38 4.89 +/– 0.45 4.90 +/– 0.40
Table 3. Self perception of surgery’s impact on driving abil- ity.
Improved
(%) No change (%) Worsened (%) Missed (%)
TSA (n = 31) 9 (29%) 22 (71%) 0 (0%) 0 (0%)
TKA (n = 258) 65 (25%) 188 (73%) 1 (0.4%) 4 (1.6%)
THA (n = 194) 48 (24.7%) 143 (73.7%) 3 (1.6%) 0 (0%)
[image:2.595.309.538.625.732.2]Table 4. Number of months after surgery when patient returned to driving.
<1 mo (%) 1 - 3 mo (%) <6 mo (%) <1 yr (%) >1 yr (%) Never (%) N/a (%) Total
TSA 12 (38.71%) 17 (54.8%) 1 (3.23%) 0 (0%) 0 (0%) 0 (0%) 1 (3.23%) 31
TKA 65 (25.19%) 184 (71.32%) 2 (0.77%) 1 (0.39%) 1 (0.39%) 0 (0%) 5 (1.95%) 258
THA 36 (18.6%) 149 (76.8%) 6 (3.09%) 0 (0%) 1 (0.52%) 2 (1.03%) 2 (1.03%) 196
[image:3.595.63.531.102.202.2]Total 113 (23.89%) 350 (72.5%) 9 (1.86%) 1 (0.21%) 2 (0.41%) 2 (0.41%) 8 (1.66%) 485
Table 5. Post-operative accidents compared to time return to driving.
#Patients returning to
drive (<1mo) Accidents (%)
#Patients returning to drive
(1 - 3 mo) Accidents (%)
#Patients returning to
drive (<6mo) Accidents (%)
TSA 12 1 (8.33%) 17 1 (5.89%) 1 0 (0%)
TKA* 65 10 (15.38%) 184 15 (8.15%) 2 0 (0%)
THA 36 1 (2.78 %) 149 19 (12.75%) 6 2 (33.33%)
Total 113 12 (10.60%) 350 35 (10%) 9 2 (22.2%)
*1 patient did not respond on time return to driving.
patients who returned to driving within 3 months (8.15%). One patient did not respond when they returned driving. Similarly, after THA, 95.4% of patients resumed driving within 3 months and 98.5% resumed driving within 6 months of their surgery. There was a total of 22 accidents with 1 accident within 1 month (2.78%), 19 within 3 months (12.75%) and 2 within 6 months (33.33 %).
Overall, increasing age (p = 0.016) and gender (p = 0.039) were significantly correlated with increased acci-dents post-arthroplasty. There was no correlation be-tween other investigated variables (time return to driving or perceived patient opinion on how joint arthroplasty affected their driving ability) and incidence of postopera-tive accidents. An odds ratio demonstrates that women have 1.5 increased odds of having accidents postopera-tively than men. For patients who had total shoulder ar-throplasty, patients had an increased incidence of acci-dents postoperatively with increasing age (p = 0.03). For patients who had total knee arthroplasty, gender (p = 0.01) was associated with more accidents following surgery. After TKA, females had 2.12 increased odds compared to males. However, for total hip arthroplasty, no factors were associated with increased accidents after surgery.
4. Discussion
The recommended time for a patient to return to driving after total joint arthroplasty is not clearly defined in the literature. One factor thought to predict driving ability is reaction time, or the time it takes to react to a stimulus and move from the accelerator to the brake. The litera-ture quotes anywhere from 4 - 6 weeks to up to 8 months
following hip arthroplasty [4,5] and 10 days to 8 weeks for total knee arthroplasty [6-9]. To our knowledge, there is no literature in regards to total shoulder arthroplasty and when patients can safely return to driving.
Our study suggests that the factors that determine post-operative driving ability vary based on the specific joint replaced. Chen et al. [3] conducted a survey of 70 patients who refrained from driving following fracture and found that the inability to drive presented a major difficulty to 42% of respondents, with 31% reporting a minor difficulty. Additionally, the inability to drive caused major financial hardship in 26% of respondents. Because inability to drive causes such a great inconven-ience, many patients are eager to return to normal driving habits following surgery. Indeed, Chen et al. [3] found that many patients did not consult with their doctors be-fore resuming driving, and that many started driving while still taking opioid pain medications. The issue of readiness to drive following fractures of the extremities was also studied by Rees and Sharp [10], who found a large variability in response among orthopaedic surgeons presented with scenarios involving upper extremity defi-cits, with majority agreement in only 43% of different presented scenerios. Also, in a study of orthopaedic sur-geon activity recommendations following trauma, Chen
In our study, we found that patient’s age and gender were found to be important in increased incidence of accidents post-operatively. Overall, older patients were at higher risk of being involved in accidents post-opera- tively. Additionally, females had higher odds of post- operative accidents compared to men. In the TSA group, only increased patient age was associated with increased accidents following surgery, and the specific time to re-turning to drive did not predict accidents following sur-gery. This association appears intuitive, as patients age, they can develop increasing debilitating conditions that can place them at-risk for collisions. Despite this, 94% of patients returned to driving within 3 months. This issue is especially important because a large proportion of pa-tients undergoing TSA are over the age of 65. Studies by the National Highway Traffic Safety Administration have shown that drivers over age 65 have one of the highest rates of traffic accidents per mile driven [11]. While re-action time and judgment certainly play a large role in fatal accidents, upper extremity function is at least one of the factors which must also be considered as demon-strated by the fact that in 27% of fatal traffic accidents involving a driver over the age of 65, the driver was turn- ing left.
In our study the majority of our patients returned to driving within 6 months after joint arthroplasty. Current literature recommends patient return to driving 4 - 8 weeks after total hip surgery [4,5] and anywhere from 10 days to 8 weeks following TKA [6-9]. Even though our patients seemed to fall within these recommended guide-lines, all recorded accidents occurred within 6 months. Therefore, other factors may play a role in contributing to accidents after surgery that were not investigated in this study. In separate prospective studies, Marques et al., found that brake response time improved at 30 days for patients undergoing right TKA and 10 days for left TKA. The authors concluded that right TKA patients should wait 30 days prior to return to driving automatic trans-missions and left TKA patients may return in 10 days [7,9]. MacDonald et al. suggested that some patients can take up to 8 months to completely recover driving reac-tion time back to the pre-operative level [5]. Therefore, it is likely that patient safety in returning to drive after joint arthroplasty is dependent on multiple factors.
Limitations of our study relate to its retrospective de-sign, the relative small number of patients, and the vari-ety in the number of patients within each subgroup. Ad-ditionally, other joint arthroplasties were not investigated in this study. The increasing incidence of these arthro-plasties (ankle, elbow, etc.) warrants future consideration. Despite its retrospective nature, our study reports on our patients opinions and beliefs about their driving ability and the objective driving outcomes.
5. Conclusion
Our results suggest that while age and gender plays a role in driver safety, there are many factors that determine post-operative driving ability. A significant number of patients return to driving within the first six months after joint replacement surgery. Early return to driving within the first six months may be related to an increased risk of accident. This should be considered when advising pa-tients on when it is safe to return to drive after a joint re- placement.
REFERENCES
[1] J. S. Day, E. Lau, K. L. Ong, G. R. Williams, M. L. Ram- sey and S. M. Kurtz, “Prevalence and Projections of Total Shoulder and Elbow Arthroplasty in the United States to 2015,” Journal of Shoulder and Elbow Surgery, Vol. 19, No. 8, 2010, pp. 1115-1120.
doi:10.1016/j.jse.2010.02.009
[2] S. Kurtz, K. Ong, E. Lau, F. Mowat and M. Halpern, “Pro- jections of Primary and Revision Hip and Knee Arthro- plasty in the United States from 2005 to 2030,” The Jour-
nal of Bone & Joint Surgery of American, Vol. 89, No. 4,
2007, pp. 780-785. doi:10.2106/JBJS.F.00222
[3] V. Chen, A. T. Chacko, F. V. Costello, N. Desrosiers, P. Appleton and E. K. Rodriguez, “Driving after Musculos- keletal Injury. Addressing Patient and Surgeon Concerns in an Urban Orthopaedic Practice,” The Journal of Bone
& Joint Surgery of American, Vol. 90, No. 12, 2008, pp.
2791-2797. doi:10.2106/JBJS.H.00431
[4] S. B. Ganz, A. Z. Levin, M. G. Peterson and C. S. Rana- wat, “Improvement in Driving Reaction Time after Total Hip Arthroplasty,” Clinical Orthopaedics and Related
Research, Vol. 413, No. 413, 2003, pp. 192-200.
[5] W. MacDonald and J. W. Owen, “The Effect of Total Hip Replacement on Driving Reactions,” Journal of Bone &
Joint Surgery ofBritish, Vol. 70, No. 2, 1988, pp. 202-205.
[6] T. J. Spalding, J. Kiss, P. Kyberd, A. Turner-Smith and A. H. Simpson, “Driver Reaction Times after Total Knee Re- placement,” Journal of Bone & Joint Surgery ofBritish, Vol. 76, No. 5, 1994, pp. 754-756.
[7] C. J. Marques, J. Cabri, J. Barreiros, A. I. Carita, C. Frie- secke and J. F. Loehr, “The Effects of Task Complexity on Brake Response Time before and after Primary Right Total Knee Arthroplasty,” Archives of Physical Medicine
and Rehabilitation, Vol. 89, No. 5, 2008, pp. 851-855.
doi:10.1016/j.apmr.2007.10.025
[8] J. L. Pierson, D. R. Earles and K. Wood, “Brake Response Time after Total Knee Arthroplasty: When Is It Safe for Patients to Drive?” The Journal of Arthroplasty, Vol. 18, No. 7, 2003, pp. 840-843.
doi:10.1016/S0883-5403(03)00326-7
[10] J. L. Rees and R. J. Sharp, “Safety to Drive after Com-mon Limb Fractures,” Injury, Vol. 33, No. 1, 2002, pp. 51-54. doi:10.1016/S0020-1383(00)00153-4
[11] National Center for Statistics and Analysis, “Traffic Safe- ty Facts 1997: Older Population,” 2010.