IMPROVING DECISION QUALITY IN URBAN
STORM WATER MANAGEMENT PROJECTS BY
USING THE 3DI SYSTEM
Floor Speet
s0202568
Master thesis
Master Civil Engineering & Management
Track Water Engineering & Management
Subject: Master thesis
Name: Floor Speet
Email: [email protected]
Date: 02-10-2014
University: University of Twente
Supervisors University: Dr. Ir. M.J. Booij Dr. M.S. Krol
Company: Nelen & Schuurmans
Supervisor company: Ir. Jorik Chen
Study: Master Civil Engineering & Management
Track: Water Engineering & Management
Source of the picture on the front page:
Summary
Climate change will lead to more extreme rainfall in cities. Together with urbanization, this will lead to an increased chance of flooding in cities. Measures should therefore be taken in the urban environment. Important is the decision about which measure will be implemented, a water simulation model can be helpful for this. The use of a water simulation model for this decision can possibly increase the decision quality. However, there is a lack of knowledge about the effects of the use of a model on the decision quality. The objective of this study is therefore to assess the impact of using a water simulation model on decision quality in urban storm water management projects. The studied water simulation model is the 3Di system. 3Di Waterbeheer is an instrument that can visualize flooding processes in 3D and can calculate the effectiveness of measures.
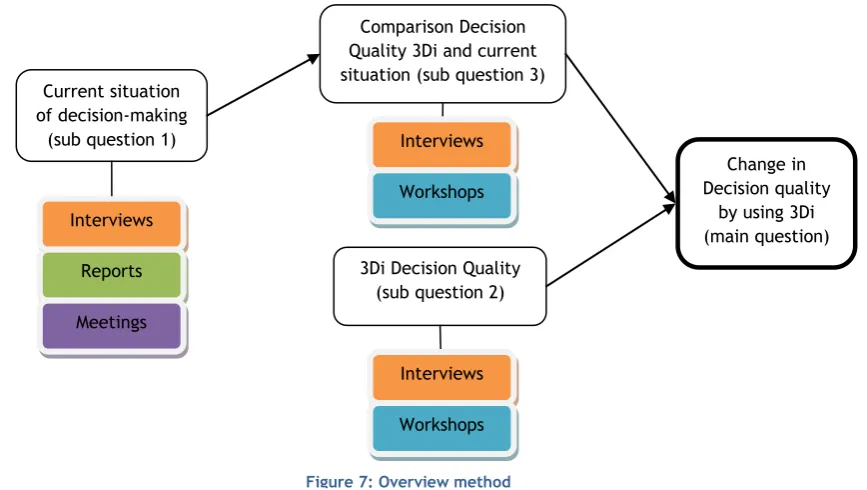
The main research question is ‘What is the difference in decision quality of urban storm water management projects as Rainproof in Amsterdam caused by using detailed, quick and interactive models as the 3Di system in comparison to the current decision quality of these projects?’. Amsterdam Rainproof is a program that aims to make the city of Amsterdam more Rainproof in the future. The main question is answered by first studying the current situation of decision-making in urban storm water management projects (sub question 1). After this the decision quality while using the 3Di system is identified for these projects (sub question 2). Finally, the decision quality while using the 3Di system is compared with the decision quality of the current situation (sub question 3).
The research questions are answered with a range of methods. Interviews are held to obtain information about the current situation of decision-making and about decision-making processes. After this, two cases are used to execute workshops. One case is a project in the Rivierenbuurt in Amsterdam, water management measures can be integrated in the redesign of a main road. The other case concerns the Houtmankade in Amsterdam. This is a low-lying area where adaptations are needed for future rainfall. Decision-makers from the municipality and the water board are brought together in these workshops to discuss about measures and evaluate the measures with 3Di. The most important workshop result is the questionnaire that is filled in by every participant. The decision quality of the process using 3Di is measured in the workshops by using eleven decision quality elements. Besides that, the decision quality difference between a process with and without 3Di is measured in the same way.
Preface
This is the master thesis of my master Civil Engineering and Management, track Water Management and Engineering, at the University of Twente. During the graduation period, I worked mostly at Nelen & Schuurmans Utrecht. In addition, I had several meetings about the cases at Waternet in Amsterdam.
I would like to thank the colleagues of Nelen & Schuurmans for the time they took to explain me the 3Di system. Besides that, the lunch walks were a good way to interrupt the working day. Especially, I would like to thank Jorik Chen for his useful comments and discussions about the thesis. Besides that, I appreciated the help and enthusiasm for the workshops from Eljakim Koopman and the others from Waternet that helped me.
Many thanks for the help of the supervisors from the university, Maarten Krol and Martijn Booij. The advice and flexibility was very helpful during the process.
Contents
Summary ... iii
Preface ... iv
Contents ... v
Definitions ... vii
1. Introduction ...1
1.1. Motivation of the research ...1
1.2. Decision-making ...2
1.3. Problem statement and hypothesis ...4
1.4. Research objective and research questions ...5
1.5. Research questions ...7
1.6. Report outline ...8
2. Methodology ...9
2.1. Overview per research question ...9
2.2. Cases ... 10
2.3. Measurement method decision quality ... 12
2.4. Interviews ... 20
2.5. Workshops ... 21
2.6. 3Di system ... 25
3. Results ... 27
3.1. Current situation of decision-making ... 27
3.2. Decision quality of 3Di ... 29
3.3. Difference in decision quality between reference situation and 3Di ... 32
3.4. Result per criterion ... 35
4. Discussion ... 39
4.1. Construct validity ... 39
4.2. Internal validity ... 42
4.3. External validity... 42
4.4. Reliability ... 44
5. Conclusions and recommendations ... 46
5.1. Conclusions ... 46
5.2. Recommendations ... 48
6. Bibliography ... 51
Appendix A. Selection of decision quality elements ... 56
B.1. Interview Laurence Peels 04-04-2014 ... 58
B.2. Interview Paula Bijlsma 09-04-2014 ... 59
B.3. Interview Anne Leskens 15-04-2014 ... 59
B.4. Interview Jeroen Kluck 17-04-2014 ... 60
B.5. Interview Cees-Anton van den Dool 17-04-2014 ... 61
B.6. Interview Thomas Staverman 22-04-2014 ... 61
B.7. Interview Leo Schulp 02-06-2014 ... 62
B.8. Interview Reindert Bant 06-06-2014 ... 64
B.9. Interview Peter Ulle 18-06-2014 ... 65
Appendix C. Workshop handouts ... 66
C.1. Workshop Rivierenbuurt ... 66
C.2. Workshop Houtmankade ... 67
Appendix D. 3Di model choices ... 69
Appendix E. Questionnaire ... 70
Appendix F. Results questionnaire ... 72
F.1. Question answers ... 72
F.2. Results open questions questionnaire ... 73
F.3. Interpretation results for decision quality elements ... 75
Definitions
3Di system An integrated water management system of the 3Di consortium that focuses on speed, accuracy, integration and interaction (Nelen & Schuurmans, 2014). Separate 3Di model can be created for different locations and purposes.
Alternative One of the possibilities in a decision. In this research an alternative is a storm water measure, for example green roofs. An alternative can also be a combination of different measures.
Amsterdam Rainproof Urban storm water management project in Amsterdam executed by the municipality of Amsterdam and Waternet. The term ‘rainproof’ is defined as a situation in which the hindrance of storm water is acceptable for all stakeholders.
District councils of Seven district councils in Amsterdam have the responsibility over the Amsterdam important decisions in their own assigned neighborhood. An important
is the management of public space, as road renewal and maintenance of squares.
Climate change Future change in climate. This research focuses especially on rainfall pattern changes due to climate change
Decision-making process The process in which stakeholders decide about a solution for a problem. In this research this is the decision about which measure will be taken for urban storm water. This contains the whole process, from initial problem until implementation.
Decision quality Quality of the process, final decision and input of information of the decision-making process, evaluated using a framework. Decision quality is different from the quality of the outcome (Keisler, 2011). Decision quality elements Elements in which decision quality can be divided. These elements are
further divided in sub elements.
Effects (of measures) The effects of measures after implementation, in this research this especially focuses on a reduction of storm water.
Mainstreaming Combining climate change with other (socio-economic) drivers (Gersonius et al., 2012). The main focus of a projects is in that case not water management, but water management is integrated in another project. The Dutch term used is ‘meeliften’.
Public participation The direct involvement of the public in decision-making. In addition, the term ‘public involvement’ or ‘stakeholder participation’ is sometimes used instead of public participation (Giupponi et al., 2006).
Storm water Direct rainwater runoff
Urban resilience The robustness and rapidity of a city as a system to react by adaptation or mitigation on, for example, flooding (Lu & Stead, 2013). Waternet Organization that performs the executive tasks related to water of the municipality of Amsterdam and the water board Amstel, Gooi en Vecht
1.
Introduction
This chapter introduces the study subjects, objects and objectives. Section 1.1 describes the motivation of the study. Section 1.2 gives information about the decision-making processes and decision quality. Section 1.3 introduces the problem and hypothesis of the study. Section 1.4 describes the study objects and objective further. Section 1.5 gives the main and sub research questions. Section 1.6 outlines the structure of the remaining part of the report.
1.1.
Motivation of the research
Future climate change and urbanization will lead to more problems with urban flooding (Hammond et al., 2013). Climate change will affect rainfall patterns in the whole world, this will especially give problems in cities because of the high density of paved areas. Unfortunately, there is much uncertainty about the impacts of climate change, due to both uncertainty in climate projections and uncertainty in hydrological models (Arnbjerg-Nielsen et al., 2013). Most global conclusions on climate change predict an increased average earth temperature and sea level rise. For the Netherlands this will result in more extreme rainfall events in the summer. The average sum of rainfall will increase with 5-27% in 2050. In the winter, the sum of rainfall will increase with 4-14 % in 2050. The intensity of rainfall events will increase also due to climate change. For 2100 these percentages will be even higher than for 2050 (Dorland & Jansen, 2007). The future impact of measures reducing climate change effects is thus uncertain because the uncertainties in climate change. The worldwide urban population is expected to grow from 3.6 billion in 2011 to 6,3 billion in 2050. This will result in more impervious areas, increased urban runoff and higher exposure to flood hazard in cities (Hammond et al., 2013). For example, it is expected that the intensity of rainfall will increase in the future in Amsterdam, while the paved area will increase due to more dwellings (Uittenbroek et al., 2013).
[image:9.595.84.516.438.611.2]
Figure 1: Flooding of the Rijnstraat on July 28th 2014 (source: Frederique @fevroom) Figure 2: Flooding of a street close to the Rijnstraat on July 28th 2014 (source: Ruben Steeman )
The hindrance of floods in cities is relatively high because of the high density of people and concentration of economic activities (Heikkila & Huang, 2013). Urban flooding can have negative effects on many activities, such as education, employment and traffic. This can lead to financial losses in a city (Hammond et al., 2013). Because of this, cities should be more resilient for flooding and should be capable to adapt easily and rapidly to changes (Lu & Stead, 2013). Climate change and thereby an increase of rainfall is an example of these changes. In Figure 1 and Figure 2 flooded streets in Amsterdam are displayed, the water hindrance was caused by very heavy rain on the 28th
In many cities around the world projects have started to increase the urban resilience (for changes as climate change) and Amsterdam is one of these cities. The project Rainproof has started in January 2014 and it will contribute to both current storm water bottlenecks and mainstreaming of storm water strategy in the city in the future (Uittenbroek et al., 2013). An important part of these storm water management projects is the choice between possible measures. Decisions made in urban storm water management projects may rely on predictions of rainfall, the effects on the city and the expected effects of measures. These predictions can be made with a flood simulation model. More accurate and detailed predictions can lead to a higher decision quality and thereby hopefully less storm water hindrance.
Flood simulation models are increasingly detailed and quick because of increased possibilities with computers (Hammond et al., 2013). Frank Tibben and Anne Leskens (Leskens et al., 2014) are currently doing research about the decision-making process and the use of models in flood disaster management and urban storm water management projects. They are both doing this research for the University of Twente (as respectively master thesis and PhD thesis) and Nelen & Schuurmans. The study of Leskens et al. (2014) concentrates on flood disaster management. The other study concentrates on improvements by changing the decision-making process itself. No research about the effect of the use of a water simulation model for decision quality in storm water management projects is done.
1.2.
Decision-making
This study focuses on the decision-making process of urban storm water management projects. A description of the decision-making process and how to optimize the outcome is given in this section.
1.2.1. Decision-making process
The decision-making process is described in literature with different frameworks. Many authors make the distinction between a process with a clear start and end and a process with repetition of some steps. Hommes (2008) describes this as the rounds model and the phase model. The phase model (also called analytical decision-making) has different phases that follow on each other. The rounds model (or participatory decision-making) consists of rounds with a decision at the end, so more small (but crucial) decisions are made. A complex participatory decision-making process can better be seen as a rounds model in which different decision-making rounds are passed. Actors can contribute each round and can change the content and directions of the total process (Hommes, 2008). Mintzberg (1976) describes a different representation, with distinct phases that are not sequentially related and can individually be passed several times. Grünig & Kühn (2009) uses sequential phases, but going back to an earlier phase is done often.
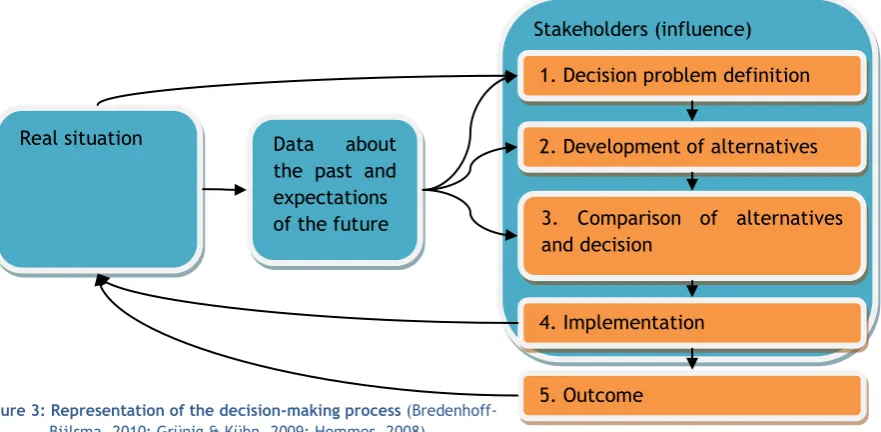
The problem of a decision-making process comes from the ‘real situation’. At the end of the process, the real situation is changed, depending on the decision made. In addition, data about the past and expectations about the future are important input of the decision-making process (Lu & Stead, 2013). These are important for the formulation of the problem, formulation of alternatives and the comparison of alternatives. Expectations can be trends or threats and are often determined using a model or other ways of data interpretation. The stakeholders perform step one until four in the decision-making process, although this are not always the same stakeholders for each step. Steps in the decision process are; the decision problem, development of alternatives, comparison of alternatives and decision and implementation, see Figure 3. During the step 1, the decision problem definition, the decision is defined and criteria for the result are set (Hommes, 2008). Knowledge about the current situation and the stakeholders is needed for this. The second step is the development of alternatives. Alternatives affect mostly different disciplines, this is the case for urban water management projects because integration is an important aspect. Storm water concerns both the drainage and aboveground disciplines. Besides that both private and public buildings, roads, parks and tunnels can be affected (Kluck et al., 2013). The third step is the comparison of effects of alternatives and the decision. The effects of measures can be determined in detail with a model, so a flood simulation model can be helpful for this. Although, alternatives can also be compared on other fields of interest than effects on storm water. A shared vision between the stakeholders is important to reach a collective decision. Public participation can contribute to a this. In addition, participation can ensure that a measure will be acceptable and executable (Huitema et al., 2009). Furthermore, public participation can be important for the implementation (step four) because it improves the legitimacy and accountability of decision-making (Huitema et al., 2009). The implementation is the realization of the chosen alternative what affects the situation of the world. The last step is the outcome, which is not influence by the stakeholders but by other factors. The outcome is the result of the implementation, how well the alternative reduces the problem and what the effects are on other aspects.
1.2.2. Decision quality
[image:11.595.83.524.77.293.2]It is desired to have a good outcome or a good decision in most decision-making processes. Many different definitions of ‘a better decision’ are used in literature. Ramos et al. (2013) state that it depends on economic benefit, “better decisions are those that provide the most economic benefit” (Ramos et al., 2013, p. 2230). In health care a better decision is obtained when the client understands the decision and had the possibility to ask all his/her questions (Fraenkel et al., 2011).
Figure 3: Representation of the decision-making process (Bredenhoff-Bijlsma, 2010; Grünig & Kühn, 2009; Hommes, 2008)
Stakeholders (influence)
Real situation Data about the past and expectations of the future
1. Decision problem definition
2. Development of alternatives
3. Comparison of alternatives and decision
4. Implementation
Arvai & Froschauer (2010) states that whether one decision is better than another decision is determined by the quality of the decision and the decision process.
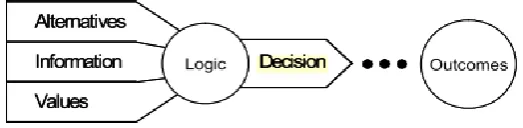
[image:12.595.162.424.273.337.2]However, the desired result of a decision-making process is a good outcome, what is different from a good decision according to many authors. Figure 4 presents one theory, which is followed in this research. The decision is made by using information, values, alternatives and combining these with logic. The decision is then the final choice, the outcome is what occurs after this choice (Mcnamee & Celona, 2008). Howard (2007), Mcnamee & Celona (2008) and Keisler (2011) state also that decision and outcomes are different because alternatives that were not chosen cannot be tested on quality. Besides that, effects of the outcome are not known when the decision is made. Arvai & Froschauer (2010) states that outcomes are often seen as part of the decision quality, because people judge a decision on the effects is has. Arvai & Froschauer (2010) argue that this is not right because even the ‘best’ decision-making process can results in bad outcomes. In their research lay people evaluated the decision quality more on the outcomes than on the decision-making process.
Figure 4: Representation of decision-making process (Mcnamee & Celona, 2008)
Because the quality of the outcome cannot be determined, the quality of the decision should be measured by the chance on a good outcome (Mcnamee & Celona, 2008). The chance on a good outcome increases when the quality of the decision-making process is higher.
1.3.
Problem statement and hypothesis
One part of the project Rainproof Amsterdam is the comparative assessment of different measures that will be implemented (step 3 in Figure 3). These decisions should be made by all stakeholders of the storm water problem in the city; governmental institutions, companies and inhabitants. The implementation of the Rainproof program can possibly be improved by using a detailed flood simulation model as the 3Di system to compare alternatives and make a decision. An improvement for a project can be obtained when the result of the chosen decision is better. However, good decisions can lead to bad outcomes or results after implementation. The decision process can be independent from the outcome of the decision. The outcome is only a future result that cannot be tested on quality beforehand (Howard, 1988). The quality of the decision can thus only be maximized to increase the chance on a good outcome. This quality might be increased by using a water simulation model. However, there is not much research done about the difference in decision quality due to water simulation model use. The problem statement is therefore:
1.4.
Research objective and research questions
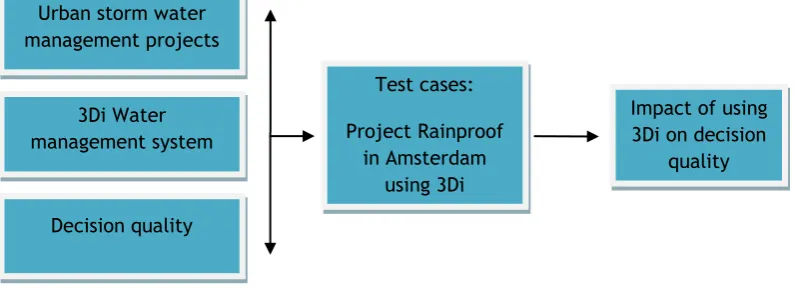
This section describes the objective, scope, research model and research questions. Figure 5 gives an overview of the research model. The decision quality of urban storm water management projects is assessed with the test cases using or not using the 3Di system. The boxes in Figure 5 are further explained in the next sections.
1.4.1. Research objective
The research objective is to assess the impact of using a quick, detailed and interactive water simulation model as 3Di on decision quality in urban storm water management projects.
1.4.2. Research scope
The research focuses on the decision-making process of urban storm water management projects. Decisions are made between possible measures for addressing storm water problems, taken by either organizations or individual people. The research focuses on step 2 and 3 from Figure 3, development of alternatives, comparison of alternatives and the decision between alternatives. These steps are expected to be influenced by water simulation models as 3Di and are affecting the decision quality. The implementation and outcome are not affecting the decision quality because these steps are occurring after the actual decision. An important aspects of the studied projects is the connection to other projects (‘meeliften’). Such projects are not sole projects, but join other projects and insert water management in these.
The research focuses on urban storm water management. Flood disaster management is not studied. Focus points of flood disaster management projects are emergency management and rehabilitation of floods (Akter & Simonovic, 2005), besides that decisions have to be made in a very short time. These situations can possibly occur in an urban environment, but occur mostly in locations outside cities.
[image:13.595.96.495.163.308.2]The quality of the decision procedure is not considered in the research, but is seen as a fixed factor. This includes the knowledge of the makers, the compilation of the group decision-makers and for example the setting and location of the decision process. Stakeholders of the decision-making process in urban storm water management projects are governmental organizations, as the municipality of Amsterdam and Waternet, companies, but also inhabitants. The stakeholders of a specific project location depend on the scale of the problem and measure. Stakeholders in this research are governmental organizations as Waternet, district council and the city service of traffic and transport. Inhabitants are not directly involved.
Figure 5: Research model Urban storm water
management projects
Impact of using 3Di on decision
quality 3Di Water
management system
Test cases: Project Rainproof
1.4.3. Research objects
The research objects are urban storm water management projects and water simulation models. The program Amsterdam Rainproof is used as a test case for urban storm water management projects. The 3Di system is used as an example of water simulation models. The functionalities of the 3Di system are leading for the functionalities of a water simulation model in this study. This research will contribute to these projects by finding opportunities of integration of the 3Di system in the Rainproof program, proving a broad application of the 3Di system and increasing awareness about Rainproof. More information about urban storm water management projects as Amsterdam Rainproof and water simulation models as 3Di is given in the next sections.
Urban storm water management projects
Urban storm water management projects are projects in a city where water management is involved. Due to more and more intense rainfall in the future, storm water measures should be integrated more in urban projects. Water management is mostly not the main purpose of these projects, but for example the redesign of public space or reducing traffic problems. Some cities in the Netherlands (for example Amsterdam and Rotterdam) are setting up programs to integrate water management projects in other projects in the city. The projects of Amsterdam Rainproof are used as example of urban storm water management projects in this study. Amsterdam Rainproof is a temporary program with the goal to make Amsterdam more vulnerable to extreme rainfall by initiating the integration of water management in other projects. It is expected that projects in other cities have many similarities to Amsterdam Rainproof and the projects belonging to it.
Water simulation models and decision-making tools
Models can be used to predict the impact of alternatives to assist the comparative assessment between alternatives. The advantage of models is that they can describe complex relationships and deal with large amounts of data. Models have been proven to be successfully in creating awareness of measures for lay people and other stakeholders.
According to many authors models are not always used in decision-making processes. Limitations in calculation time and flexibility of flood simulation models cause reduced advantages of model use. Another argument of not using a model is uncertainty about the model results. Therefore in some decision-making processes rules of thumb are used rather than models (Leskens et al., 2014). The uncertainty of the model results is partly caused by miscommunication between scientists, who make the model, and the practitioners. On this can be anticipated by more collaboration between the scientists and the practitioners, the scientists have to listen better to the practitioners wishes and knowledge to decrease the uncertainty of model results (Morss et al., 2005). Disadvantages of decisions based on models are the objectivity of scientific models, they can only be validated after the decision is implemented. Besides that, not all stakeholders will accept the results of the model. When participatory modeling is used, that means that modeling is done with a constant dialogue between stakeholders and experts, model results are seen as more relevant and reliable (Craswell et al., 2007). To overcome these problems with model use, new models are developed.
Bousquet, 2010). AQUATOOL is a model that suggests a decision for problems in river basins in Spain, based on the input of stakeholders. This model affects the communication between decision-makers, reduces the complexity of the decision and eases the setting of priorities (Andreu et al., 1996). WOLK is a quite new model for water simulation on the street and is currently used in the Netherlands. WOLK calculates overland flow based on precipitation and surface elevation (DEM). The output of the tool is a map with an overview of locations with needed water storage (Klok, 2012).The newest model is the 3Di system, this model is studied in this research because it uses the current possibilities of computer calculation and is interactive (in contrast to most models described before). Besides that, the model is calculating very fast and is still detailed (Nelen & Schuurmans, 2014).
[image:15.595.118.452.358.539.2]TU Delft, Deltares and Nelen & Schuurmans develop the 3Di system. 3Di Waterbeheer is an instrument that can visualize flooding processes in 3D and can calculate the effectiveness of measures (Ven, 2012). It can assist the designer with knowledge about expected damage and risks. The 3Di system focuses on a short calculation time, a high level of detail and visualization for also non-technical people (Nelen & Schuurmans, 2014). The startup of 3Di has been ended in April 2014, so 3Di can be used for flooding projects now. The model will be developed further by including more functionalities (as a sewage module). A case study in West-Friesland showed that 3Di is useful for flood risk scenarios and damage calculations (Nelen & Schuurmans, 2013a). The 3D–visualizations in the case study were supporting the commitment of stakeholders (Nelen & Schuurmans, 2013a). Figure 6 shows the appearance of the 3Di system.
Figure 6: Print screen of the 3Di background system, with a map the area around Amsterdam Houtmankade
1.5.
Research questions
The main question is:
What is the difference in decision quality of urban storm water management projects as Rainproof in Amsterdam caused by using water simulation models as the 3Di system in comparison to the current decision quality of these projects?
The main question will be answered with help of three sub questions:
1. What is the current situation of decision-making in urban storm water management
projects?
2. What is the decision quality using the 3Di system in urban storm water management projects?
The decision quality of using the 3Di system itself can point out the weak and strong points of the model. This information can help to identify on which points the use of the 3Di system can improve the decision quality.
3. What are the changes in decision quality elements in urban storm water management
projects caused by using the 3Di system in comparison to the current decision quality in these projects?
In comparison to older models or without using a model, the 3Di system is said to be more detailed, quicker and more interactive. Using the 3Di system might improve therefore the decision quality, but no research has been done about that.
1.6.
Report outline
2.
Methodology
This chapter describes the methodology used in this research. Section 2.1 describes the methodology per research (sub) question. Section 2.2 explains the cases used. Section 2.3 gives the measurement method for the decision quality elements. Section 2.4 describes the interview method and the interviewees. Section 2.5 describes the workshops executed for the cases and the questionnaires held during the workshops. Section 2.6 describes the 3Di system used.
2.1.
Overview per research question
The main question of the study is:
What is the difference in decision quality of urban storm water management projects as Rainproof in Amsterdam caused by using water simulation models as the 3Di system in comparison to the current decision quality of these projects?
The main question is answered by combining the sub questions. Possible improvements of using the 3Di system in these projects can be derived from the decision quality. This is both the decision quality of 3Di and the comparison of decision quality with the current situation. An graphical overview of the method can be found in Figure 7. The sub questions are answered as following:
1. What is the current situation of decision-making in urban storm water management
projects?
The current situation of decision-making is determined mostly by interviews (see section 2.4 and Appendix B). A small part of this question is answered with information from project reports and meetings attended during the research period (see Appendix B). The current or reference situation can differ for different people. The following information about the current situation is needed:
- Description of the steps taken in the decision-making process - Stakeholders involved in the decision-making process
- Model use in the decision-making process
- Requirements of information used in the decision-making process (needed for workshop
setup)
2. What is the decision quality of the 3Di system used in urban storm water management
projects?
For each case (see section 2.2), a workshop is held (see section 2.5). The decision quality of 3Di is determined by the opinion of the workshop participants. The decision quality is split up in decision quality elements for measurement. The decision quality elements and their measurement method can be found in section 2.3. As preparation for the workshop and additional information about the decision quality, some interviews were held (see section 2.4). For the workshop the 3Di system is used, a description of the 3Di model can be found in section 2.6.
3. What are the changes in decision quality elements in urban storm water management
projects caused by using the 3Di system in comparison to the current decision quality in these projects?
use of 3Di in the process can be identified. In addition, interviews are held to determine the decision quality more accurate.
2.2.
Cases
Two cases are studied in this research, case Rivierenbuurt and case Houtmankade. Both cases are projects in Amsterdam with future water management issues. In both areas, water management should be integrated in other project according the Amsterdam Rainproof program. The cases were selected because they were current projects, the decision process has already started. The study contributes thus to the projects and stakeholders are already known. The Amsterdam Rainproof program is firstly described in this section, afterwards, the both cases are described.
2.2.1. Program Amsterdam Rainproof
The municipality of Amsterdam is implementing the program Rainproof in the city. Amsterdam Rainproof is a program that initiates a movement that makes the city gradually rainproof. The program has started in January 2014 and will last for one and a half year. The reason for the program is the increasingly vulnerable city due to climate change in combination with urbanization. The long-term goal is to have a rainproof city in 2050. Rainproof does not have quantifiable goals (as no water on the street for a certain amount of rain). The goal (for 1.5 year) is to make the city more rainproof by the following changes:
- increasing awareness and insight in the way of possibilities of contribution for everyone in the city
- adding value by smart investments in small solutions that use rainwater to solve other problems, this will make the city greener and more livable
- integrating a rainproof way of thinking in public organization
- dealing better with rainwater and reducing storm water damage by increasing the sponge-effect, solve bottle-necks and protect valuable objects better
The program approach focuses on networking, communication and mainstreaming. Networking means the active involvement of inhabitants, housing corporations, administrators and officials of the municipality, district organizations and initiatives and entrepreneurs. Communication implies that Rainproof will be a known and visible project. Mainstreaming involves dealing naturally with extreme rainfall, even when the project is finalized (Amsterdam Rainproof, 2014).
Current situation of decision-making
(sub question 1) S Interviews
Reports Meetings
3Di Decision Quality (sub question 2)
Comparison Decision Quality 3Di and current situation (sub question 3)
Change in Decision quality
by using 3Di (main question) Interviews
[image:18.595.86.520.101.346.2]Interviews Workshops Workshops
The decision-making process of the Rainproof program is defined as a participatory approach. Stakeholders of the problem and especially inhabitants are very important for the Rainproof program, Rainproof should be an open proactive platform. The problem of extreme rainfall concerns not only public areas but also private areas. Rainproof will focus therefore on integration of different disciplines and stakeholders, both the municipality, companies and private people (Uittenbroek et al., 2013). The project team Rainproof is trying to reach the highest level of involvement, self-control, by the end of the startup period. However, this is not possible to include in this research. With self-control and many stakeholders, the workshop would have been difficult to organize and no structured answers could have been obtained.
For the Rainproof program the goal is set by the project team, location specific goals have to be set by the other stakeholders. After this, alternatives are developed. For the Rainproof program, the project team or experts mostly set the alternatives and other stakeholders can bring up additional alternatives. The Rainproof program does not aim to implement large measures in the Rainproof program, but to integrate the concept in future projects. The urgency is not very high, but the city has to be prepared for rainfall related problems. Another important aspect of Rainproof is integration of different disciplines, besides a solution for the rain problem measures can also contribute to other aspects of the city. These aspects of Rainproof are tried to integrate in the research by proposing measures in line with the Rainproof program. These are thus relative small measures that reduce also other problems in the city.
Recently, a study about locations vulnerable for flooding by extreme rainfall in Amsterdam was done. This study was not very detailed, but an idea of problem locations could be acquired. A location is vulnerable for this study by a combination of water problems and budget needed to solve the problems. The study stated that the centre of Amsterdam was most vulnerable. After this the Vondelpark area and Oudzuid (with the Rivierenbuurt located inside) were also seen as vulnerable. This was done with an analysis with WOLK (a model from Tauw), whereupon the results were checked by field observations (Habes et al., 2014).
2.2.2. Case Rivierenbuurt
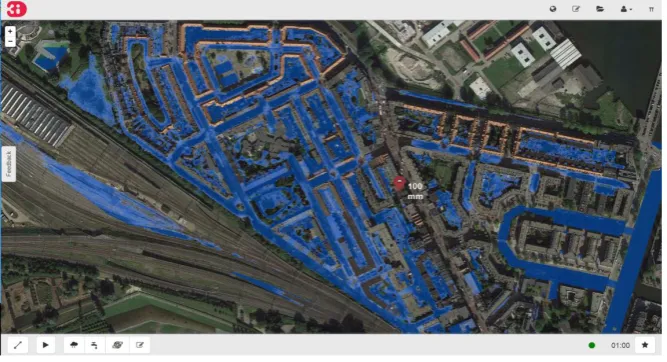
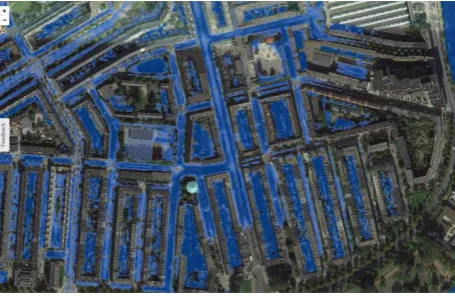
[image:19.595.185.413.597.745.2]The case Rivierenbuurt focuses on the Rijnstraat and surrounding streets. The problem is the water management on the Rijnstraat. Water from the higher southern part of the Rijnstraat flows to the lower part of the Rijnstraat (north wise). The Rijnstraat is enclosed by buildings on two sides, except some small side roads. It is expected that the street and the surrounding streets will flood by extreme rainfall events. The case will focus on the Rijnstraat because constructions works will be executed between 2014 and 2016 on the south side of the Rijnstraat. The road design will be changed, detached cycle roads will be constructed, thresholds will be placed and the tramway will be removed. At the same time cables and pipes will be reconstructed (“Rijnstraat-Zuid - Stadsdeel Zuid,” n.d.). The effect of a 100 mm rainfall event in one hour is presented in 3Di in Figure 8.
The Rivierenbuurt is a district in Amsterdam Zuid. The main part of the area has been build between 1920 and 1940 for the middle or upper class people. The architect was H.P. Berlage and the areas has been build thus in the style of the Amsterdamse School. This style results in a lot of stone, both in buildings and pavements, and semi-high buildings with a large surface area. Only a small part of the area is green, the largest part is paved.
3Di can be helpful in identifying and quantifying the possibilities of storm water solutions in the road design. The road design has already been finished, but still small changes can be made. The 3Di workshop can also be an eye-opener for the participants about the integration of Rainproof thinking in the design process. Even when the design of the road cannot change enough to perform as an ideal design for storm water management, the workshop can improve future projects by awareness raising.
2.2.3. Case Houtmankade
[image:20.595.126.467.400.580.2]The Houtmankade is a road on a quay in Amsterdam. The case Houtmankade focuses on the district north-west of the Houtmankade, the Spaarndammerbuurt, located in district Amsterdam West. There is only surface water at the east-side of the area, so storm water cannot flow from the lower parts to this. Besides that, the area is located low relative to the surroundings and dykes around. The situation after a rainfall event of 100 mm in an hour is presented in Figure 9. Together with planned construction works, flooding measures can be taken in the coming years. Construction works on the Houtmankade will start at the end of 2014. The road will be renewed, both the foundation and the surface. At the same time the road will be redesigned (Gemeente Amsterdam, 2013). A new road design has already been made, but some adaptations can still be made. The design of the Houtmankade might influence the flooding in the area.
Figure 9: Houtmankade (right) and Spaarndammerbuurt after a rainfall event of 100 mm in 1 hour
2.3.
Measurement method decision quality
Drawing conclusions about the improvement of decision quality by a model requires a comparison between two situations. The difference between the two situations identifies the possible improvement or deterioration. The difference will be measured in a workshop. A quantification of elements of decision quality is necessary for measurement.
2.3.1. Decision quality from literature
The literature describes many different definitions (or measurement methods) of decision quality. Decision quality is defined as the opinion of the decision-makers about their satisfaction with the final decision (Wilson & Arvai, 2006). Decision quality as both the quality of analysis and the commitment to action is used by many authors (Howard, 1988; Mcnamee & Celona, 2008). Most authors make a distinction between six elements of decision quality and some authors divide these further in sub-elements. The six main elements (see Figure 10) are similar in different studies, but the sub elements differ (Howard, 1988, 2007; Keisler, 2011; Matheson & Matheson, 1998; Mcnamee & Celona, 2008). The following framework combines the authors’ sub elements:
- Decision framing
o Clarity of the purpose
o Definability of the scope
o Consciousness of perspectives
- Alternatives
o Creativity and diversity of alternatives
o Level of detail of alternatives
o Achievability of alternatives
o Coherence of alternatives
- Information
o Availability of information
o Clarity of information
o Correctness and explicitness of information
o Awareness of uncertainty of information
- Values, clearness of preferences of values - Logic
o Logic of reasoning
o Understanding of consequences of alternatives
[image:21.595.219.391.459.628.2]- Commitment to action
Figure 10: Decision quality framework (Matheson & Matheson, 1998)
agents and decision-making in storm water projects is the decision maker and the consumer role. The recommendation agent is the decision maker, and the decision is made for the consumer. The decision maker in a storm water project is the consumer, the model contributes to the decision-making process, but is not decision-making the decision.
Hazelrigg (2003) compares different methods for design selection (as matrixes and six sigma) by identifying favorable properties of the methods. He uses partially the same criteria for decision quality but does not divide them in six main issues. The favorable properties focus on the output of the tools and are not applicable for this research because the 3Di system does not automatically give a ‘best’ option.
Much research about decision quality is done for health care, this is a slightly different view on decision quality because it is about the preferences of the client. Decision quality is here defined as ‘The consistency of the individual’s decision with their values, satisfaction with decision, participation in decision-making and patient-clinician communication’ (Shared Decision Making Programme, 2012). The only input for the decision quality is the opinion of the patient. Elements of decision quality in health care are for example the ability of communication of questions, concerns and preferences and the provision of information (Fraenkel et al., 2011).
Decision-making process quality is also assessed in a military sense making process. Military sense making are all the cognitive and social processes that are involved in military command and control. Research of Jensen (2007) uses a workshop to identify the quality of the process. He measured the process quality by observation of a team’s planning session. Military experts rated the plan quality using predefined criteria. Remarkable was that the plan quality results of the workshop were not different from the process quality result, so the same result was obtained for measuring process quality as plan quality (Jensen, 2007).
2.3.2. Conceptualization decision quality elements
This research incorporates the decision process without costs. Besides that, not all decision quality elements as described before are tested. Only the elements that can be affected by models are used, what makes the research easier and less extensive. The selection is made by analyzing which elements are affected by other models (the models described in section 1.4.3), Appendix A describes the argumentation for the choice. The results of this analysis is that the elements clarity of the purpose, definability of the scope, values and logic of reasoning are excluded from the research.
An overview of interpretation and measurement methods discussed in literature is given in this section for the used decision quality elements. Some decision quality measuring methods from recommendation agents from Aksoy et al. (2011) (see the previous section) are used in this study, the field of research is very different, but measuring methods can be similar. The same concerns military sense making and studies in health care.
Decision framing - The consciousness of perspectives
Framing refers to the understanding what has to be decided and why (Keisler, 2011). The consciousness of perspectives refers to the perspective of all decision makers together, do the decision makers see the full set of data and do they appreciate the issues and concerns of the other decision makers? (Mcnamee & Celona, 2008). Davern et al. (2008) state that the decision quality is higher when all relevant issues are taken into account. If, for example, the inhabitants of the area are not taken into account in the decision, the decision quality will probably be lower.
2006). In military sense making theory, a full treatment of all issues is also an important criterion for process quality. The concerned issues were compared in the study with the full list of issues determined beforehand (Jensen, 2007). This is not possible in this study, because the full list of issues is unknown beforehand.
Alternatives
In a decision-making process, the set of alternatives is defined during the preparation of the workshops. During the workshops alternatives can be changed when an interactive model (as the 3Di system) is used, the effects of the new alternative can be directly included. This element is not affected by other models (as the D-PHASE program), because alternatives cannot easily be changed during the workshops. Alternatives can be influenced by the functionalities of a model; if something is not possible in a model it can also not be part of the alternative (Hazelrigg, 2003).
Alternatives – Creativity and diversity of alternatives
The quality of the alternatives limits the decision quality; the decision process cannot be of high quality if some solutions are not considered. Mcnamee & Celona (2008) define the creativeness of alternatives as how much they differ from the normal situation. The alternatives should also differ enough between themselves and should include the total range of possible solutions (Mcnamee & Celona, 2008).
Alternatives – Level of detail of alternatives
Mcnamee & Celona (2008) define the level of detail of an alternative as if all details are included in the description of the alternative. The highest score is obtained if the alternative can be implemented directly, without further research.
Alternatives – Coherence of alternatives
The final decision of a decision-making process consists often of different smaller solutions. The coherence of an alternative is described by Mcnamee & Celona (2008) as if the elements of the alternative are a good combination. Leskens et al. (2013) state that alternatives may become less coherent when an interactive water simulation model as 3Di is used, because the process becomes a trial-and-error process. A strategy will lead to a higher chance of implementation. In the urban stormwater management program SWITCH, executed in several cities, a coherent and integrated approach is one of the goals for the future (Ellis et al., 2009; Jefferies & Duffy, 2011).
Information
The use of a model in the decision process will affect the amount of available data because the data is available through a model. The model determines therefore the availability of data. Information is the data supplied by the model or other ways of input (as handouts).
Information – Availability of information
Some studies state that more information results in higher quality, while other state that too much information decreases the quality. Hazelrigg (2003) states that better information for the decision always leads to better decision-making (what will not lead necessarily to a better decision). But others state that if data is not appropriate selected, many time has to be spend on analyzing inappropriate available data or searching for necessary data (Mcnamee & Celona, 2008). Speier (2006) concluded that a high amount of information usually increases the complexity of a task or decision, what can limit the accuracy of the decision. The availability of information is defined as the degree in which specific values are included in the data collection (Ge & Helfert, 2006).
does not change decision quality. Hwang & Lin (1999) describe that the relation between information load and information processing is an inverted U curve, with less information less information is processed, with average information much information is processed and with much information again less information is processed. The information processing is seen as positively related to decision quality, so the relation between decision quality and decision load is also an U curve (Hwang & Lin, 1999).
Information – Clarity of information
More clarity of information and thereby understanding of the data will lead to a higher decision quality. To obtain a higher decision quality, the right presentation of information is needed and the representation should match the problem or task to perform (Speier, 2006). The information should be structured so everything can be understood and can be found easily. Arciniegas et al. (2013) define the clarity of information as the ability of users to understand the information. The design or the used models are not inevitably related to this.
The clarity of the information is mostly measured in other research by interviews and amount of use of the tool. Janssen and Uran (2003) measured the clarity of information with interviews, they compare the use of a map, graphs, tables and text. Subjects of the interviews were the preferred visualization of data and communication, as level of detail and difficulty. Janssen and Uran (2003) conclude that maps are the most preferred type of information presentation, but also other types of presentation should be available for those who are not willing to use maps. For the analysis of a negotiation support tool in the Netherlands, workshops were held, after each workshop questionnaires were completed about the understanding and the information involved (Goosen et al., 2007). The clarity of information is measured in one study by the intensity of tool use, the time using the tool, the group strategy and the performance conflict (Arciniegas et al., 2013). Sidlar & Rinner (2009) did an experiment in which the degree of success of a tool was calculated as the utility ratio, the actual use of the tool divided by the potential use. Arciniegas et al. (2013) use the degree of consensus or the match between user needs and the tool as method. They state that the usefulness can be measured by the group multi-criteria analysis and a test of the subjects understanding (Arciniegas et al., 2013).
Information – Correctness and explicitness of information
Mcnamee & Celona (2008) use the element correctness and explicitness of information. The quality score is high when the information is correct and detailed, low when vague adjectives are given. They include the reliability of the source in this element. Correctness and explicitness is by some authors defined as the only aspects of information quality. Ge & Helfert (2006) measure the information quality by its accuracy and state that this information quality is the key determinant of decision quality. Raghunathan (1999) supports this view partly, he measured the information quality as well only by accuracy, but recognizes that information quality is multi-dimensional.
Information – Awareness of uncertainty of information
Logic
The logic of the decision is split in two parts following the framework of Mcnamee & Celona (2008). One part is the logic of the reasoning, what decision is made and why? The second part is the understanding of consequences of alternatives, what consequences are assigned to the alternatives and why? Using a model can affect the logic of the decision because new insights can be obtained from this model.
Logic – Logic of reasoning
Keisler (2011) defines the element logic as a combination of information, values and alternatives consistent with the preferences of the decision makers. Hazelrigg (2003) states that a clear reasoning can only be obtained when it is not contradicting itself and is using the maximum of available information. The decision should be consistent with the given data, alternatives and preferences. Decision makers are using often devices as decision trees to ensure clear reasoning (Keisler, 2011). Mcnamee & Celona (2008) measure a clear reasoning by whether it can be explained to an intelligent outsider. The reasoning should be possible to understand by someone that has not made the decision. Mcnamee & Celona (2008) use intuition as well as criterion for reasoning, the score for clearly reasoning is lowest when each decision maker only relies on his intuition.
Logic – Understanding of consequences of alternatives
The reasoning can be clear even when the consequences of alternatives are not fully known. In that case the decision is not optimal because effects can be ignored (Mcnamee & Celona, 2008). The consequences of alternatives have to be logically included in the decision. The value of alternatives for each decision criterion should be known to make a good decision (Mcnamee & Celona, 2008). However, this is only obligatory when a Multiple Criteria Analysis is used.
Commitment to action or implementation
Mcnamee & Celona (2008) state that the commitment to action or implementation mainly depends on the enthusiasm of the stakeholders, are they motivated? Motivation follows from involvement and insight in the total process according to them. Authors use different criterion to measure enthusiasm or motivation. Aksoy et al. (2011) use the ‘choice liking’, the interest in the choice. Jensen (2007) links the agreement of the decision makers with the decision to commitment. Yates, Veinott & Patalano (2003) use satisfaction as a criterion. Different methods are used in other studies to measure the enthusiasm and agreement. Mcnamee & Celona (2008) measure the degree of understanding of all decision aspects by the decision makers and their involvement in the decision. Others measure the satisfaction of decision makers with the final decision (Aksoy et al., 2011; Yates et al., 2003). Jensen (2007) uses the degree of agreement with the decision by the individual decision makers, is the decision seen as the best possible option? Jensen (2007) uses as well a value for how often decision makers express their disagreement during the process. Consensus is unanimous agreement of decision-makers in a process, this is not fully possible in a decision-making process, but can be partly obtained (Boroushaki & Malczewski, 2010). Many authors use quantifiable values as measurement method for consensus. Boroushaki & Malczewski (2010) use scores of a Multiple Criteria Analysis gathered during a workshop to measure the degree of consensus. They compare the individual scores for the solutions with the group scores. The MCA was individually so the weights for criteria were assessed individually too. Bender & Simonovic (1997) use almost the same method, they include values as the highest discrepancy and pair wise coincidence.
2.3.3. Operationalization decision quality elements
Helfert (2006) use relations for the accuracy and availability of information. They know the total number of data items possible and can draw conclusions from this. The measurement methods for the decision quality elements are given in the following sections.
Decision framing - The consciousness of perspectives
The consciousness of the participant’s perspective is measured by the number of aspects they involve in the decision-making. In addition, it is checked if these aspects are equal between the decision makers. If participants mention much of the same aspects, the quality is higher. Aspects are defined as subjects that should be incorporated in the decision, as inhabitants or traffic. The aspects are collected by asking the participants to list them. Participant used different terms for equal aspects, so these aspects are categorized. The used categories and aspects can be found in Appendix F.2. The total collection of relevant aspects is not known; it is therefore difficult to compare different cases. The comparison with the reference situation is made by asking the participants if they have involved more issues than in their normal situation.
Alternatives – Creativity and diversity of alternatives
Creativeness and difference of the alternatives are rated as one element. Creativeness is how inventive or original the alternatives are. Significantly different is how much the alternatives vary between each other. This element is measured by the number of alternatives made up during the workshops, the differences between them and the differences with the given alternatives. Alternatives are seen as more different if they focus on different locations and different kind of solutions (as storage versus draining). The creativeness is determined by the difference with the given alternatives. The comparison-score is obtained by asking if participants considered more alternatives by using 3Di instead of their reference situation. It is expected that the creativity and diversity of alternatives is higher if more alternatives are considered.
Alternatives – Level of detail of alternatives
A value for this element is assigned by how much detail is added to the alternatives during the workshops. Adding more detail means a higher quality. This is measured by asking the participants in the questionnaire how much detail they have added to the alternatives. As comparison participants are asked if they could elaborate alternatives more detailed with 3Di than in their reference situation.
Alternatives – Coherence of alternatives
The coherence of alternatives is measured by presence or absence of strategy between the sub-solutions. The sub-solutions are parts of the final solutions that are tried during the workshops. Participants were asked if they see a strategy between the sub-solutions. Besides that, the final solutions are analyzed, these can be found in appendix F.2. The quality is higher if the different measures in the final solution are cohesive. Sub-solutions are cohesive if the same range of solutions is used, for example if green roofs are used at different locations or if different sub-solutions strengthen each other. An alternative is non-cohesive if it contains different methods, as green roofs, a threshold and permeable streets. Besides this measurement method, for comparison with the reference situation, participants are asked if it is easier to apply a strategy with 3Di.
Information – Availability of information
Information – Clarity of information
The clarity of the model information is measured by the time necessary and difficulty to find the right information. The time needed reflects the usability of the model, the time will be short with a good structure. Besides that, clarity will lead to an easy to use model; users know where they have to find information. These two aspects are measured in the questionnaire by asking participants about their opinion of the time and difficulty. This is done for both the quality of 3Di and the comparison with the reference situation.
Information – Correctness and explicitness of information
The quality of the data is defined as the correctness and explicitness of the data. These aspects make up one sub element because correctness of data is meaningless if the data is not detailed. The explicitness of the information will be obtained by the opinion of the decision makers. How do they perceive the explicitness of the information, it is detailed enough? This is different from the availability of information because this is about the amount of data (categories and location). The correctness is measured by the opinion of the participants about the correctness. It could have been done objectively but that would have been very time-consuming. It is not the objective of this research to determine the accuracy and correctness of the information or models. It is stated by the producers that 3Di is simulating the real world quite correctly (Consortium 3Di Waterbeheer, 2014). This element is measured in the questionnaire by asking the participants about the correctness of and details in the information.
Information – Awareness of uncertainty of information
The awareness of uncertainty of information is measured by the perception participants have of the uncertainty of the model. The quality of 3Di for this criterion is only determined by participants’ opinion about the veracity of 3Di. This should be compared with the real veracity, unfortunately this is not possible. This element is therefore not presenting a score for the awareness of uncertainty. The comparison-score is determined by comparing the results of two questionnaire questions. The first question is about their knowledge of the veracity of the reference situation. The other question is about their knowledge of veracity of 3Di, by asking how well they felt informed about this. The score is high if the first question got a lower rate than the second.
The information given during the workshops is influencing the awareness of uncertainty. The uncertainty was therefore not explained in detail during the presentation about 3Di. The accuracy of the calculation method of 3Di was mentioned and the inclusion of different modules (as ground water and sewerage). The 3Di system is not finished what can lead to additional critique about the correctness. The lack of the sewage module was therefore shortly mentioned during the presentation at the start of the workshops. The lack of the sewage model is not expected to influence the model results a lot, because an additional interception layer simulated sewage in the model. This was also explained during the workshops, so the opinion of the participants will be affected only a little.
Logic – Logic of reasoning
Logic – Understanding of consequences of alternatives
The logic in a decision is higher if alternatives can better be compared, so if the consequences of the alternatives are better known. This can be measured objectively when a Multiple Criteria Analysis (MCA) is used, due to the quantitative scoring. Nevertheless, no MCA is used in the reference situation, so is not used in the workshops. The opinions about the understanding of the consequences are thus asked in the questionnaire. The consequences are divided in water hindrance and other consequences, because it is expected that only the knowledge of consequences for water would change by 3Di.
Commitment to action or implementation
The commitment is measured by the satisfaction with the final decision and the degree of agreement between the decision makers. Participants were asked about their satisfaction with the final decision in the questionnaire. Besides that, they were asked about the alternative they would have chosen as final decision. A comparison can be made between the individual’s best solution and the group’s best solution to determine the degree of agreement.
2.4.
Interviews
Interviews are held for three reasons. First, the limited written information about urban storm water management projects and the decision-making in these projects. Secondly, additional knowledge about the cases can improve the quality of the workshops and questionnaire. Thirdly, the validity of the study will be higher because information can be checked at different sources. In total, nine interviews are held, summaries of the interviews can be found in Appendix B. Besides the interviews, several discussions and meetings with co-organizing people of the workshops from Waternet have been held. One interview was held about the use of 3Di in Watergraafsmeer. One interview was about the general use of models for urban water problems (specified on Apeldoorn) and WOLK. Three interviews with participants of other water projects that are not focusing on water management but on the integration of water management were held, these projects are executed in Rotterdam (Waterplein Rotterdam), Zwolle (klimaatdijk) and Purmerend. Three interviews were held as preparation for the Rivierenbuurt workshop, one with an asset management strategy developer from Waternet, one with a project manager Rijnstraat of the district council and one with the public space manager of the Rivierenbuurt of the district council. In preparation of the Houtmankade workshop an interview was held with a project manager of the district council Amsterdam West.
The interviews were semi-structured. The interviewer used a standard list with topics and questions of interest to check if all subjects were discussed. Only applicable questions were discussed during the interview. For instance, if the interviewee was not using a water simulation model, questions about this could be skipped. Sound recording of the interviews was done to improve the correctness of the interview report. The interviewees checked the report afterwards on correctness and gave approval of publication in the report.