A Thesis Submitted for the Degree of PhD at the University of Warwick
http://go.warwick.ac.uk/wrap/73131
This thesis is made available online and is protected by original copyright. Please scroll down to view the document itself.
OF HALO-BORATE GLASSES AND GLASS-CERAMICS
by
Phe1im B. Danie1s·B.A.
A Thesis
Submitted for the Degree of Doctor of Philosophy
of the
University of Warwick
Department of Physics
,-- , '," ~ ... ,
..
IMAGING SERVICES NORTH
Boston Spa, WetherbyWest Yorkshire, LS23 7BQ www.bl.uk
BEST COpy AVAILABLE.
'.
IMAGING SERVICES NORTH
, Boston Spa, Wetherby West Yorkshire, LS23 7BQ www.bl.uk
BEST COpy AVAILABLE.
TEXT IN ORIGINAL IS
CLOSE TO THE EDGE OF
CHAPTER 1: 1.1 1.2 1.3 1.4 1.5
CHAPTER 2: 2.1 2.2 2.3 2.4 2.5 2.6 2.7 Introduction
The Nature of Glass
Conversion to Glass-Ceramics
1.2.1 Nucleation
1.2.2 Crystal Growth
Origins of the Project and Possible Applic.a tions
Aims for Advancement Thesis Plan
Electrical Conductivity Processes in Glasses, Glass-Ceramics and Ceramics
General Comments
Electronic Conductivity Amorphous Semiconductors Ionic Conductivity Theory
Ionic Conductivity Theory Applied to Glasses
The Nature of the Activation Energy Ionically Conducting Glasses
2.7.1 Binary Alkali Silicates
2.7.2
Binary Alkali Borates2.7.3 The Mixed Alkali Effect
2.7.4
Glasses Containing Halogens 1. Borates2. Phosphates
3.
Molybdates2.7.5
Fluoride Ion Conducting Glasses2.7.6
Alkali-Free Glasses2.8 Ionica1ly Conducting Glass-Ceramics 2.9 Ionica1ly Conducting Ceramics
2.9.1 Alkali-Metal Ion Conducting Ceramics
2.9.2 Silver/Copper Ion Conducting Ceramics
2.9.3 Anion Conducting Ceramics
CHAPTER 3: Materials Preparation and Allied Topics 3.1 Choice of Compositions
3.2 Preparation of the Glasses . 3·3 Thermal Analysis Techniques
3·3.1 Differential Scanning Calorimetry 3.3.2 Differential Thermal Analysis 3.4 Heat Treatments
3.4.1 Estimation of the Anne'a1ing Temperature
3.4.2 The Re-Crystallisatio~ Process
CHAPTER 4: Experimental Techniques Electrical Conductivity
4.1.1 Connections to the Specimen and Arrangement within the Furnace 4.1.2 D.C. Circuitry
4.1.3 A.C. Circuitry
4.1.4 Results for Standard Glasses X-Ray Diffraction
Electron Microscopy
4.3.1 General Observations 4.3.2 The Use of E.D.A.X.
4.4
Triple-Disc Experiments4.5
Thermopower Experiments 4.6 Infra-Red Absorption4.7 Nuclear Magnetic Resonance (N.M.R.) 4.7.1 Aims
4.7.2 Theory
4.7.3 Boron Studies 4.7.4 Sodium Studies
4.8
Density MeasurementsCHAPTER 5: Resu1t§ tor Electrical Conductiv1tI and Related Topics
5.1 Electrical Conductivity
5.1.1 Glassy Materials Based on Anhydrous Borax
5.1.2 Glass-Ceramics Based on Anhydrous Borax·
5·1.3 Alkali-free Borates 5·1.4 Electronic Conductivity 5.1 •
.5
Further Comments5.2 Determination of the Relative Resistivity
ot the Crystalline and Glassy Phases in the Glass-Ceramic Materials
'5.3 Thermopower Experiments
5.4
Triple-Disc ExperimentsCHAPTER 6: Results for structural Investigational Techniques
6.1 X-Ray Diffraction
6.1.1 studies on Glassy Materials 6.1.2 Studies on the Re-Crystal1ised
6.2
Electron Microscopy6.3
Infra-Red Absorption Measurements6.4
N.M.R. studies6.4.1
studies on the Boron Nucleus6.4.2
studies on the Sodium Nucleus6.5
Density MeasurementsCHAPTER
7:
~~scu§s1Qn0'
the 'Resultsang of Po§sible Explanations7.1
Initial Comment7.2
Glassy Materials7·3
Glass-CeramicsCHAPTER
8:
Final Overview8.1
8.2
Achievements and Conclusions Suggestions for Future Work
References
123
126
136
136
141
145
.148
148
162
179
181
Figure No. Follows Pa~ 1.1 Variation of Nucleation Rate and
Growth Rate with Temperature 11 2.1 Change of Potential with Position 25 2.2 Typical Conductivity vs. Temperature
Relationship for a Crystal 29
3.1 - 3.4
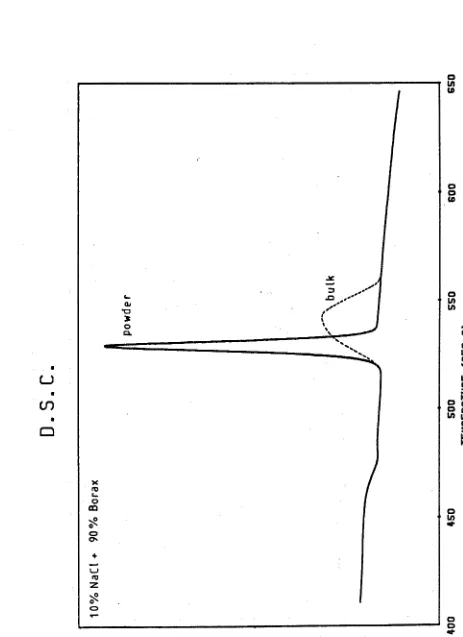
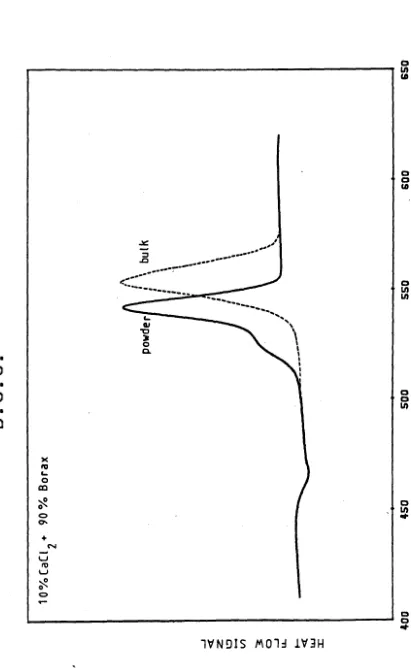
Specimen Differential ScanningCalorimetry Curves 60
3.5
Specimen Differential ThermalAnalysis Curve 61
3.6
Photograph illustrating the Effect of Heat Treatment Dwell Temperatureon Crystallisation
63
3.7 - 3.10 Photographs illustrating the
Dependence of Heat Treatment Dwell Time and Composition on
Crystallisation for the system
X NaCl + (100 - X) Borax
64
3.11 Photograph illustrating the Dependence
of Grain Size on Composition
64
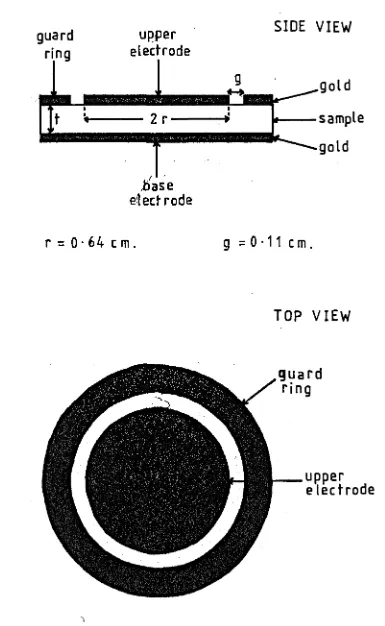
4.1
Electrode Arrangement for Connectionto the Specimens 65
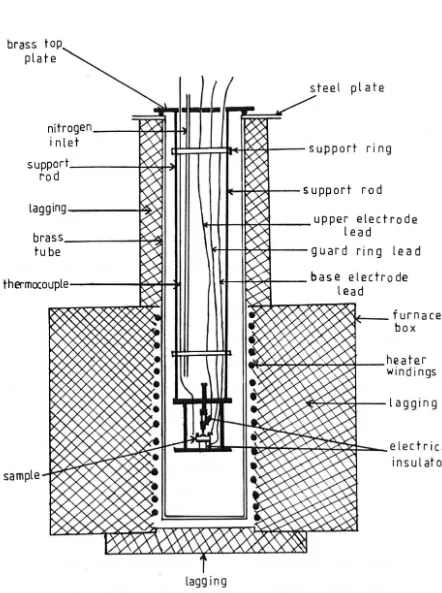
4.2 Furnace Arrangement for Resistivity
Measurements 65
4.3
Resistivity Measuring Circuit forD.C. Mode 67
4.4
Block Diagram of the ResistivityMeasuring Circuit for A.C. Mode
68
4.5
Circuit Diagram of the Filter usedin the A.C. Resistivity Measuring
Circuit
68
4.6
Resistivity Results for Pilkington's Float Glass together with StandardData 70
4.7
Resistivity Results for Pure BoraxGlass together with Standard Data 70
4.8
Schematic Diagram of the 'Triple-Disc'4.9
4.10, 4.11
5.1 5.3 5.4 5.9 5.10 5.11 5.12 5.14 5.15 5.16
5.17, 5.18
Diagram of the 'Triple-Disc' Apparatus
Typical N.M.R. Spectra for a Nucleus with Spin 3/2 in Crystalline and Glassy Materials
Resistivity Plots: (l~, 2~) CaC12
+ (90%, 80%) Borax (Glasses)
Resistivity Plots: 10% (Ca, Mg)C12 + 90% Borax (Glasses)
Resistivity Plots: 15% (Ba. ca~C12
+ 85% Borax (Glasses)
Resistivity Plots: 10% Ca(C12 , Br2) + 90% Borax (Glasses)
Resistivity Plots: l~ Ca(F2 , I2)
+ 90% Borax (Glasses)
Resistivity Plots: (10%, 20%. 30%) NaCl + (90%. 80%. 70%) Borax -(Glasses)
Resistivity Plot: 8.77% NaCl
+ 7.89% B203 + 83.3% Borax (Glass)
Resistivity Plot: 10% Na(F, Cl, Br) + 90% Borax (Glasses)
Resistivity Plot: 10% ZnC1 2 + 90% Borax (Glass)
Resistivity Plots: 10% MgCl
+ 90% Borax (Air and
Nitrog~n
melts, Glasses)Resistivity Plot: 10% ~C~2 + 90% Borax (Heat Treated)
Resistivity Plot: 10% CaC12 + 90% Borax (Heat Treated)
Resistivity Plot: 15% BaC12
+ 8~ Borax (Heat Treated) Resistivity Plot: 10% NaC1 + 90% Borax (Heat Treated)
Resistivity Plots: (10%, 20%, 30%) HaC1
+ (90%, 80%, 70%) Borax (Heat Treated)
-Resistivity Plots: 10% Na(F, C1, Br)
'\ + 90% Borax (Hea t Trea te d)
[image:10.547.49.501.44.760.2]5.19 Resistivity Plot: 10~~ Borax
(Heat Treated) 101
5.20 Resistivity Plots: (~~, 10%) CaC12
+ (100%, 90%) CaB
407 (Glass and
Heat Treated) 104
5.21 Resistivity Plots: (0%, l~~) SrC12 + (10~~, 90%) SrB
407 (Glass and
Heat Treated) 104
5.22 Resistivity Plots: (~~, l~~) Bae12
+ (10~6, 90%) BaB
407 (Glass and
Hea t Treated) 104
5.23 Resistivity Plot: Repeated Tests on
2~~ NaCl + 80% Borax (Heat Treated) 107 5.24 - 5.27 Photographs concerned with determining
the Relative Resistivity of the Glassy and Re-Crystallised phases in the
Glass-Ceramics using the 'Charging-up'
experiments 109
5.28 - 5.30 E.D.A.X. Analysis of 2~~ NaCl
+ 80% Borax (Heat Treated) used in the
'Triple-Disc' experiments 110
5.31 - 5.33 E.D.A.X. Analysis of 15% BaC12 +
85% Borax (Heat Treated) used in the 6.1, 6.2
6.6
'Triple-Disc' experiments 111
X-Ray Powder Diffraction patterns: 1~6 NaCl + 90% Borax (Glass and Crystalline)
Diffractometer Trace: 20% NaCl
+ 8~~ Borax (Glass, Semi-crystalline, Crystalline)
X-Ray Powder Diffraction Pattern: 10% ZnC1
2 + 90% Borax (Heat Treated) Diffractometer Trace: 10~6 Borax
(Heat Treated)
113
114 114 118 6.8, 6.9 I'iffractometer Traces: (l~~, 30'/0) NaCl
+ (90%, 7~~) Borax (Heat Treated) 118 6.10 Diffractometer Trace: l~~ CaC12 +
9~6 CaB
407 (Heat Treated) 121
6.11, 6.12 Hicrographs: 10% ZnC12 + 90% Borax
(Heat Treated) 123
6.13 6.14 6.15
6.16, 6.17 6.18, 6.19 6.20
6.21
6.22, 6.23
6.24 6.25 6.26 6.27
6.28 - 6.32
6.33
E.D.A.X. Analysis of l~~ ZnC12 +
90% Borax (Heat Treated)
Micrograph: 1~6 ZnC12 + 9~~ Borax (Heat Treated)
Micrograph: 10% CaC12 + 9~~ Borax (Heat Treated)
E.D.A.X. Analysis of l~~ CaC12 +
9~6 Borax (Heat Treated)
Infra-Red Absorption Spectra: 100% Borax (Glass and Wet Glass) Infra-Red Absorption Spectrum: 10% ZnC12 + 90% Borax (Glass) Infra-Red Absorption Spectrum: 2~~ CaC12 + 80% Borax (Glass) Infra-Red Absorption Spectra:
(100%, 20%) MgF2 + (0';6, 80%) Borax (Glass)
Infra-Red Absorption Spectrum: 100;6 Borax (Heat Treated) Infra-Red Absorption Spectrum:
10% ZnC12 + 90% Borax (Heat Treated) Infra-Red Absorption Spectrum:
20% CaC1
2 + 8~6 Borax (Heat Treated) Infra-Red Absorption Spectrum:
20% HgF 2 + 8~~ Borax (Heat Treated) Infra-Red Absorption Spectra:
(0%,
10~~, 10%, 20;'6, 30%) r;aCl +(10O]b, ~!O, 9~!o, 8~~, 7~!o) Borax (Glasses and Heat Treated)
Infra-Red Absorption Spectra: 3500cm-l Water Band in (O;~, 1~~, 20%, 30%) NaCl + (100%, 9~~, 80%,
7~!O) Borax (Glasses)
Infra-Red Absorption Spectra: 10~!o CaB
4
07 (Glass and Heat Treated) Infra-Red Absorption Spectra:10% CaC12 + 90% CaB
4
07 (Glass and Heat Treated)
[image:12.551.54.499.43.727.2]6.39 Boron Nuclear Resonance: 30% NaC1
+ 70% Borax (Glass) 138
6.40, 6.41 Boron Nuclear Resonances: (~~, 30;.6) NaC1
+ (100%, 7~6) Borax (Heat Treated) 138 6.42 - 6.45 Boron Nuclear Resonances: (0%, 10'~) NaC1
+ (100'~, 90%)(20'~ Na~o + 8~6 B203)
(Glass and Heat Trea ed) 138
6.46, 6.47 Sodium Nuclear Resonances:
(O-~, 30%) NaC1 + (100;6, 70%) Borax
(Glasses) 141
6.48, 6.49 Sodium Nuclear Resonances:
(~o, 30%) NaC1 + (100%, 70%) Borax
[image:13.549.43.510.47.782.2]I would like to record my gratitude to the late Prof. P. W. McMillan for his interest, encouragement and general
supervision of this work. His knowledge and eminence within the general field of study has proved invaluable. I am also indebted to him for making the Physics departmental facilities available to me.
There are innumerable academic and technical staff members of the Physics department who have helped me during the course of the experimental work and deserve my thanks. In particular I would like to thank past and present members of the Glass-Ceramics Group including, among others, Dr. Diane Holland, Dr. Nigel Pratten and Dr. Ron Maddison for much advice and discussion, and Mr.
R.
Lamb, Mr. H. Mathers and Mr. J. Stanley for their technical assistance. The comradeship within the group was a tremendous asset throughout the whole period of the work.I am also grateful to Prof. R. Thomson, Dr. J. Farmer, Mr. S. Badzioch, Dr. R. Biddulph and other members of staff of Borax Research Ltd. for many stimulating discussions, for their friendliness on the occasions of my visits to their laboratories and for their collaborative support of the project.
This dissertation is submitted to the University of Warwick in support of my application for admission to the degree of
Doctor of Philosophy. It contains an account of my work carried out principally at the Department of Physics of the University of Warwick during the period October 1980 to September 1983 under the general supervision of the late Professor P. W. McMillan. No part of this dissertation has been used previously in a degree thesis submitted to this or any other university. The work described is the result of my own independent research except where specifically acknowledged in the text.
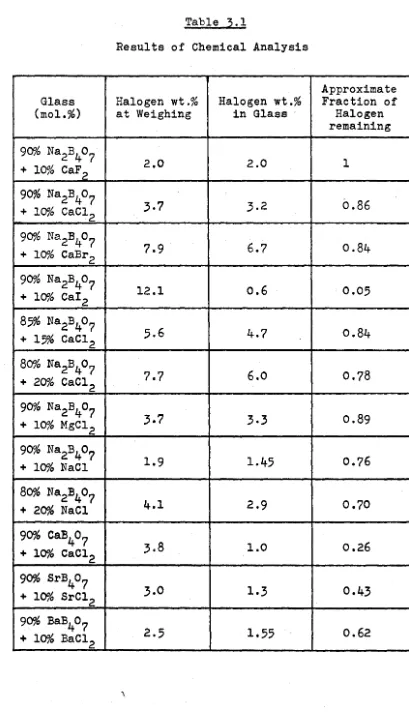
The effect on the electrical properties of doping simple borate materials with various halides has been investigated.
Most of the work concentrates on sodium borate as a base material but an extension is made to also consider alkaline-earth borates. Initially, glassy products are examined but later in the project, because of significant and unexpected trends, attention is focussed on re-crystallised glass-ceramics formed from the original glassy specimens.
Results indicate that a wide range of halides can be used to reduce the inherent resistivity of the initial borate material. The effect occurs in both the glassy and glass-ceramic samples but is most dramatic 'in the latter case. The reduction is of such magnitude that, unusually, the glass-ceramic frequently has a lower resistivity than the parent glass, and some sodium borate based samples can almost be classed as fast-ion conductors.
Any accompanying structural changes were monitored using a range of techniques including X-ray diffraction, infra-red absorption, nuclear magnetic resonance and electron microscopy. These measurements met with varying success though the prominent
finding of each investigation is that the added halide is absorbed into the base compound with remarkably little structural
re-arrangement.
CHAPTER 1 : Introduction. 1.1 The Nature of Glass.
While glass is today one of the most widely used materials, having a host of applications, the nature of its structure is still not understood. Indeed, the first problem encountered is to define exactly what is meant by a 'glass'.
Early work on simple glasses, e.g. by Tammann (1), considered them simply to be 'super-cooled liquids'. The results of
X-ray diffraction experiments on glasses in the early 1920's (2)
showed a lack of long range order. To emphasise this finding the definition consequently changed to 'structureless solids'
though the idea of the glassy state being a direct extension of the liquid state was not totally relinquished
(3,4, 5).
Later a commonly used definition of a glass was that it was "an inorganic product of fusion which has cooled to a rigid condition without crystallising", this definition was put forward by the American Society for Testing Materials in 1949. However, this definition is now thought to be unnecessarily restrictive. Firstly, various organic non-crystalline solids can be prepared which show similar characteristics to inorganic glasses, yet these would not
be included in this definition. Secondly, amorphous materials showing glassy behaviour can be prepared by methods other than fusion e.g. vapour deposition or neutron bombardment.
In more modern definitions it is again the non-crystalline nature, or at least the lack of long range order, that is
of which is greater than about 1014 poise".
The fact that the definition of a glass has been subject to alteration indicates that considerable advances have been made in the level of understanding of glass structure.
Originally efforts could only concentrate on observation of physical properties e.g. by Lebedev (7) in 1921, who
expressed the opinion that glass consisted of highly dispersed small crystals whose presence could perhaps be investigated by X-rays. Some of the earliest X-ray structural analysis on glass was undertaken by Randall et al (8) on vitreous silica.. The main conclusion arrived at in this work was that the
observed diffraction pattern resulted from a structure of very small cristobalite crystals, of around 15
i
in size.However, Zachariasen (9) disagreed with this because of discrepancies in the expected and observed densities, the physical property behaviour and the failure of the model
to account for the diffraction pattern of heat-treated samples. Instead,Zachariasen put forward a model which states that the linking of atoms is essentially the same for the glassy and crystalline form of a material and that both forms contain extended networks. However, the difference between the two systems is that the glassy network lacks periodicity and is not symmetric but is instead of a more random nature.
3.
For these oxide glasses it is postulated that two types of oxygen ion exists, those bonded to two polyhedra, bridging oxygens, and those bonded to only one polyhedron, non-bridging oxygens. The cations are then thought to exist in holes
between the oxygen polyhedra where their charge neutralises the excess negative charge of the non-bridging oxygen ions. Oxides directly involved in the structural network are termed network formers, and those whose ions tend to fill an
interstitial role are termed modifiers. Some oxides can not be directly classified and can play a dual role dependent on the circumstances and are therefore termed intermediate.
General support for these ideas came from the X-ray results of Warren and associated workers (11-19), though Warren pointed out that Zachariasen's model was not the only possible interpretation of his findings. Nevertheless the two sets of work are frequently combined as providing the
'random network model'.
An early ~riticism of Zachariasen's work came from
Hagg (20) in 1935, who objected to the need for a continuous 3-dimensiona1 network to be present. He thought that glass formation was due to the presence of large, complex anions in the me1t,which are strongly bound. It was argued that these would be difficult to assimilate into a regular lattice and hence there would be a tendency towards supercooling and glass formation.
Solomin (21) in
1940,
and Tarasov and co-workers in later years (22, 23), when considering the structure of vitreous silica suggest the presence of molecular chains or even\
4.
Zacharias en model, accepts the possibility of silicon-oxygen tetrahedra being joined along their edges. Richter et al (24) come to a similar conclusion and these general ideas are
supported by Stevels (25). An interesting observation, which can be considered to uphold this line of theory, comes from Bruckener (26). He finds an assymetry in the density of
vitreous silica fibres, with the density in the radial direction being greater than that in the axial direction. He assumes
this to be due to the orientation of the chains along the axis of the fibres. These general ideas of the presence of
cross-linked chains are commonly referred to as the polymeric hypothesis.
Huggens, Sun and Silverman (27), again concentrating on silica, pointed to the fact that different molecular structures exist in the various crystalline silicate minerals. There are semi-infinite sheets in mica, semi-infinite chains in pyroxenes and rings in wollastonite. They considered that vitreous
silica was made up of a mixture of these units, the fraction of each ,type,being dependent on composition. Similarly, Van Wazer (28) believes in the presence of rings and chains in the structure of phosphate glasses.
In place of these units Bockris and co-workers (29,
30)
and Fajans and Barber
(31)
consider a 'discrete ion' concept in which distinct, large but not infinite molecular groups are present in glass, with the physical properties being controlled by the type of ion that is predominating at a particular composition.Kobeko (32), in a completely different approach,
5.
being present in the super-cooled liquid than in the more usual liquid. This new structure then becomes fixed on
vitrification. This is often referred to as the 'hypothesis of short range order'.
Another theory to appear is the 'micro-homogeneity' theory, which is mostly the result of work by Porai-Koschitz and co-workers
(33-35).
Using mainly X-ray diffraction data attempts are made to illustrate the presence ,of micro-regions of varying composition. For example, binary silicates were thought to consist of regions with a sodium meta-silicatecomposition surrounded by vitreous silica. Notably, no attempt was made to explain the structure of the inherent vitreous
silica.
Apart from direct structural theories various authors have put forward ideas regarding the nature of the chemical bonding necessary if glass formation is to take place.
Sun (4) assumes that there is a greater tendency towards glass formation if the atomic bonds are very strong. Simplistically his line of thought is that on solidification it is more.
difficult for the atoms to rearrange into a crystalline form if the bonds in the liquid are strong.
Smekal
(36)
puts the emphasis on the actual type of bond. He believes that a mixed bond is desirable for glass formation, i.e. one which is neither purely covalent nor purely ionic. He argues that covalent bonds are too directional for the required random nature to be achieved, and that ionic bonds are so non-directional that it is easy for the atoms to alignthemselves on freezing, hence an intermediate bond is necessary.
h
•
recognises the fact that the formation of such bonds is due to the particular difference in the electronegativities of
the atoms concerned. Hence, it is his view that glass formation would be favoured if the difference in electronegativity of the constituent atoms lies within a certain range.
In general these bond theory predictions are in quite good agreement with what is found in practice. However, invariably there are exceptions to the general case and the predictions cannot be applied with a great deal of reliability. Similar comments can be made on the structural theories mentioned earlier; each theory can seem to be applicable in certain
cases, but not to be applicable in certain other cases. Given the wide range of materials that form glasses it is highly probable that no one theory can apply universally. Indeed, even for a particular multicomponent system,the structure, and the theory pertaining to it, may change considerably as the composition within the overall system is varied.
1.2 Conversion to Glass-Ceramics.
The re-crystallisation of a glass into a glass-ceramic is somewhat analagous to the crystallisation of a melt on
cooling. Crystallisation does not occur uniformly and
simultaneously throughout the material, rather it occurs on certain sites, called nuclei, which tend to grow in size until much or all of the original material has become crystalline.
It is thus possible to consider crystallisation as consisting of two processes. Firstly, there is the formation of the
growth sites i.e. nucleation, and secQndly there is the growth of these sites. The kinetics governing these two processes
,
combined effect. Only a brief account of the processes is given here, since thorough, detailed accounts have been written by many other authors (e.g. 38-45).
1.2.1 Nucleation.
Nucleation can be of two types. If nucleation occurs in a pure phase, and the probability of it occuring is independent of position within that phase, then the phenomenon is called homogeneous nucleation. If nucleation occurs at the interface with a foreign particle, which would serve to catalyse the nucleation, then the phenomenon is called heterogeneous nucleation. Homogeneous nucleation will be discussed first.
Consider cooling a liquid to its 'melting point', Tm" At this temperature the free energy of the liquid is equal to that of the crystalline solid. On cooling below Tm the free energy of the liquid is higher than that of the solid and there is a tendency for nucleation to occur. However, the formation of nuclei necessitates the building of a solid/liquid interface which itself needs energy to achieve. Hence, it is generally the case that some degree of supercooling is necessary before it is favourable for nuclei to form.
It can be shown (40, 44, 46-49) that the rate of formation of nuclei per unit volume of liquid, I, is given by:
I
=
nf .exp(-l6A1iG~2)
exp( -GR )3RTG~
RT
where:
n is the number of particles per unit volume,
f is the frequency of vibration of particles at the crystal/liquid interface,
"
GB is the bulk free energy of crystallisation, G
S is the free energy per unit surface area of the crystal/liquid interface,
V is the molar volume,
GR is the energy concerned with the re-arrangement of
the liquid particles into the correct crystal structure. In essence, the first exponential factor describes the 'thermodynamic barrier' to nucleation, while the second exponential factor is concerned with the 'kinetic barrier':
Consider the case when the temperature is ~T below the melting point. The entropy of fusion, ~S, which is assumed
to be independent of temperature, is related to the change in GB with temperature by:
-AS
=
d (G B)dT
However, the second law of thermodynamics shows (e.g. 50)
that ~S is equated to the latent heat of melting, L, by:
AS
=Hence
It follows that the equation for the nucleation rate can be written as:
I
=
nf .exp (-16A1TG~rr;)
exp(-G
R) 3RTL 2Ai!. RTIt will be noted that the nucleation rate is highly sensitive to the degree of supercooling due to the 6.T2 term in the exponent.
been reached and does not include initial transient effects. -If the melt is seeded then heterogeneous nucleation can take place, which will always tend to decrease the degree of supercooling that is necessary before nucleation begins. It must be recognised that pure homogeneous nucleation is rather difficult to achieve, there are always trace impurities
available, or even the walls of the liquid container will suffice.
The effectiveness of such a seed, or nucleating agent, depends very much on the resemblance of the lattice spacings of the inhomogeneity with respect to those of the phase being crystallised. The smaller the degree of disregistry then the greater the tendency to nucleate. It is for this reason that the best nucleating agent is an unme1ted seed crystal of the liquid in question, or a similar isomorphous crystal.
The important factor in heterogeneous nucleation lies in the surface tension between the inhomogeneity and the
nucleated phase. If this is low then heterogeneous nucleation is favoured. A manifestation of this surface tension lies in the contact angle,
e ,
at the junction of the inhomogeneity and the nucleated phase. It is possible to adjust the'thermodynamic barrier' exponent by multiplying it by a function f(9), in order to convert the resultant nucleation rate to be that concerned with heterogeneous nucleation. fee) is given by (see 45):
f(8) = (2 + cost)(l - Cose)2/4
For any value of (00
<
9<1800) the thermodynamic barrieris reduced and nucleation will occur more easily than in the
\
1.2.2 CrYstal Growth.
The following ideas regarding the subsequent growth of the nucleated crystals were first formulated by Turnbull in
1956 (43).
Crystal growth is essentially the result of thedifference between two kinetic processes; firstly the transfer of atoms from the liquid to the crystal, and secondly the
reverse process. Two energy values are important. Firstly
, .
there is the diffusional energy, GD, require~ for an atom to cross the interface between the liquid and the crystal, and secondly there is the free energy of crystallisation, G
B• In transfering an atom from liquid to crystal the activation energy that has to be overcome is simply G
D, for GB is in its favour. For the reverse process the activation energy becomes the sum of GD + GB• Hence the net rate of transfer ot
atoms to the crystal 6N becomes:
~N
=
nt[exp(-:~)
-
eXP{-(G
D:TGB1)]
,1N
=
nf.eXP(-Gp){l - eXP(-G:§} ). R~ RT
The symbols used are as defined previously. As each particle is deposited on the crystal surface the effective increase in the crystal dimension is of the order of the particle
separation ao• Consequently, the rate of crystal growth, U, is given by:
U
=
ao·nf .exp(-:~)(1
-
exp(-~l)
There is one further refinement to be made to this equation. Growth in general does not occur uniformly over the crystal surface, it is more energetically favourable for
atoms to be deposited on steps provided by screw dislocations present on the surface. Therefore only a fraction of the atomic sites are actually available for growth. The correction factor, by which the above growth rate has to be multiplied in order to
.'
allow for this effect, is given approximately by ~T/21iTm
(45).
The decrease in the bulk free energy at the crystal surface results in the emission of heat. If the thermal conductivity of the material is not sufficient to conduct this away then there is a build up of temperature at the interface and the application of the above equation is affected (51). However, only in cases where extremely high growth rates occur does this become important
(45).
Typical curves showing the relationship between the
nucleation rate, the growth rate and the degree of undercooling are shown in Fig. 1.1
(45, 52).
The crystallisation of a glass to form a glass-ceramic is analogous to these processesdescribed above. Hence, depending on the crystallite size required, the conversion usually takes the form of a two
stage heat treatment. The specimen is first held at a lower, nucleating temperature before being heated to the higher crystal growth temperature. It is then usually allowed to dwell at
this temperature until crystallisation is complete. 1.3 Origins of the Project and Possible Applications.
Initial ideas and enthusiasm for this project stemmed from communications with Borax Research Ltd. (B.R.L.). It had
been discovered that a highly conducting glass or glass-ceramic could be formed by doping an anhydrous borax based glass
(Na2 0:2B20
3)
with certain halides(53).
w
a::
::::>
<
c:::
UJ
a.
L
UJ
I-FIGURE 1·1
VARIATION OF NUCLEATION RATE AND
GROWTH RATE WITH TEMPERATURE
---melting temperature
NUCLEATION
in these materials. The nature of the conducting species, the mechanism of conduction, the effects of heat treatment, and the inter-relation of conductivity and structure all had to be investigated. This type of work would involve the use of a wide range of experimental techniques and would form a very interesting project.
Furthermore, there is also a direct technological
application associated with these materials. This application lies in the field of electrolytes for high power density
batteries. Such batteries have been considered for use in various traction vehicles, such as railway engines, cars and other road vehicles (for example see 54-56), and for use as a load levelling facility by the electricity supplY,industry (for example see 57, 58). The possible use'in such batteries of a highly conducting material based on sodium ion transport, will be illustrated in the following discussion.
The traditional battery in common use every day is the lead acid battery. However, this has an inherent problem in the fact that its associated energy density is very low; only approximately 30 Wh/kg. (58). Coupled with this is the
relatively high cost of raw materials, i.e. lead. Hence, it is of little surprise that considerable effort has been made in attempting to find an alternative battery.
Several battery systems have been considered including nickel-iron at 40 Wh/kg., silver-cadmium at 80 Wh/kg.,
difficulty in obtaining an electrolyte. Rather, the battery most favoured is the sodium-sulphur battery, with an energy density of approximately
230
Wh/kg.(59).
The basic principles of operation have been investigated by a host of workers and are well understood (e.g.60-63)
and the areas of possible application are constantly being reviewed(64-68).
The electrodes in this battery are liquid sUlphur and liquid sodium, together with an electrolyte of beta-alumina. The battery is operated at
350
0C in order to keep the electrodes molten. It was the discovery of beta-alumina that reallymade the possibility of manufacture of the battery a viable idea. The problem was not only that the material had to be highly conducting to sodium ions, but it also had to survive in a very harsh chemical environment, be mechanically strong, give long life, be easily formed to the necessary shape and the raw materials and manufacturing costs had to be as low as possible (see
69).
There are, however, considerable problems to be overcome when using beta-alumina as the electrolyte. Firstly, it is very difficult to machine and shape to the form needed, and secondly it is a difficult material on which to form seals. Despite these drawbacks beta-alumina has remained the first choice material because of its extremely high conductivity and chemical inertness.
14.
be necessary, and the conduction is isotropic, so that there are no problems associated with grain boundaries or orientation. Furthermore, by adjusting the exact composition and/or changing the heat treatment procedure, the physical properties of the glass can be changed to some extent. Hence, the matching of thermal expansions for seals etc. can be achieved more easily. The seals themselves would still remain a problem, though the favourable possibility of direct glass-to-metal seals could be considered.
However, all of this speculation relies on the availability of a glass with high sodium ion conductivity. It is not
absolutely necessary to emulate the extremely high conductivity of beta-alumina because the glass electrolyte could be made
much thinner, nevertheless a very high conductivity is required. A number of highly ionically conducting glasses have been
found, but in most cases the mobile ion is either lithium, silver or occasionally the fluoride ion. The glasses with highly mobile lithium ions include the systems Li
20 + LiF + Al(P0
3
)3
(71), Li20 + B203
+ LiX (X=
I, Br, Cl, F) (72-76), and Li20 + B203 + LiF + Li2S04 + Li2S03 (77). Those with highly mobile silver ions include AgX + Ag20 + P20
5
(X = I, Br, Cl)(78),
,
AgI + Ag20 + Mo0
3 (79), AgX + Ag20 + B203 (X = I, Br) (80) and Ag2S + AgP0
3 (81). The fluoride ion conducting glasses are
based on ZrF
4
(82).Because of the direct comparison with highly conducting lithium halo-borate systems and silver halo-borate systems, mentioned above, in the first instance it is perhaps not
and interesting results.
-It is usually the case that the electrical conductivity of the re-crystallised glass-ceramic is inferior to the parent glass
(45,79, 83).
However, should the reverse be true in a particular case, then the material could still be considered as a possible electrolyte. Admittedly, a further heat treatment step would be introduced into the manufacturing process, but this could be contended with providing it brings about no great inherent deformation. Furthermore, the re-crystallised glass-ceramic is usually much stronger than the parent glass(45),
which would be a favourable improvement.
Borates are quite resistant to attack by sodium and hence the possibility of using these materials as an electrolyte could be considered viable.
1.4 Aims for Advancement.
It must be remembered that throughout the period of this project there has been very close liason with an industrial research group at B.R.L., who have been working on similar materials. From the outset it was decided that the emphasis of the work in the respective laboratories should differ; while work at B.R.L. would concentrate on maximising the electrical conductivity of the materials and assessing their performance and viability as electrolytes, work at Warwick would concentrate on the understanding of the conduction process and its mechanism, on considering any structural
effects, on the effect of heat treatments on conductivity, and on the possible extension to other analagous materials.
It is this latter area of work that is reported in
,
16.
1.5
Thesis PlanThe thesis is divided into eight chapters.
Chapter 2 reviews current knowledge and opinions regarding electrical conductivity in various glassy and crystalline
materials. It includes a brief discussion of electronic conductivity but concentrates mainly on the theory of ionic conduction and on the various materials for which this process is important.
Chapter 3 describes the compositions used, the method of glass preparation and the heat treatment processes used in the conversion to glass-ceramics.
Chapter
4
discusses all the experimental apparatus used and the techniques employed in making the measurements, including forms of the samples used in each case. Also mentioned are possible sources of error that arise in each technique.Chapter 5 contains the results pertaining to electrical conductivity and transport phenomena in general.
Chapter 6 gives an account of the results obtained from techniques that were used to investigate the structure of the glasses and glass-ceramics. Such results complement the results of ChaDter
5.
Chapter
7
disusses the overall experimental findings andattempts are made to correlate the observed changes in conductivity with changes in the structure.
CHAPTER 2
Electrical Conductivity Processes in Glasses. Glass-Ceramics and Ceramics.
2.1 General Comments.
Electrical conductivity is one of the most important physical properties of any material and governs its possible use in a host of applications. The range of conductivity in glasses and ceramics is vast, some materials are highly
insulating, others are semiconductors, while others are superionic conductors. Consequently, there is a great
diversity of application, which serves to encourage further study into the understanding of electrical phenomena. Not
only is there an interest in conductivity from a phenomenalogical viewpoint but it also provides a fascinating subject for
workers in theoretical aspects of physics and materials sCience, and there is.an increasing tendency to approach the subject
from a modern quantum mechanical regime.
Charge can either be carried by electrons, holes or
ions, hence the subject of electrical conductivity is generally split up into two branches, firstly electronic conductivity and secondly ionic conductivity. However there is a growing tendency to compare these two branches from a theoretical
outlook and attempts have been made to unify theoretical idGas regarding the two subjects. (For a detailed discussion on this topic see
(84) ).
-It should be remembered that both electronic and ionic conductivity occur in all materials. However it is usually the case that one of these mechanisms predominates over the
\
18.
electronic conductors or ionic conductors. This project is mainly concerned with ionic conduction and hence a rather less detailed description of electronic conductivity processes will be given in comparison to the discussion on ionic conductivity. 2.2 Electronic Conductivity.
Theoretical ideas regarding electronic conduction have been developed from initial simple assumptions of electron
movement in 'perfect', 'stationary', 'pure' crystalline lattices.
. .
The starting point is the 'Hartree-Fock one electron
approximation'. This assumes that any electron interacts only with the time-averaged charge due to all the other electrons. Added to this is the adiabatic approximation which assumes
that there is negligible coupling between the motion of the electrons and the relatively stationary ion cores; this means that the ions can be considered stationary on their lattice sites. Lastly boundary conditions inherent to the theory are set by the periodicity within the lattice.
Involved discussion of the calculations cannot be entered into here. (For a thorough discussion see
(85-88».
However, the general results are threefold. Firstly the availableenergy states are sectioned into bands which lie only in certain energy regions. Secondly each electron becomes delocalised so that it can no longer be alloted to a given ion. Thirdly each electronic state can be described by a wave-vector which is restricted to lie in a given range called a Brillouin zone. The form of the Brillouin zone is governed only by the type of lattice concerned.
the number of states per unit volume available for occupation at an energy E. It is possible to calculate the band structure of simple crystalline solids and hence to categorise the
material. If N(E) is non-zero at the Fermi energy then the material is a metal or metallic compound with a conductivity
that tends to a finite value at low temperatures, (these materials will not be discussed further). If N(E) is zero at the Fermi energy, i.B. the Fermi level is in the band gap,
.,
then the material is a semi-conductor or insulator.
For these pure intrinsic semi-conductors the number of charge carriers varies as
T3/2exp(-~/2kT)
where 6G is the energy gap (86 p.23l, 87 p.198). The mobility of the carriers is governed by phonon scattering and varies with temperature as T-3/2 (88 p.155, 89 p.15-l6). The conductivity which" is essentially the product of mobility and carrier density therefore varies as exp(-AG/2kT).Before considering amorphous semiconductors it is
interesting to consider the results of doping or of including defects in crystalline materials. Such entities introduce localised states which lie within the energy gap. Depending on the type of defect or dopant that is present, two types of state can occur. Firstly occupied states can exist close to the conduction band (donor states), secondly unfilled states can exist just above the valence band (acceptor states). It then requires little energy to raise an electron from the donor level to the conduction band or from the valence band to a donor level tleaving a hole in the valence band).
Such conductivity is termed extrinsic conductivity, in
comparison to the intrinsic conductivity of the pure, perfect crystal. A thorough discussion of the doping of semiconductors can be found in any solid state physics text (e.g.
86-89).
2.3 Amorphous Semiconductors.
The whole theory of electron energy bands has been built up from ideas assuming lattice periodicity and that each
electron can be described by a Bloch wavefunction with an associated wavenumber. Consequently, it may be thought that such bands could not exist in amorphous materials where there is no periodicity. However this is clearly not the case. One of the obvious features of most glasses is their
transparency to visible or perhaps infra-red radiation. As the frequency of the radiation is increased a cut-off region is eventually reached; this is synonomous with an energy gap, i.e. bands still exist. It is assumed
(85
p.1-2) that the band structure of the glass is not greatly different from that of the crystalline material, except that any structure in the bands is smoothed out and, more importantly, some localised states may appear in the energy gap. Consequently, it could therefore follow that NeEf) is not zero for an amorphous semiconductor. ',(Ef is the Fermi energy).b8.nds (and whether they overlap or not) being determined by the final arrangement of the atoms and the particular type
of energy state involved. From this qualitative viewpoint there is no inherent reason why the arrangement of the bands has to be periodic.
A difference between intrinsic crystalline semiconductor energy bands and those of an amorphous semiconductor lies in
the respective tail regions of the conduction and valence bands. In the case of amorphous semiconductors, Gubanov (90) and
Banyai (91) demonstrated that',the states are localised and not extended, even though the wave functions of the states overlap t85 p.3 and p.46).
With this resulting band scheme for amorphous semiconductors three possible transport mechanisms for
carrier conduction occur (85 p.4?). Firstly, as in the case of intrinsic crystalline semiconductors, there is the
possibility of promoting electrons to the conduction band,
followed by their motion therein. In this case the conductivity -(Ec-Ef)
varies as exp , kT ' where Ec 1s the lower edge of the extended state conduction band and Ef is the Eermi level. Here, the mobility has a value of approximately 0.1 cm2v-ls-l
(85 p.48). This expression should be compared to that above for intrinsic crystalline semiconductors where Ef lies in the centre of the gap so that Ec-Ef=Eg/2.
The second conductivity mechanism is hopping between the ' localised states in the band tail and the band gap. This
type of hopping 1s thermally activated as it needs the
mobility is given by (84 p.375):
~ =ea2·~h·exp(-W/kT).exp(-~a)
kTwhere W is the energy difference between the sites involved in the 'hop', \)Ph is a phonon frequency, 'a' is the hopping distance and the term exp(-2~a) describes the overlap of
the wavefunctions describing the two sites, with ~ indicating the rate of spacial decay of the localised wavefunction.
The mobility in this case is typically an order of magnitude smaller than that in the former case.
Over most of the temperature range, dependent on the glass concerned, one of these two mechanisms, mentioned above, predominates. It is only at low temperatures that
the third mechanism, variable range hopping, need be considered. This can only occur when N(Ef) is non-zero and involves hopping
to sites which are energetically, but not spacially, closer to the original site and foregoes nearest neighbour hopping. Conduction occurs only near the Fermi energy and varies as exp(_B/Tl / 4 ), (85 p.48).
Amorphous germanium and amorphous silicon are typical semiconductors and their conductivities are well documented. (As a general reference see 85 p.345 and p.362). It has proved possible to separate the conduction due to each of the above three mechanisms, and it is found that for germanium variable range hopping predominates almost up to room temperature, where localised electron hopping takes over. At higher
One further point must be mentioned in association
with these two amorphous semiconductors. Their conductivity is not very sensitive to dopants which would form donor or acceptor states in the crystalline materials, (92). This is in marked contrast to the effect of such dopants on the crystalline materials, as was mentioned earlier. It is
postulated (93, 94) that this difference is due to the fact that in the crystalline material the dopant, e.g. five valent
phosphorus, is taken into the lattice directly .in place of the four valent germanium or silicon atom. This allows its fifth valency electron to become loosely bound. In the case of amorphous germanium or silicon the network is able to
rearrange so that all the valence electrons of the phosphorus atom are used in bonding. Consequently, there is no loosely bound electron able to contribute to conduction.
Chalcogenide glasses also form an interesting group of amorphous semiconductors. Their conductivities generally show an exponential dependency on temperature and the associated mechanism is thought to be thermally activated localised state hopping with holes being the main carriers (84 p.387, 85 p.535) though the precise nature of this hopping remains open to debate.
The value of the conductivity is very low, for amorphous selenium it is approximately lO-16Jl-1cm-1 (95).
in these glasses arises from charge transfer between ions of variable valency. Historically the glass most frequently investigated is V
205 in P205, (96), but other transition metal oxides such as FeO, CoO, Cu20 and NiO can easily be incorporated into a glass forming oxide base. (For a general review see 97 p.579). The conductivity of such glasses can be represented by the following typical equation:
V4+ _ 0 _ V5+ --. V5+ -
° _
V4+i.e. inter-ion electron migration takes place. The
conductivity is dependent on the overall concentration of
the transition metal ions and also on the relative concentrations of the high- and low- valency ions, with a maximum in the
conductivity occuring when the concentration ratio is unity (98).
Because the conductivity is governed by a migration rate the usual exponential dependence of conductivity on temperature is observed to hold (97 p.587).
2.4 Ionic Conductivity Theory.
Over the years an enormous amount of data has been published regarding the ionic conductivity of a wide range of both crystalline and glassy materials. Theoretical ideas describing these phemomena have remained rather simple, but nevertheless describe the experimental findings rather well.
As early as 1908 it had been established
(99)
that, for a large number of crystalline and glassy materials, theconductivity-temperature relationship could be described· by: log
e=
A + ~T
where (?is the resistivity and A and B are constants. However,
~
conduction could be due to the motion of ions was Joffe in 1931 (100), who was working on crystals of the rock-salt
type. Even so, it was not until 1946 that Frenkel put forward ideas that related ionic motion to the above formula (101). He was working on crystalline materials at the time, though similar concepts for the glassy state soon followed from Stevels (102, a and b).
The diffusion process envisaged by Frenkel was of two types. Firstly there was the motion of interstitial ions
between interstitial sites, and secondly there was the movement of lattice ions into neighbouring lattice site vacancies.
Essentially this second process can be thought of as being the diffusion of lattice holes. In either case the ion is described as being in a potential well and the diffusion process is controlled by the activation energy needed to complete the in~er-site 'jump'.
The following theory initially concerns periodic crystal lattices, but it,will ultimately be extended to include glassy networks. In the case of these periodic lattices in zero
applied field the varying atomic potential can be
diagramatically illustrated as in Fig. 2.l.A. The mobile ion will tend to rest at the minima of the potential well (i.e. at positions x, y, z) where they vibrate with thermal energy at a frequency foe The probability that at any instant in time the ions have an energy E is governed by the Boltzmann
factor exp(-E/kT).
It follows that the number of jumps per second that an ion makes either to the left or to the right, is given
.
,FIGURE 2 ·1
A
Crystal in zero field
CL
x
y
z
POSITION
B
Crystal in a field!2J
CL
POSITION
(
Glass
'\
the probability of jumping to the left is equal to that of jumping.to the right. Consequently if fL corresponds to the frequency of jumps to the left, and fR to the frequency of jumps to the right, then in zero field:
fL
=
fR=
~fo·exp(-k~)
When an external electric field, ¢, is applied, the potential diagram, while maintaining its well-like character, will acquire a constant slope, as in Fig. 2.1.B. The difference in potential energy of the ions in adjacent well troughs (or of adjacent peaks) is given by ¢.a.q. where q is the
charge on the ion and a is the well separation. Consequently the barrier height for a jump to the left has been increased by
1
¢aq, while that to the right has been decreased by the2
same amount, i.e. the situation becomes: fL
=
~.fo·exp(-(u +fR
=
~.fo. exp((u-1/2 kT 1/2 kT
¢ag
»)
¢ag
»)
Thus the net flow of ions to the right, J::.f, is given by:
Af
Af
It must be emphasised that the application of an external field does not 'force' or 'pull' ions out of the potential well, but rather serves only to preferentially direct what was otherwise random motion.
The distance moved with each jump is a, hence the drift velocity to the right, V, of each mobile ion is given by:
V = a. Af
The current density, j, is defined as:
where n'is the number of mobile ions per unit volume. Consequently:
j
=
n.q.f .a.exp(-U).sinh(~)o kT 2kT
Except in cases of very high field, ¢aq« 2kT, i.e.
and
sinh(~) ~ ~ 2kT '" 2kT
j
=
n~q2a2fo
.exP(=:)
2kT kT
The resistivity,
(l,
is defined ase
=~
j
hence,
p
=
2kT .exp(.!L) nq2a2fo kTNote that this theory has described one dimensional behaviour. In a three dimensional crystal jumps will occur in directions that are not necessarily parallel to the applied field. This introduces a numerical multiplying constant, of the order of unity, into the pre-exponential part of the above equation.
The above relationship is the same as that deduced by Frenkel (101), Owen (103) and by Hench and Schakke (104). Other authors have put forward similar formulae which differ
from this by only a numerical constant. For instance Stevels (102), when considering glassy materials, writes:
p
=
6kT oexp(u) bnq2a2fo kTwhere b is the number of adjacent wells that the mobile ion
27.
can jump into. Mazurin (105) supports the work of Skanavi (106) and defines the resistivity by:
f=
3kT oexp(.!L) nq2a2f o kTcommon to write the equation in the following form: log
(>
= 10g(; 2kT ) +!L
nq2a2f kT
o
In most experiments, when measuring the resistivity as a function of temperature, the factor
!L
varies very muchkT
more quickly than the logarithmic term in the expression. This logarithmic term is therefore frequently treated as a constant, and the equation can be· written in the form:
where
and B
=
Uit
This is precisely the same form as that found empirically (mentioned above).
The equation needs one further refinement. The value of n has so far been taken to be constant; this is simply not the case. The number of vacancy pairs or interstitial ions per unit volume varies as:
n = n exp(-w \
o
2kTJ
where W is the energy needed to create a vacancy pair or to remove an ion from a lattice site to an interstitial position (86 p.539, 88 p.37). The resistivity equation then becomes:
log
e
= 10g(; 2kT ) + U + 1/2W noq2a2fo kTwhich are due to the presence of impurity ions, grain boundaries etc., i.e. these defects are not thermally generated. At low temperatures the current is carried by these inherent defects, the thermally activated defects being negligible. The activation energy for the conduction is then simply U/k. It is only above a certain temperature that thermally activated defects need to be considered. At this stage the activation energy becomes eU + W/2)/k and
the conductivity increases more quickly with temperature (see 86 p.544 and 107 p.855 for further discussion on this topic). The overall conductivity/temperature relationship
is shown in Fig. 2.2. The low temperature region is called the extrinsic region because it depends on impuritiesr while
the high temperature region is called the intrinsic region. The situation is rather analagous to that of doped semi-conductors (see earlier).
2.5 Ionic Conductivity Theory applied to Glasses.
The above theory and resultant equation for conductivity in crystalline materials requires only relatively minor
adjustment in order to apply it to glasses. There are, however, a few points to be considered.
Firstly Fig. 2.1.A depicts· a regular lattice with constant well depth and constant well separation. This is certainly not the case in a more randomly arranged glass. Instead,
the situation is much more like that depicted in Fig. 2.1.C. Consequently it is more difficult to assign a single value
l!J
o
....JFIGURE 2·2
Typical conductivity - temperature
!
relationship for a crystal
intrins,ic region
slope
=
u+J.tw
k
regi on
u
k
-L
Secondly, the above theory concerns the movement of defects such as interstitial ions and vacancies, however, the more random nature of glass makes it very difficult to sensibly define such defects. Indeed in certain binary oxide glasses the alkali metal ions are thought to be almost entirely interstitial. In these circumstances it is certainly not necessary to have a vacancy formation energy as part of the overall activation energy. Consequently the activation energy
reverts to being U/kT and a plot of log ~ versus liT results in a single straight line.
According to the above equation, the conductivity is directly proportional to n, the number density of mobile species. Hence assigning a nUmerical value to n is also an important issue. While it is thought that nearly all the alkali ions in binary glasses become interstitial,it does not necessarily follow that they are all mobile. The value of n is therefore not simply directly proportional to the concentration of alkali-oxide. For example, the conductivity of the system Na20-Si02 increases very quickly as more Na20 is added (108), the rate of increase being far above the linear rate expected. One model which attempts to explain this effect is the 'weak electrolyte theory' (109, 110). In this theory it is postulated that only a small fraction of the available sodium ions are sufficiently loosely bound to be able to contribute to conduction. The remaining ions are held in the macro-molecular skeleton. The situation is then analagous to disassociation in an electrolytic solution illustrated by the following equation:
The rapid increase in conduction is then thought to be due to the degree of disassociation increasing rapidly on adding Na
20, i.e. while the addition of a small amount of Na
20 may only slightly increase the number density of alkali ions, it drastically increases the number of mobile alkali ions. Ravaine and Souquet (109) have put forward conductivity data which they claim support this theory.
Models other than the weak eiectrolyte theory have been put forward which also claim to explain this variation of ionic conductivity with composition. For example, Glass and Nassau (111)
suggest a random site model. They believe that a continuous energy distribution of alkali ion sites exists and that
consequently a clear distinction between mobile and immobile ions is not meaningful. Instead, they believe that at low concentrations of alkali ions only the low lying energy states are filled. In this case a high activation energy barrier has to be overcome. At increased concentrations of alkali ions the less low lying states start to be populated with a
consequent reduction in activation energy and a disproportion-ate increase in conduction.
It has not yet been discovered which of these models is correct.
2.6 The Nature of the Activation Energy.
Considerable effort has been made in attempting to calculate the activation energy U concerned with the ionic diffusion process (e.g. 112 - 115). Anderson and stuart (112)
firstly an electrostatic energy contribution, and secondly a strain energy contribution. Hakin and Uhlmann (116) have applied the model to alkali silicate glasses with quite good results. The electrostatic contribution is calculated from the difference in potential between the situations when the alkali ions and oxygen ions are separated onlyoy the sum of their radii, and when they are separated by half the distance between adjacent interstitial sites. The strain contribution is found from the work done in expanding a cavity of normal radius r1 up to a radius r2, where r2 is the radius of the alkali ion, the unexpanded void radius r1 being estimated from data concerned with the diffusion of gases through the material.
2.7 Ionica11y Conducting Glasses.
Owing to the vast nature of this subject, and the enormous amount of data available, it is only possible to cover a few of the more simple or directly relevant glasses. The field is certainly still growing, with new and interesting glasses frequently being put forward.
2.7.1 Binary Alkali Silicates.
These glasses are perhaps the simplest ionically conducting glasses in existence. However, their useful application as ionic conductors is rather restricted because they are not particularly conducting. Vitreous silica itself is very resistive indeed (""1016,n.cm. at room temperature, 104, p.594). It has been shown (117,118) that the conduct-ivi ty of 'pure' silica is highly sensitive to the number tYf impurity ions, especially sodium ions. Consequently it
..