Received August 25, 2012; revised September 26, 2012; accepted October 4,2012
ABSTRACT
The nanosecond single pulse was employed here to generate a large volume glow discharge between the wire-plane electrodes in air. In order to find requirements on pulse waveform for generation of a large volume discharge at atmos-pheric pressure, the effect of pulse risetime, pulse width, and amplitude on glow discharge has been widely investigated in this paper. Results reveal that a large volume glow discharge can be generated in an inhomogeneous electric field under the single pulse with the faster risetime, the lower peak amplitude. The pulse width has almost no influence on the density of glow discharge, but which has a great influence on the transition from glow discharge to streamer dis-charge. A model of inter-shielding-effect has been proposed to explain the influence of waveform parameters on pulsed glow discharge.
Keywords: Pulsed Discharge; Large Volume Glow Discharge; Inter-Shielding-Effect
1. Introduction
Gas plasma generated by pulse discharge is widely used in ozone generation [1-3], detoxification of gaseous pol-lution [4-6], material surface treatment [7,8], synthesis of nanostructured material [9,10], etc. In order to improve the efficiency of the applications mentioned above, the homogeneous, large volume discharge is required. From the previous works, it can be seen that nanosecond pulse discharge in non-uniform electric field constructed by needles-plane or wire-plane electrodes is an efficient way to obtain large volume discharge. For instance, Ryo Ono and Tetsuji Oda have used the pulsed discharge between needles-plane electrodes to generate ozone and measured the ozone distribution in the discharge gap. R. A. Roush and R. K. Hutcherson focused on the exhaust gas detoxi-fication efficiency by large volume discharge under dif-ferent pulse risetime and pulse width [11-13]. Although the large volume discharge is widely used in the industry applications, the effect of waveform parameters on the formation of large volume discharge is not very clear yet. In order to find requirements on pulse waveform for ge- neration of a large volume discharge at atmospheric pres- sure and understand more clearly the mechanism of pul- sed discharge, a single pulse voltage with adjustable rise- time, pulse width, amplitude etc is employed here to in- vestigate the formation of the large volume discharge between the wire-plane electrodes with non-uniform
electric field.
2. Experimental Set-Up
Figure 1 shows the schematic experimental circuit em-ployed in this research. A single pulse with the pulse risetime from 10 ns to 500 ns, pulse width from 100 ns to 2 µs, peak amplitude from 10 kV to 50 kV was applied on the wire-plane electrodes. A rogowski brass plane of 60 mm in diameter was used as the cathode, and a brass wire of 0.1 mm in diameter was used as the anode. Also, the wire of 100 mm in length, longer than the diameter of the cathode, was used to prevent the edge effect of the two electrodes. The gap distance was fixed at 8mm. Both electrodes were sealed in a polymethyl methacrylate con- tainer. The air pressure in the chamber can be adjusted in the range of 2 kPa to 0.2 MPa.
The pulse voltage was measured with the voltage di-vider consisting of (R1 & C1) and (R2 & C2), which has
Figure 1. Schematic diagram of the electrode system and the experimental set-up.
(a1)
(a2)
(b1)
[image:2.595.58.286.85.244.2](b2)
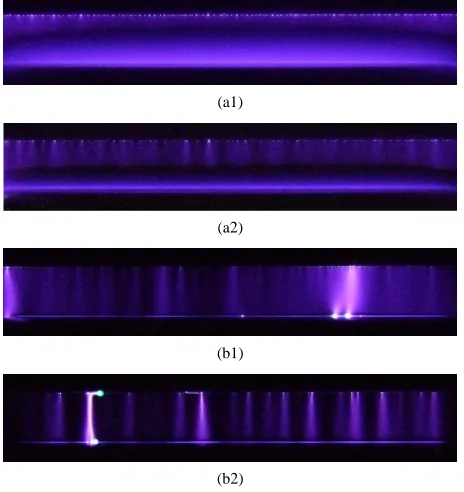
Figure 2. Pulsed discharge images with different pulse rise- times at different air pressures ((a1) 20 ns/6 kPa; (a2) 200 ns/6 kPa; (b1) 20 ns/15 kPa; (b2) 200 ns/15 kPa).
determined by the pulsed discharge time. Furthermore, due to the high resolution and the high sensitivity of the ordinary camera, detail of the discharge channel can be observed more clearly. Therefore, the images of the dis-charges were captured by a camera (FUJIFILM FinePix S6500) with a resolution of 2848 × 2136 pixels in a sin-gle shot with the exposure time of (1/3) s.
3. Experimental Results and Discussions
[image:2.595.57.289.286.532.2]3.1. Effect of Pulse Risetime
Figure 2 shows the images of pulsed glow discharge in wire-plane air gap with the pulse risetime of 20 ns and
Figure 3. Schematic diagram of inter-shielding-effect be-tween avalanches.
200 ns respectively. The pulse width and peak amplitude are fixed at 200 ns and 20 kV respectively. Experiments were carried out at the air pressure of 6 kPa and 15 kPa. For all images in this paper, the upper is wire anode elec-trode and the opposite is plane ground elecelec-trode.
From Figure 2, it can be seen that at the same gas pressure, in the case of fast pulse with risetime of 20 ns, the white spots called spot glow by Anatoly Nikolaevich Maltsev near anode [14], are much more in number than those in the case of the slow pulse with risetime of 200 ns. This can be explained by the inter-shielding-effect. Because of the different delay times in the formation of the primary electrons around the anode, some avalanches grow ahead and distort the electric field in the gap, which leads to the suppressing of the adjacent avalanches. The schematic diagram of inter-shielding-effect is illustrated in Figure 3, in which E0 is the applied electric field, A is
the preceding avalanche, and B is the posterior avalanche, ES is the space charge electric field formed by A around
the head of the posterior avalanche B.When ES is large
enough to cause the total electric field unsatisfied for the development of B, the growth of the posterior avalanche B will stop.
Assuming that there is the delay time(0) of the
pri-mary electron formation. Avalanche A grows ahead of avalanche B at the time of 0 early. The growth of
ava-lanche A results in accumulation of the space charges in the head of avalanche A as well as the decrease of elec-tric field ES around the head of the posterior avalanche B,
which leads to the suppressing of avalanche B and the decrease of white spots around the anode. The following expression can also clarify the effect of pulse risetime on glow discharge [15].
1 20 0
1
, 40
2 c c c
E
n t r r nQ
n
(1)
where, t0 is the pulse risetime when applied E/n has
under the pulse amplitude of 20 kV and 35 kV respec-tively. The experiments were carried out at different gas pressures: 20 kPa, 40 kPa and 60 kPa. The pulse risetime and pulse width are fixed at 20 ns and 120 ns respec-tively.
In Figure 4, the number of discrete channels in pulsed glow discharge decreases with the increase of peak am-plitude. Moreover, the discrete channels can easily come
(a1)
(a2)
(b1)
(b2)
(c1)
[image:3.595.323.522.399.706.2](c2)
Figure 4. Pulse discharge images with different pulse peak amplitude at different air pressure ((a1) 20 kPa/20 kV; (a2) 20 kPa/35 kV; (b1) 40 kPa/20 kV; (b2) 40 kPa/35 kV; (c1) 60 kPa/20 kV; (c2) 60 kPa/35 kV).
will cause the decrease of the discrete channel number as well as the increase of current in each channel. Due to the uneven distribution and the increase of the current in discrete channels, the early propagated channel will tran-sit into streamer or spark discharge, which results in the current and the luminescence decrease in other discrete channels, as shown in Figures 4(a2)-(c2).
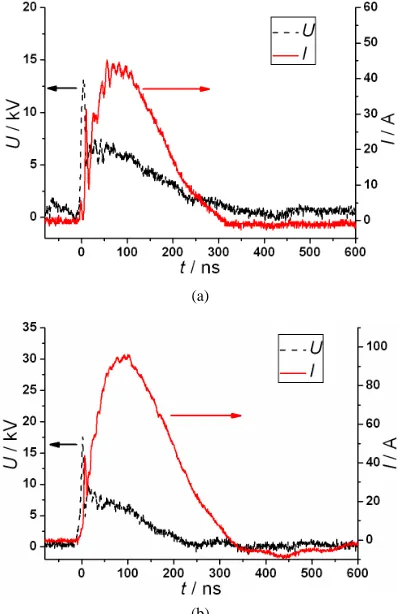
The discharge current waveforms with different pulse amplitude at the air pressure of 20 kPa are illustrated in Figures 5(a) and (b). It can be found that there are some fluctuations on the current waveforms, which are related to the formation of avalanches during the discharge process. Due to the greater inhibition between avalanches at high pulse amplitude, the number of fluctuations on the current waveform under 35 kV pulse (Figure 5(b)) is
(a)
(b)
less than that under 20 kV pulse (Figure 5(a)).
From Figure 5, It can also be found that due to the streamer discharge, the peak discharge current under 35 kV pulse is larger than that under 20 kV pulse, the volt-age collapse time under 35 kV pulse is less than that un-der 20 kV pulse. A slight oscillation on the tail of the current waveform under the pulse amplitude of 35 kV can also be seen, which is caused by the streamer dis-charge illustrated in Figure 4.
3.3. Effect of Pulse Width
Effect of the pulse width on the pulsed glow discharge is investigated by varying the pulse width from 120 ns to 1600 ns at the air pressure of 40 kPa. Figure 6 illustrates the images of large volume discharges under different pulse width with the fixed pulse risetime of 20 ns and peak amplitude of 20 kV.
From Figure 6, it can be clarified that the pulse width in the range from 120 ns to 1600 ns has little influence on the number and luminescence of the discrete channels in the pulsed glow discharge, but the increase of the pulse width will cause the transition from glow discharge to streamer or spark discharge easily. As discussed in part A, the discharge mode in the gap applied by pulsed voltage is dominated by the pulse risetime. Therefore, for a given pulse risetime, the number of the discrete chan-nels is basically invariable and is not affected by the pulse width as shown in Figure 6. However, when creasing the pulse width, the higher energy will be in-jected into the discharge channel, which results in the
(a)
(b)
(c)
(d)
Figure 6. Images of pulse discharge with different pulse width (a) 120 ns; (b) 200 ns; (c) 500 ns; (d) 1600 ns.
transition from glow discharge to streamer or spark dis-charge in the early propagated channel due to the uneven distribution of the current. In Figure 6, the luminescence of the other discrete channels is nearly not influenced by the pulse risetime, which can be considered that the in-creased pulse energy is almost injected into the early propagated channel with the increase of pulse width.
The discharge current waveforms under different pulse width are illustrated in Figure 7, the part in the range of 0 - 150 ns is zoomed at the top right corner. From Figure 7, it can be seen that at the first 60 ns, the pulse discharge current waveforms for different pulse width are almost the same, which is controlled by the growth of the pulsed glow discharge channels as shown in Figure 6, i.e. the number of the discrete channels as well as its distribution is determined by the pulse risetime. After the pulse rea- ches the peak value, the discharge development is deter-mined by the pulse width. With the increase of the pulse width, the increased energy is injected into the early pro- pagated channel, resulting in the increasing of the dis-charge current including the increase of the luminescence in the early propagated channel.
4. Conclusion
In this paper, pulsed glow discharge is generated in air between wire and plane electrodes with non-uniform electric field. The effect of pulse risetime, pulse width and amplitude on glow discharge has been widely inves-tigated. Results reveal that a large volume glow dis-charge can be generated in an inhomogeneous electric field more easily under the pulse with faster risetime. The pulse width has almost no influence on the mode of glow discharge, but has a great influence on the transi-tion from glow discharge to streamer discharge. A model of inter-shielding-effect has been proposed to explain the
Positive Dielectric Barrier Discharge,” Journal of Physics D: Applied Physics, Vol. 40, No. 1, 2007, pp. 176-182. doi:10.1088/0022-3727/40/1/011
[3] M. Simek and M. Clupek, “Efficiency of Ozone Produc- tion by Pulsed Positive Corona Discharge in Synthetic Air,” Journal of Physics D: Applied Physics, Vol. 35, No. 11, 2002, pp. 1171-1175.
doi:10.1088/0022-3727/35/11/311
[4] Y. Yankelevich and A. Pokryvailo, “High-Power Short- Pulsed Corona: Investigation of Electrical Performance, SO2 Removal, and Ozone Generation,” IEEE Transactions
on Plasma Science, Vol. 30, No. 5, 2002, pp. 1975-1981. doi:10.1109/TPS.2002.805320
[5] F. Fresnet, G. Baravian, L. Magne, et al., “Influence of Water on NO Removal by Pulsed Discharge in N2/H2O/
NO Mixtures,” Plasma Source Science and Technology, Vol. 11, No. 2, 2002, pp. 152-160.
doi:10.1088/0963-0252/11/2/305
[6] T. Namihira, S. Tsukamoto, D. Wang, et al., “Influence of Gas Flow Rate and Reactor Length on NO Removal Us-ing Pulsed Power,” IEEE Transactions on Plasma Sci- ence, Vol. 29, No. 4, 2001, pp. 592-598.
doi:10.1109/27.940952
[7] T. Yuji and Y. Sung, “Surface Treatment of TiO2 Films
by Pulse Plasma for Dye-Sensitized Solar Cells Applica- tion,” IEEE Transactions on Plasma Science, Vol. 35, No.
Journal of Nanoscience and Nanotechnology, Vol. 7, No. 11, 2007, pp. 3744-3749. doi:10.1166/jnn.2007.003
[11] R. Ono and T. Oda, “Dynamics of Ozone and OH Radi- cals Generated by Pulsed Corona Discharge in Humid-Air Flow Reactor Measured by Laser Spectroscopy,” Journal of Applied Physics, Vol. 93, No. 10, 2003, pp. 5876-5882. doi:10.1063/1.1567796
[12] R. Roush, R. Hutcherson, M. Ingram, et al., “Effects of Pulse Risetime and Pulse Width on the Destruction of Toluene and NOX in a Coaxial Pulsed Corona Reactor,”
Proceeding of 22nd IEEE International Power Modulator Symposium, Boca Raton, 25-27 June 1996, pp. 79-84. [13] D. Wang, M. Jikuya, S. Yoshida, et al., “Positive- and Ne-
gative-Pulsed Streamer Discharges Generated by a 100-ns Pulsed-Power in Atmospheric Air,” IEEE Transacitions on Plasma Science, Vol. 35, No. 4, 2007, pp. 1098-1103. doi:10.1109/TPS.2007.902132
[14] A. N. Maltsev, “Dense Gas Discharge with Runaway Elec- trons as a New Plasma Source for Surface Modification and Treatment,” IEEE Transactions on Plasma Science, Vol. 34, No. 4, 2006, pp. 1166-1174.
doi:10.1109/TPS.2006.878994