Seed Yield and Morphological Variations of Beechnuts in
Four European Beech (Fagus sylvatica L.) Populations in
Croatia
OriginaL SCiEntiFiC PaPEr DOI: https://doi.org/10.15177/seefor.18-06
(1) Croatian Forest Research Institute, Division for Genetics, Forest Tree Breeding and Seed Husbandry, Cvjetno naselje 41, HR-10450 Jastrebarsko, Croatia; (2) University of Zagreb, Faculty of Forestry, Department of Forest Genetics, Dendrology and Botany, Svetošimunska 25, HR-10000 Zagreb, Croatia; (3) Croatian Forest Research Institute, Department of Nursery Production, Cvjetno naselje 41, HR-10450 Jastrebarsko, Croatia
* Correspondence: e-mail: andelina@sumins.hr
aBStraCt
Background and Purpose: Since the last decade, the amount and periodicity of European beech seed crops in Croatia have been disrupted, and thus the regeneration of its forests has become increasingly questionable. The aim of this study was to determine: (1) seed yield variations within and among four European beech populations and its relation with tree crowns projection, (2) variation in seed morphometric traits of the studied populations, and (3) various methods of seed yield estimates.
Materials and Methods: Research was carried out in four populations of registered European beech seed stands. Experimental plots 80×60 m in size were established in 2016. Horizontal crown projections were calculated for 25 dominant beech trees at each plot. Seed yield per tree was estimated based on seed traps, and by visual scoring of seeding intensity. On a sample of twenty trees (five trees per population) total seed crops were collected by large nets covering their whole crown projections. Different methods of seed yield estimates were compared. The amount of seed yield per population (number of beechnuts per ha) was estimated as well. The length, width and mass of beechnuts were measured. Data were analysed to establish differences within and between populations. Relationships between seed yield and horizontal crown projection, as well as among seed morphometric traits were analysed.
results and Conclusions: The seed trap method overestimated yields when compared with the real yields caught in the large nets. When crown projections were decreased by 25% the seed trap estimation method was improved. A positive correlation between visual scores of seeding intensity and seed yield estimates proved highly unreliable and therefore inaccurate. The results showed high variability of seed yields within and between the populations. The average yields per population varied from 2.4 to 5.9 million seeds·ha−1. A positive and significant correlation between seed yields and crown horizontal projections was shown (R2=0.6285), indicating that stand density is an important factor for seed production. A positive and statistically significant correlation between beechnut mass and width was obtained (R2=0.5875).
Keywords: Fagus sylvatica L., seed yield, crop estimates, crown projection, seed morphometric traits
anđelina gavranović
1*, Saša Bogdan
2, Miran Lanšćak
1, ivica Čehulić
3, Mladen ivanković
1Citation: GAVRANOVIĆ A, BOGDAN S, LANŠĆAK M, ČEHULIĆ I, IVANKOVIĆ M 2018 Seed Yield and Morphological Variations of Beechnuts in Four European Beech (Fagus
sylvatica L.) Populations in Croatia. South-east Eur for 9 (1): 17-27. DOI: https://doi. org/10.15177/seefor.18-06
received: 09 Apr 2018; revised: 27 May 2018; accepted: 29 May 2018; Published online: 12 Jun 2018
intrODUCtiOn
European beech (Fagus sylvatica L.) is widely distributed across Europe and is one of the dominant forest tree species in Central Europe [1]. In total, beech covers an area of roughly 14 million hectares [2] and, thus, is ecologically and economically one of the most important species in European forestry [3]. In Croatia, beech is the most common tree species as well.
It extends over 47% of the total forested area [4], with a proportion of 45% in the total growing stock [5].
Climate change undoubtedly represents one of the greatest dangers on the global level in the 21st century. Most of the current climate projections for Europe predict the increase of mean air temperatures, and increase in frequency, duration
and intensity of summer droughts [6-8]. Over the last 140 years mean annual air temperature has increased by approximately 0.8°C [7, 9, 10]. Future projections indicate even more radical changes. Projected emission scenarios as summarised in the IPCC report [7] suggest that the average global air temperature will rise by additional 1.4-5.8°C by the end of the 21st century. The increase of air temperature coupled with a decrease in precipitation during growing seasons will most probably have severe and adverse effects on natural ecosystems, especially in southern and south-eastern parts of Europe [11].
Global change affects the functioning of forest ecosystems that are faced with direct and indirect impacts of a changing climate. Moreover, it is important to know the composition and structure of genetic diversity, especially regarding the so-called "adaptive properties of forest trees" [12]. Due to possible scenarios of global climate change, there is great interest and concern about beech ecosystems. According to Milad et al. [13], beech is a species that tolerates moderately dry periods, but if dry periods are prolonged for a number of years, this may have a negative effect on the species. Also, it is certain that drought will have a negative impact on forest productivity and that it will certainly affect the increased mortality of plants [14-16]. Von Wüehlisch [17] stated that natural beech areal reduction will occur and that the most endangered habitats will be those at lower altitudes in the southern and south-eastern parts of the species’ distribution area. At the same time, northern and north-eastern parts of the area will become more suitable for beech ecosystems [17, 18].
Historically, beech forests in Croatia have been naturally regenerated. Seed production and its use have been mostly contained in local natural stands [19]. However, Žgela [20] alarmed that there is an increasing need for artificially produced beech seedlings, which requires the collection of sufficient quantities of high-quality seeds. Nowadays, the absence of regular mast crops is one of the big problems of Croatian forestry and the necessity for assisted regeneration of beech stands is seriously raising. The interaction between climate and
seed production has been confirmed by several studies [21-24]. Seed production of beech is irregular with a wide variation among years [21-23]. The mast years are strongly affected by annual climatic variability [25] and occur irregularly at intervals of between three and fifteen years [26-29].
Knowledge on dynamics of seed production of European beech in Croatia (as well as in the wider region) is very scarce. It remains largely unknown what the trends are in masting and how climate change, along with other factors, influences crop dynamics. Therefore, a need for research in this field has been recognized. This study represents the very first step in research of seed yield of selected European beech populations in Croatia.
The main objectives of the study were to determine: (1) the correlation between seed yield variations within and between four populations and tree crown projections, (2) variations in seed morphometric traits of the studied populations, and (3) the accuracy of various seed yield estimates.
MatEriaLS anD MEtHODS
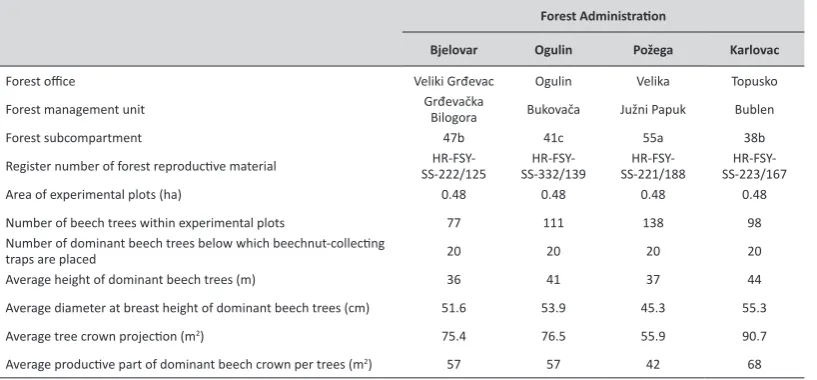
The study was carried out in the established experimental plots in four populations of registered European beech seed stands in Forest Administrations Ogulin, Karlovac, Bjelovar and Požega in 2016 (Table 1). The size of each plot was 60x80 m. All beech trees within the plots were numbered and a raster netting marks were placed on every 20 m. The closest dominant beech tree was selected next to each mark (in total, 20 trees were selected in each plot by this method). Additionally, five more trees were selected for observing the accuracy of seed yield estimation.
tree Measurements
Diameter at breast height (dbh), tree height (h) and crown radiuses were measured on all selected trees. Crown radiuses were measured in four directions (North, South,
Forest administration
Bjelovar Ogulin Požega Karlovac
Forest office Veliki Grđevac Ogulin Velika Topusko
Forest management unit Grđevačka Bilogora Bukovača Južni Papuk Bublen
Forest subcompartment 47b 41c 55a 38b
Register number of forest reproductive material SS-222/125HR-FSY- SS-332/139HR-FSY- SS-221/188HR-FSY- SS-223/167
HR-FSY-Area of experimental plots (ha) 0.48 0.48 0.48 0.48
Number of beech trees within experimental plots 77 111 138 98
Number of dominant beech trees below which beechnut-collecting
traps are placed 20 20 20 20
Average height of dominant beech trees (m) 36 41 37 44
Average diameter at breast height of dominant beech trees (cm) 51.6 53.9 45.3 55.3
Average tree crown projection (m2) 75.4 76.5 55.9 90.7
[image:2.476.31.440.440.630.2]Average productive part of dominant beech crown per trees (m2) 57 57 42 68
East and West) or in more directions in the case of markedly asymmetric crown [49]. Horizontal Crown Projections (HCPs) were calculated on the basis of mean crown radiuses assuming crown circular shape (HCP = mean crown radius2 × π).
Seed Yield Estimates
Two circular seed traps were placed below opposite (North-South) middle points of the crowns. The surface of a seed trap was 0.5 m2. Furthermore, large PVC nets were set up at 1 m above ground below five additional trees per plot. These large nets were set up covering total projection area of the tree crowns to collect their whole seed crop. Below two of the five additional trees, seed traps were set up as well, in the same manner as previously explained. The aim was to investigate differences between real seed yield (caught in large nets) and the estimated yield.
Seed yield per tree was estimated by multiplying total mass of the seeds caught in traps with respective HCP. It was noticed that this method overestimated the crops (the estimates were larger than the real amount of seeds caught in large nets) for all trees which were used in this comparison (Table 2). Therefore we tried to improve seed yield estimates by gradually decreasing HCPs used in the calculations (assuming that only a part of crown projection area is productive). The best estimates (values closest to the real seed yields) were obtained with 25% decrease of the HCP (Table 2). Thus, we corrected seed yield estimates of all studied trees so that the total mass of the trapped seeds was multiplied with 75% of a tree’s HCP.
Also, seeding intensity of the selected trees was visually scored in September 2016. The trees were visually rated using binoculars and then categorized into six classes [30] due to seeding intensity: 0 - none, 1 - very bad, 2 - poor, 3 - average, 4 - good, 5 -very good.
Seed Measurements
Seeds were collected four times in the interval from September to November. Each time seed collections (per tree) were weighed and seeds were counted. The amount of seeds per population (i.e. the number of beechnuts per ha) was calculated based on the actual number of trees per hectare, the estimated mean yield (kg) per tree and the population mean number of seeds per kilogram.
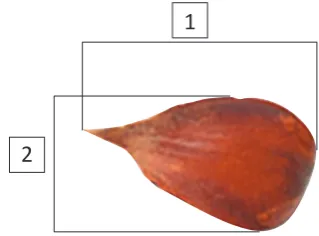
Random samples of 20 nuts per collection and tree were taken for morphometric analysis. Nut length and width were measured by digital calliper with a precision of 0.01 mm (Figure 1), while the mass of the whole sample was measured by digital scale with a precision of 0.01 g.
Statistical analysis
All statistical analyses were generated by SAS/STAT software, a free version of SAS University Edition, by SAS Institute Inc., Cary, NC, USA [50]. Descriptive statistics for
1
[image:3.476.266.426.170.288.2]2
FigUrE 1. Measured seed traits (1 – seed length, 2 – seed width).
seed morphometric traits, estimated seed yields and crown projections were performed using the MEANS procedure. Analyses of variance were conducted for seed yields and crown projections using the MIXED procedure to determine variance components due to the effects of populations according to the following linear model (1):
yij=μ+Pi+εij (ANOVA model 1)
where: yij- individual value of a trait; μ - overall mean; Pi- fixed effect of the population i, i = 1,2,3,4; εij- random error.
Analyses of variance were also performed for seed morphometric traits using the MIXED procedure to determine variance components due to the effects of populations and
tree label
Horizontal crown projection - HCP
(m2)
total mass of seeds in traps
(kg)
total mass of seeds in the
large net
(kg)
total yield (traps + net)
(kg)
Estimated
yield
(kg)
Difference between estimated and real
yield
(kg)
HCP reduced by
25%
(m2)
Difference between corrected estimates
and real yield
(kg)
OG-M2 93.02 0.11 7.39 7.50 10.42 2.91 69.77 0.31
OG-M3 46.31 0.15 5.23 5.38 6.99 1.61 34.73 -0.14
PŽ-M2 80.95 0.24 14.51 14.75 19.43 4.68 60.71 -0.17
PŽ-M3 38.89 0.22 7.09 7.31 8.44 1.13 29.17 -0.98
BJ-M3 129.44 0.22 19.59 19.81 27.83 8.02 97.08 1.07
BJ-M4 83.83 0.11 7.67 7.78 9.31 1.52 62.87 -0.8
KA-M1 61.53 0.13 6.74 6.87 7.91 1.03 46.15 -0.94
KA-M4 92.95 0.14 10.37 10.51 13.01 2.51 69.71 -0.75
[image:3.476.43.448.501.629.2]300
250
200
150
100
50
0
0 0.5 1 1.5 2 2.5 3 3.5 4 4.5 5
tr
ee seed yield per m
2 of a cr
own
(g)
Visual seeding intensity score seed collecting time according to the following linear model (2):
yijk=μ+Pi+C(P)ij+εijk (ANOVA model 2)
where: yijk- individual value of a trait; μ - overall mean; Pi- fixed
effect of the population i, i = 1,2,3,4; C(P)ji - fixed effect of the
collecting time j nested within the population i, j = 1,2,3,4; εijk - random error.
Tukey-Kramer method of the Tukey HSD test was conducted to determine statistical significance of differences between least square means of the populations and of the collecting times.
Pearson correlation analysis was conducted using the proc CORR to determine relationships between studied traits, as well between seed yield estimates and seed intensity visual scoring.
rESULtS
Seed Yield Estimate and Variation
Differences among real and estimated seed yields were studied on a sample of eight trees. Below crowns of those trees large nets were set up together with seed traps, which allowed their comparison. Initially, differences were too large to prove satisfactory. However, after 25% reduction of HCP values, the values of seed yield estimates become much closer to those of the real crops. Average deviation was 0.65 kg per tree ranging from 0.14 to 1.07 kg (Table 2).
All sampled trees were visualy scored for seeding intensity prior to any seed collecting, with the aim of establishing the relationship between scores and estimated seed crop. Positive correlation (R2=0.3219)between the crop per square meter of HCP and visual seeding intensity scoring is shown in Figure 2. Despite this positive correlation, it is evident that the method
used for visual scoring of a tree crop was highly unreliable, i.e. inaccurate. For example, there was a large amount of yields in score 4, as well as a large overlapping between grades. Therefore, it is necessary to improve the visual scoring method to increase the acuracy of seed yield estimates.
Distributions of yields per tree in studied populations are given in Figure 3. The results showed that the largest mean seed yield per tree was in Karlovac population (7.9 kg), while the smallest in Ogulin population (3.7 kg). The average yield per tree in Bjelovar population was 5.1 kg and in Požega population 4.8 kg. Compared to other populations, Karlovac population had more homogenous distribution of yields per tree with the smallest coefficient of variation (CV=43.36). Analysis of variance showed a statistically significant effect of population (F=4.43, p=0.0063). Tukey-Kramer test revealed statistically significant difference between Karlovac and Ogulin populations (p=0.0042).
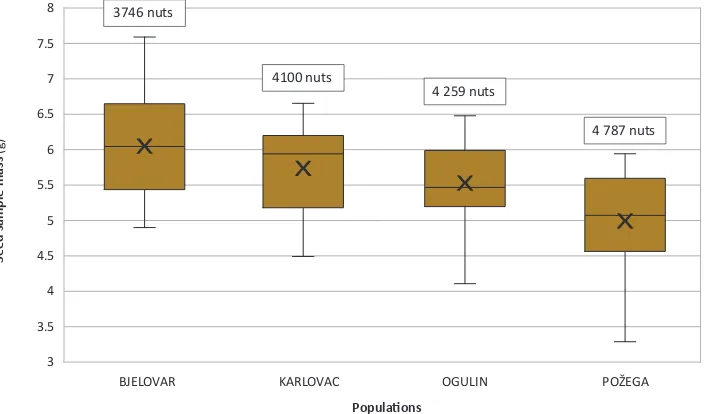
Požega population had the largest amount of beechnuts in 1 kg (Figure 4). There were on average 4,787 beecnhuts in Požega population, 4,259 in Ogulin population, 4,100 in Karlovac population, while Bjelovar population had 3,746 nuts per kg.
The largest mean seed yield was in Karlovac population (5.9 million seeds·ha−1). There were 5.2 million seeds·ha−1 in Požega population, 3 million seeds·ha−1 in Ogulin population and 2.4 million seeds·ha−1 in Bjelovar population.
Correlation between Seed Yields and Horizontal Crown Projections
[image:4.476.50.409.405.616.2]Correlation analysis showed (Figure 5) a positive and statistically significant correlation between tree seed yields and horizontal crown projections (HCPs) (R2=0.6285). Figure 6 shows differences among populations in distributions of
FigUrE 2. Correlation between seed yield per m2 and visual seeding intensity scores.
16
14
12
10
8
6
4
2
0
8
7.5
7
6.5
6
5.5
5
4.5
4
3.5
3
BJELOVAR KARLOVAC OGULIN POŽEGA
BJELOVAR KARLOVAC OGULIN POŽEGA
tr
ee seed yield
(kg)
Seed sample mass
(g)
Populations
Populations
the HCPs. On average, Karlovac population had the largest HCP (90.7 m2), while HCPs from Požega population were the smallest (50.46 m2). Karlovac population on average had largest yields per tree and largest crowns. Average HCP in Bjelovar population was 73.7 m2 and in Ogulin 63.57 m2. Although the analysis of variance showed a statistically significant population effect (p=0.0012), the Tukey-Kramer testconfirmed significant
differences in HCP between Karlovac and Požega (p=0.0007) and between Karlovac and Ogulin (p=0.0397).
Morphological analysis of Beechnuts
Average beechnut length for all populations was 15.90 mm in the range of 6.48–20.26 mm. The largest mean value of a seed length was in Bjelovar population, which
A
AB
3746 nuts
4100 nuts
4 259 nuts
4 787 nuts
[image:5.476.81.417.54.274.2]AB
B
FigUrE 3. Distribution of seed yields per tree in studied populations (the same letters associate populations with no statistically significant differences).
[image:5.476.66.420.316.523.2]30
25
20
15
10
5
0
0 50 100 150 200
Seed yields
(kg)
[image:6.476.51.419.56.266.2]Crown horizontal projections (m2)
FigUrE 5. Correlation between seed yields (kg) and crown horizontal projections (m2).
R² = 0.6285
180
160
140
120
100
80
60
40
20
0
BJELOVAR KARLOVAC OGULIN POŽEGA
Cr
own horiz
on
tal pr
ojections
(m
2)
Populations FigUrE 6. Distribution of crown horizontal projections in the studied populations.
is followed by Karlovac and Ogulin populations, while the lowest mean value was in Požega population (Figure 7). Statistically significant differences in a seed length were shown between populations and between collection time within the populations (p<.0001). The Tukey-Kramer test indicated that Požega population had significantly smaller seed lenghts than all other populations (p<.0001, Figure 7).
[image:6.476.60.411.307.533.2]18
17.5
17
16.5
16
15.5
15
14.5
14
BJELOVAR KARLOVAC OGULIN POŽEGA
Seed leng
th
(mm)
Populations
A
AB
C
[image:7.476.62.420.56.261.2]B
FigUrE 7. Distribution of seed length in the studied populations (the same letters associate populations with no statistically significant differences).
Effect Forest administration (Fa) adjustment adj P
Kolekcija(FA) BJELOVAR 1 BJELOVAR 2 Tukey 0.9848
Kolekcija(FA) BJELOVAR 1 BJELOVAR 3 Tukey 0.7271
Kolekcija(FA) BJELOVAR 1 BJELOVAR 4 Tukey 1.0000
Kolekcija(FA) BJELOVAR 2 BJELOVAR 3 Tukey 1.0000
Kolekcija(FA) BJELOVAR 2 BJELOVAR 4 Tukey 0.9210
Kolekcija(FA) BJELOVAR 3 BJELOVAR 4 Tukey 0.4984
Kolekcija(FA) KARLOVAC 1 KARLOVAC 2 Tukey 0.8824
Kolekcija(FA) KARLOVAC 1 KARLOVAC 3 Tukey 0.1486
Kolekcija(FA) KARLOVAC 1 KARLOVAC 4 Tukey 0.9192
Kolekcija(FA) KARLOVAC 2 KARLOVAC 3 Tukey 0.9988
Kolekcija(FA) KARLOVAC 2 KARLOVAC 4 Tukey 1.0000
Kolekcija(FA) KARLOVAC 3 KARLOVAC 4 Tukey 0.9971
Kolekcija(FA) OGULIN 1 OGULIN 2 Tukey <.0001*
Kolekcija(FA) OGULIN 1 OGULIN 3 Tukey 0.0017*
Kolekcija(FA) OGULIN 1 OGULIN 4 Tukey <.0001*
Kolekcija(FA) OGULIN 2 OGULIN 3 Tukey 1.0000
Kolekcija(FA) OGULIN 2 OGULIN 4 Tukey 0.9899
Kolekcija(FA) OGULIN 3 OGULIN 4 Tukey 0.7708
Kolekcija(FA) POŽEGA 1 POŽEGA 2 Tukey <.0001*
Kolekcija(FA) POŽEGA 1 POŽEGA 3 Tukey 0.0001*
Kolekcija(FA) POŽEGA 1 POŽEGA 4 Tukey 0.0032*
Kolekcija(FA) POŽEGA 2 POŽEGA 3 Tukey 1.0000
Kolekcija(FA) POŽEGA 2 POŽEGA 4 Tukey 0.9997
Kolekcija(FA) POŽEGA 3 POŽEGA 4 Tukey 1.0000
[image:7.476.43.448.317.641.2]The overall average width of seeds was 8.43 mm in the range of 5.11-13.62 mm. Bjelovar population had highest mean values, while Požega population had the lowest mean value (Figure 8). Analysis of variance did not confirm statistically significant differences regarding collection time, but it was confirmed for the population effect (p=<.001). Tukey-Kramer test showed that Ogulin and Požega populations had significantly narrower seeds than Bjelovar (p=0.0011 and <.0001, respectively; Figure 8) and Karlovac population (p=0.0431 and 0.0002, respectively; Figure
8). Therefore, the populations were divided in two groups according to seed width.
Correlation analysis showed a positive and statistically significant correlation between beechnut sample mass and seed width (R2=0.5875) (Figure 9). Between seed mass and seed length there was no significant correlation. Also, as the highest values of seed length and seed width were identified in Bjelovar population, the sample mass of 20 seeds was largest in this population as well.
10
9.5
9
8.5
8
7.5
7
BJELOVAR KARLOVAC OGULIN POŽEGA
Seed width
(mm)
Populations
A
A
[image:8.476.53.405.159.362.2]B
B
FigUrE 8. Distribution of seed width in the studied populations (the same letters associate populations with no statistically significant differences).
R² = 0.5875 10
9.5
9
8.5
8
7.5
7
6.5
6
3 4 5 6 7 8
Seed sample mass
(g)
Seed width (mm)
[image:8.476.49.418.406.612.2]DiSCUSSiOn anD COnCLUSiOnS
The mast year is a year in which large amounts of seeds are produced over a wider geographical area and when it is possible to naturally regenerate beech stands. In general, there is no consensus on the quantity of seeds that should be produced in a year for it to be considered a mast year [45, 46]. However, there is a quite clear difference between mast years and the diminutive amount of seeds in non-mast years [35]. There are very few records of measured mast quantities. In our research, the average estimated seed yield varied from 2.4 to 5.9 million seeds·ha−1. That amount of seeds may be considered as mast crop and it is comparable with Simak report [47] on mast crops from three stands in southern Sweden from 1974 to 1983 (the mean mast crop was 3.7 million seeds·ha−1 per mast year and considerably higher in the liming experiment (5.3 million seeds·ha−1)).
Predicting and estimating seed yield is important because seed availability affects stand regeneration. However, comprehensive research of seed production of European beech in Croatia (as well as in wider region of south-eastern Europe) is still lacking.
It is not easy to make an accurate assessment of the seed potential of a particular forest stand. Many factors affect the yield, such as weather conditions, altitude and micro-site which all have an important influence [31]. It was shown that various environmental conditions (both abiotic and biotic) affect successful beechnut production. Best fructification occurred when air temperature was between 15 and 25°C, and relative humidity did not fall below 26–33% [32]. Full mast is usually preceded by warm and dry July (average temperature of at least 15.8°C, and 16 days or more with a maximum temperature exceeding 20°C) [33]. Nevertheless, the mentioned values of climate variables were presented as results observed in Sweden and might differ between beech ecotypes adapted to northern and southern European climate conditions. Generally, research results on Fagus species in Europe and North America indicate that masting largely depends on meteorological conditions in the years preceding it [34-36].
Our research indicates that the size of a crown (i.e. crown width) is an another particularly important factor for trees’ seed yield [37]. Differences in average HCPs may explain differences in seed yields among the studied populations, at least partially. Within population variations in seed yield are most likely influenced by differences in crown projections among trees. As already confirmed by a study on oak trees [37], the crown size is an important factor forseed productivity. Available spacing has a significant impact on tree growth and development. Thus, widely spaced trees tend to grow larger crowns that are more exposed to sunlight, thus producing larger quantities of seeds. Our research generally acknowledged empirical knowledge that a crop of beechnuts was more abundant at stand margins as compared to conditions below dense stands. Marginal trees gain more heat and light and have better disposition to fructify abundantly than trees inside a dense stand. Of course, our results also indicate that HCPs are definitely not the only cause of differences in seed yields among the populations. For example, Požega population had a relatively good mean crop per tree (not significantlly smaller than Karlovac), despite the fact that this population on average had the smallest crown areas. Apart from the size of crown, factors which conclusively
affect fructification are site and stand conditions, health, tree position and climate history [51, 52]. In the long term, tree characteristics and genetics are probably more important than environmental factors in determining actual beechnut production.
Knowing the morphological and biological properties of beech seed from different localities allows us to improve regeneration and viability of beech stands [38]. The results obtained in the study on variability of morphometric characteristics of seed can also be used to preliminary get acquainted with the genetic variability of the studied populations and to improve the production of quality seed and planting material of beech in Croatia. Beechnuts are triangular, and their width and thickness were measured on two sides. Very similar results considering analysed seed traits have been obtained by Drvodelić et al. [39] who reported average seed length of 15.42 mm in the range of 14.50-16.33 mm, and average width of 8.14 mm in the range of 7.47-8.97 mm. Gradečki et al. [38] reported average seed length of 14.89 mm in the range of 11.31-16.20 mm, and average width of 9.53 mm in the range of 7.63-10.34 mm. If we consider the length and width of the seed as morphological indicators of its variability, we can conclude that within the population variability is very small, while the analysis of variance identified that populations are mutually statistically different. Seed size showed good direct correlation with seed mass. In relation to number of seeds per kg, our results were within the range of other similar reports [40, 41-43]. Our research also indicated high variability of studied nut traits within and among populations. This variability could have been caused by numerous factors, both environmental (e.g. weather, insects) [39] and genetic [44]. European beech is characterized by the possibility of self-pollination, which is an important cause of the occurrence of empty beech seeds [39]. In many forest tree species, controlled self-pollination results in a higher proportion of empty seeds than cross- or wind-pollination [53-56]. Empty seeds of forest trees may also occur as the result of environmental factors, such as limited pollen supply [57] and insect damage [58]. However, factors causing such between-population variability in seed traits are beyond the scope of this study.
Visual surveys of seeding intensity can be conducted relatively simply and quickly by using binoculars. Seed crop estimates before seed fall are an important piece of information for forestry operatives because seed production affects forest regeneration planning. However, such surveys should be satisfactory and accurate, i.e. usable, for at least rough estimates of the yield. As Figure 2 shows, our visual estimate of a crop was highly unreliable. Therefore, to improve this method it should be further modified, most likely by a smaller range of ratings and clearer grades. A good example is given by Nakajima [48], who used more precise seed intensity rates in five classes.
acknowledgments
rEFErEnCES
1. ELLENBERG H 1988 Vegetation Ecology of Central Europe.
Cambridge University Press, Cambridge, UK, 2 p
2. VON WÜEHLISCH G 2010 Introductory note. In: Frýdl J,
Novotný P, Fennessy J, von Wühlisch (eds) Genetic resources
of beech in Europe - current state. Johann Heinrich von Thünen-Institut, Braunschweig, Germany, pp 8-9
3. IVANKOVIĆ M, BOGDAN S, BOŽIĆ G 2008 European beech
(Fagus sylvatica L.) height growth variability in Croatian
and Slovenian provenance trials (in Croatian with English
summary). Sumar list 132 (11-12): 529-541
4. VUKELIĆ J, RAUŠ Đ 1988 Šumarska fitocenologija i šumske
zajednice u Hrvatskoj (Forest Phytocenology and Forest
Communities in Croatia). University of Zagreb, Faculty of Forestry, Zagreb, Croatia, 310 p
5. KLEPAC D 1986 Uvodni referat na simpoziju o bukvi (Colocvium
on beech. Introductory paper) In: Krpan APB (ed) Colocvium on beech. University of Zagreb, Faculty of Forestry, Zagreb, Croatia, pp 11-15
6. IPCC 1997 Stabilization of atmospheric greenhouse gases:
physical, biological and socio-economic implications. IPCC
technical paper III, URL:
https://www.ipcc.ch/pdf/technical-papers/paper-III-en.pdf (20 March 2018)
7. IPCC 2001 Climate Change 2001: Impacts, Adaptation and
Vulnerability. In: McCarthy JJ, Canziani OF, Leary NA, Dokken
DJ, White KS (eds) Contribution of Working Group II to the
Third Assessment Report of the Intergovernmental Panel on Climate Change (IPCC), Cambridge University Press, Cambridge, UK
8. IPCC 2014 Climate Change 2014: Mitigation of Climate Change.
Contribution of Working Group III to the Fifth Assessment Report of the Intergovernmental Panel on Climate Change [Edenhofer, O., R. Pichs-Madruga, Y. Sokona, E. Farahani, S. Kadner, K. Seyboth, A. Adler, I. Baum, S. Brunner, P. Eickemeier, B. Kriemann, J. Savolainen, S. Schlömer, C. von Stechow, T.
Zwickel and J.C. Minx (eds)]. Cambridge University Press,
Cambridge, United Kingdom and New York, NY, USA
9. HANSEN J, RUEDY R, SATO M, IMHOFF M, LAWRENCE W,
EASTERLING D, PETERSON T, KARL T 2001 A closer look at United States and global surface temperature change.
J Geophys Res 106 (D20): 23947-23963. DOI: https://doi. org/10.1029/2001JD000354
10. SV-GUA (Sachverstandigenkreis “Globale Umweltaspekte”) 2003 Herausforderung Klimawandel—Bestandsaufnahme und Perspektiven der Klimaforschung. BMBF, Bonn, Germany 11. EEA 2004 European Environmental Agency. Impacts of
Europe’s changing climate. EEA Report No. 2, Copenhagen, Denmark, ISBN 92-9167-692-6
12. IVANKOVIĆ M, POPOVIĆ M, KATIČIĆ I, VON WUEHLISCH G, BOGDAN S 2011 Quantitative genetic variation of European
beech (Fagus sylvatica L.) provenances from the southeastern
Europe (in Croatian with English summary). Sumar list 135
(13): 25-37
13. MILAD M, SCHAICH H, BÜRGI M, KONOLD W 2011 Climate change and nature conservation in Central European forests:
A review of consequences, concepts and challenges. Forest
Ecol Manag 261 (4): 829-843. DOI: https://doi.org/10.1016/j. foreco.2010.10.038
14. ARCHAUX F, WOLTERS V 2006 Impact of summer drought on
forest biodiversity: what do we know? Ann Forest Sci 63 (6):
645-652. DOI: https://doi.org/10.1051/forest:2006041
15. DOUNAVI A, NETZER F, CELEPIROVIC N, IVANKOVIC M, BURGER
J, FIGUEROA AG, SCHON S, SIMON J, et al. 2016 Genetic and
physiological differences of European beech provenances (F.
sylvatica L.) exposed to drought stress. Forest Ecol Manag 361
(: 226-236. DOI: https://doi.org/10.1016/j.foreco.2015.11.014
16. NETZER F, CAROLIN T, CELEPIROVIC N, IVANKOVIC M, ALFARRAJ S, DOUNAVI A, SIMON J, HERSCHBACH C, RENNENBERG H 2016 Drought effects on C, N, and P nutrition and the antioxidative system of beech seedlings depend on
geographic origin. J Plant Nutr Soil Sci 179 (2): 136-150. DOI:
https://doi.org/10.1002/jpln.201500461
17. VON WÜEHLISCH G 2004 Series of International Provenance Trials of European Beech. Proceedings from the 7th International Beech Symposium IUFRO Research Group 1.10.00 "Improvement and Silviculture of Beech". 10-20 May 2004, Tehran, Iran, pp 135-144 p
18. SYKES M, PRENTICE C 1996 Climate change, tree species distributions and forest dynamics: A case study in the mixed conifer/northern hardwoods zone of northern
Europe. Climatic Change 34 (2): 161-177. DOI: https://doi.
org/10.1007/BF00224628
19. MATIĆ S, ORŠANIĆ M, ANIĆ I 2003 Establishing forests of
common beech. In: Matić S (ed) Common Beech in Croatia.
Academy of Forestry Sciences, Zagreb, Croatia pp 326-339 20. ŽGELA M 2002 Production of beech and beech seedlings in the
period 1991 – 2002 in “Croatian Forests” company, Zagreb. Report held on a colloquium on seed and nursery production beech, 8 p
21. LINDQUIST B 1931 The ecology of Scandinavian
beechwoods (in Swedish with English summary). Svenska
Skogsvårdsföreningens Tidskrift 29: 486-520
22. HILTON GM, PACKHAM JR 1995 A sixteen-year record of
regional and temporal variation in the fruiting of beech (Fagus
sylvalica L.) in England (1980-1995). Forestry 70 (1): 7-16. DOI:
https://doi.org/10.1093/forestry/70.1.7
23. HILTON GM, PACKHAM JR 2003 Variation in the masting of
common beech (Fagus sylvatica) in northern Europe over two
centuries (1800-2001). Forestry 76 (3): 319-328. DOI: https://
doi.org/10.1093/forestry/76.3.319
24. NILSSON SG, WASTLJUNG U 1987 Seed predation and
cross-pollination in mast-seeding beech (Fagus sylvatica). Ecology
68 (2): 260-265. DOI: https://doi.org/10.2307/1939256
25. DROBYSHEV I, NIKLASSONA M, MAZEROLLE MJ, BERGERON Y2014 Reconstruction of a 253-year long mast record of European beech reveals its association with large scale temperature variability and no long-term trend in mast
frequencies. Agr Forest Meteorol 192-193: 9-17. DOI: https://
doi.org/10.1016/j.agrformet.2014.02.010
26. MATTHEWS JD 1955 The influence of weather on the
frequency of Beech mast years in England. Forestry 28 (2):
107-16. DOI: https://doi.org/10.1093/forestry/28.2.107
27. MAURER E 1964 Seed-years of Beech and Oak in Lower
Franconia during the last 100 years (in German). Allg
Forstzeitschr 19: 469-70
28. HARMER R 1994 Natural regeneration of broadleaved trees in
Britain: II Seed production and predation. Forestry 67 (4):
275-286. DOI: https://doi.org/10.1093/forestry/67.4.275-a
29. SMELKOVA LJ 1996 Zakladanie lesa. Tehnicka univerzita vo Zvolene, Zvolen, Slovak Republic 239 p
30. VINCENT G 1965 Lesní semenářství. SZN, Prague, Czech Republic, 330 p
31. GORDON AG, FAULKNER R 1992 Identification and Assessment
of Cone and Seed Crops. In: A.G. Gordon (ed). Seed Manual
for Forest Trees. The Technical Publications Officer, Forestry Commission, Forest Research Station, Alice Holt Lodge, Wrecclesham, Farnham, Surrey GU10 4LH, UK, pp 71-79 32. MÁTYÁS V 1965 Ökológiai megjegyzések a tölgy és a bükk
termésének időszakosságához. Erdészeti Kutatások 61: 99-121
33. OVERGAARD R 2010 Seed Production and Natural
Regeneration of Beech (Fagus sylvatica L.) in Southern
34. PIOVESAN G, ADAMS JM 2001 Masting behaviour in beech:
linking reproduction and climatic variation. Can. J. Bot 79 (9):
1039-1047. DOI: https://doi.org/10.1139/b01-089
35. ÖWERGAARD R, GEMMEL P, KARLSSON M 2007 Effects of
weather conditions on mast year frequency in beech (Fagus
sylvatica L.) in Sweden. Forestry 80 (5): 555-565. DOI: https:// doi.org/10.1093/forestry/cpm020
36. DROBYSHEV I, ÖWERGAARD R, SAYGIN I, NIKLASSON M, HICKLER T, KARLSSON M, SYKLES MT 2010 Masting behaviour
and dendrochronology of European beech (Fagus sylvatica L.)
in southern Sweden. Forest. Ecol Manag 259 (11): 2160-2171.
DOI: https://doi.org/10.1016/j.foreco.2010.01.037
37. MARTINÍK A, DOBROVOLNÝ L, PALÁTOVÁ E 2014Tree growing
space and acorn production of Quercus robur. Dendrobiology
71: 101-108. DOI: https://doi.org/10.12657/denbio.071.010
38. GRADEČKI M, POSTENJAK K, LITTVAY T 2003 Neke morfološke
i fiziološke značajke sjemena bukve. In: Besendorfer V, Kopjar
N (eds) Proceedings of 8 hrvatski biološki kongres. Hrvatsko
biološko društvo 1885, Zagreb, Hrvatska, pp 196-197 39. DRVODELIĆ D, ORŠANIĆ M, PAULIĆ V, ROŽMAN M 2011
Morphological-biological properties of fruit and seed of beech
(Fagus sylvatica L.) growing at different altitudes. Glasnik za
šumske pokuse, 44: 1-19
40. REGENT B 1980 Šumsko sjemenarstvo. Jugoslovenski poljoprivredni šumarski centar-služba šumske proizvodnje, Beograd
41. ŠMELKOVA LJ 2001 Pestovanie lesa I. Ustav pre vychovu a vzdelavanie pracovnikov LVH SR, Zvolen, Slovak Republic 136 p
42. BONNER FT, LEAK WB 2008 Fagaceae - Beech family Fagus L.
beech. In: Bonner FT, Karrfalt RP (eds) The Woody Plant Seed
Manual. USDA Forest Service's Southern Research Station, Starkville, Mississippi National Seed Laboratory, Dry Branch, Georgia, pp 520-524
43. SUSZKA B, MULLER C, BOIMET-MASIMBERT M, GORDON A 1996 Seeds of Forest Broadleaves: from Harvest to Sowing. INRA, Paris, France, 294 p
44. THOMSEN KA, KJAER ED 2002 Variation between single tree
progenies of Fagus sylvatica in seed traits, and its implications
for effective population numbers. Silvae Genet 51 (5-6):
183-190
45. WACHTER H 1964 The connexions between weather and
Beech mast years (in German). Forstarchiv 35: 69-78
46. PERRINS CM 1966 The effect of beech crops on great tit
populations and movements. Brittish Birds 59: 419-432
47. SIMAK M 1993 Beech nuts in forestry. Inst. F. skogsskötsel,
Sveriges lantbruksuniversitet (in Swedish)
48. NAKAJIMA H 2015 Estimating sound seedfall density of Fagus
crenata using a visual survey. J Forest Res 20 (1): 94-103. DOI:
https://doi.org/10.1007/s10310-014-0440-7
49. DUBRAVAC T, BOBINAC M, BARČIĆ D, NOVOTNY V, ANDRAŠEV S 2013 Growth dynamics of crown shapes in stands of
pedunculate oak and common hornbeam. Periodicum
biologorum 115(3): 331-338
50. SAS SAS/STAT® software. SAS Institute Inc., Cary, NC, USA
51. DEY DC 1995 Acorn production in red oak. For. Res.Paper
No. 127. Ontario Forest Research Institute, Sault Ste, Marie, Canada, 22 pp
52. KLIMO E, HAGER H, MATIĆ S, ANIĆ I, KULHAVÝ J 2008 Floodplain Forests of Temperate Zone of Europe. Lesnická práce, Kostelec nad Černými lesy, 623 p
53. NIELSEN PC, SCHAFFALITZKY DE, MUCKADELL M 1954 Flower
observations and controlled pollinations in Fagus. Silvae
Genet 3: 6-17
54. SORENSEN FC 1971 Estimate of self fertility in coastal Douglas
fir from inbreeding studies. Silvae Genet 20: 11-120
55. PARK YS, FOWLER DP 1982 Effects of inbreeding and genetic
variances in a natural population of tamarack (Larix laricina
(Du Roi) K. Koch) in Eastern Canada. Silvae Genet 31: 21-26
56. KORMUTAK A, LINDGREN D 1996 Mating system and empty
seeds in silver fir (Abies alba Mill.). Forest Genetics 3: 231-235
57. COLANGELI AM, OWENS JN 1990 Cone and seed development
in a wind-pollinated, western hemlock (Tsuga heterophylla)
clone bank. Can J Forest Res 20 (9): 1432-1437. DOI: https://
doi.org/10.1139/x90-189
58. O’REILLY GJ, FARMER EJ 1991 A phenotypic variation in cone and seed characteristics of tamarack in northwestern Ontario.


![CODE Intercept Hoocking DLL injection INISAFEWeb6Hoocking [kissmefox] pdf](data:image/gif;base64,R0lGODlhAQABAIAAAP///wAAACH5BAEAAAAALAAAAAABAAEAAAICRAEAOw==)