ORIGINAL RESEARCH
ADULT BRAIN
The “White Gray Sign” Identifies the Central Sulcus on 3T
High-Resolution T1-Weighted Images
XO.F. Kaneko,XN.J. Fischbein,XJ. Rosenberg,XM. Wintermark, andXM.M. Zeineh
ABSTRACT
BACKGROUND AND PURPOSE: The central sulcus is an important anatomic landmark, but most methods of identifying it rely on variable gyral and sulcal patterns. We describe and assess the accuracy of reduced gray-white contrast along the central sulcus, an observation we term the “white gray sign.”
MATERIALS AND METHODS: We conducted a retrospective review of 51 fMRIs with a T1-weighted 3D inversion recovery fast-spoiled gradient-echo and concomitant hand-motor fMRI, which served as confirmation for the location of the central sulcus. To measure gray-white contrast across the central and adjacent sulci, we performed a quantitative analysis of 25 normal hemispheres along the anterior and posterior cortices and intervening white matter of the pre- and postcentral gyri. 3D inversion recovery fast-spoiled gradient-echo axial images from 51 fMRIs were then evaluated by 2 raters for the presence of the white gray sign as well as additional established signs of the central sulcus: the bracket, cortical thickness, omega, and T signs.
RESULTS:The mean gray-white contrast along the central sulcus was 0.218 anteriorly and 0.237 posteriorly, compared with 0.320 and 0.295 along the posterior precentral and anterior postcentral sulci, respectively (P⬍.001). Both raters correctly identified the central sulcus in all 35 normal and 16 abnormal hemispheres. The white gray sign had the highest agreement of all signs between raters and was rated as present the most often among all the signs.
CONCLUSIONS: Reduced gray-white contrast around the central sulcus is a reliable sign for identification of the central sulcus on 3D inversion recovery fast-spoiled gradient-echo images.
T
he central sulcus is an important anatomic landmark that defines the location of the primary motor cortex, a region of the brain critical for all essential motor tasks. Because injury to this region has irreversible consequences and other brain regions cannot compen-sate for its loss,1it is important to clearly identify the central sulcus forsurgical planning, especially in the context of focal brain lesions. With knowledge of the location of the central sulcus, DTI and trac-tography can be used to identify the corticospinal tract emanating from the primary motor cortex. fMRI is a proven technique to iden-tify the primary motor cortex for surgical planning.2-6It is still
desir-able, however, to identify the central sulcus from structural imaging for several reasons: this can provide an estimate of the proximity of a lesion to the motor strip to determine the necessity of fMRI, guide the tasks chosen for fMRI, serve as a surrogate if fMRI is not possible
because of patient cooperation and compliance or technical factors, and assist in determining the risks of surgery.7
Numerous methods besides fMRI for identifying the central sulcus have been previously described on both CT and MR imag-ing. Most rely on identifying gyral and sulcal patterns and rela-tionships,8-13which can be variable. Others involve complex
im-age reformatting that most clinicians are untrained to produce or interpret.14,15Only a few signs, such as the difference in cortical
thickness across the central sulcus, are based on differences in the underlying cytoarchitecture of the sensorimotor cortex.16,17
His-tologic studies and postmortem ex vivo high-resolution imaging have shown that in addition to the variation of the thickness of the 6 cellular layers of the sensorimotor cortex, there are also differ-ences in myelin content that should be appreciable on MR imaging.18-21 Based on this latter histologic finding, we
de-scribe the “white gray sign,” which refers to the inherent in-creased T1 signal of the anterior and posterior cortices along the central sulcus, giving this gray matter a more white appear-ance (Fig 1). Specifically, we measure this contrast and assess the accuracy of this sign in identifying the central sulcus with reference to the criterion standard of fMRI.
Received July 1, 2016; accepted after revision September 20.
From the Department of Radiology, Neuroradiology Section, Stanford University, Stanford, California.
Please address correspondence to Michael Zeineh, MD, PhD, Stanford University, Lucas Center for Imaging Room P271, 1201 Welch Rd, Stanford, CA 94305; e-mail: mzeineh@stanford.edu
MATERIALS AND METHODS
Study PopulationUsing a retrospective institutional review board–approved re-view, we identified 51 fMRI examinations from January 2014 to December 2015. We only analyzed 1 hemisphere per patient for which hand-motor fMRI was available. Patient ages ranged from 20 –70 years (mean, 42.5 years) and 27 women and 24 men were included. Of the 51 hemispheres examined, 35 were morpholog-ically normal (normal hemispheres were functionally evaluated either for cryptogenic epilepsy surgical planning or as a reference for contralateral pathology). A separate 16 hemispheres had le-sions that affected the sensorimotor region of the analyzed hemi-sphere. Pathologies included AVM (n⫽8), encephalomalacia (n⫽3), neoplasm (n⫽2), cavernous malformation (n⫽2), and cyst (n⫽1). In all hemispheres with pathology, fMRI was per-formed for presurgical planning for eloquent cortex lateralization and/or localization.
Imaging Protocol
Each study was performed at 3T and consisted of 1) a 1.0-mm isotropic 3D inversion recovery fast-spoiled gradient-echo se-quence (axial 3D; TR, 9.2 ms; TE, 3.7 ms; TI, 400 ms; matrix, 256⫻256 ⫻164; field of view, 24 cm⫻24 cm⫻ 16.4 cm;
in-plane acceleration, 2; 4 minutes, 13 seconds), and 2) an fMRI motor task consisting of 12 blocks of 10 seconds of finger tapping alternating with 10 seconds of rest (2D gradient-echo, echo-pla-nar imaging; TR, 2500 ms; TE, 35 ms; 3-mm section thickness; 20-cm field of view; 64⫻64 matrix size). Both sequences were processed to produce hand-motor activation maps thresholded at a T-score of 2–3 by using DynaSuite Neuro 3.1 (Invivo, Gaines-ville, Florida). Functional images were interpreted on a PACS workstation.
Quantitative Analysis of the White Gray Sign
Twenty-five of the normal hemisphere structural MRIs were seg-mented using ITK-SNAP (www.itksnap.org).22Using the fMRI as
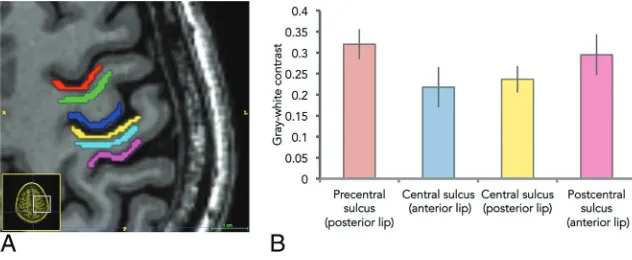
the reference for the central sulcus, on a single axial section at the level of the upper centrum semiovale, we manually segmented the follow-ing cortical regions of interest sequentially from anterior to posterior (Fig 2): cortex along the posterior bank of the precentral sulcus, cor-tex along the anterior bank of the central sulcus, corcor-tex along the posterior bank of the central sulcus, and cortex along the anterior bank of the postcentral sulcus. For gray-white contrast computation, we manually segmented the white matter within the intervening pre-central and postpre-central gyri. All segmentations for both the cortices and the WM were at least 30 pixels in volume and thinned to avoid partial volume effect due to averaging with adjacent structures.
Gray-white contrast for the 4 cortical regions was calculated by: (Subjacent WM average signal intensity⫺GM average signal inten-sity) / (Subjacent WM average signal inteninten-sity). A Studentttest com-pared gray-white contrast differences between the precentral sulcus and central sulcus and between the central sulcus and postcentral sulcus using STATA (StataCorp, College Station, Texas).
Qualitative Analysis of the White Gray Sign
To test the performance of the white gray sign clinically and to compare that performance with previously described methods for identifying the central sulcus, 51 hemispheres from fMRI exami-nations were analyzed. Both normal (including the aforemen-tioned 25 fMRIs) and abnormal hemispheres were analyzed.
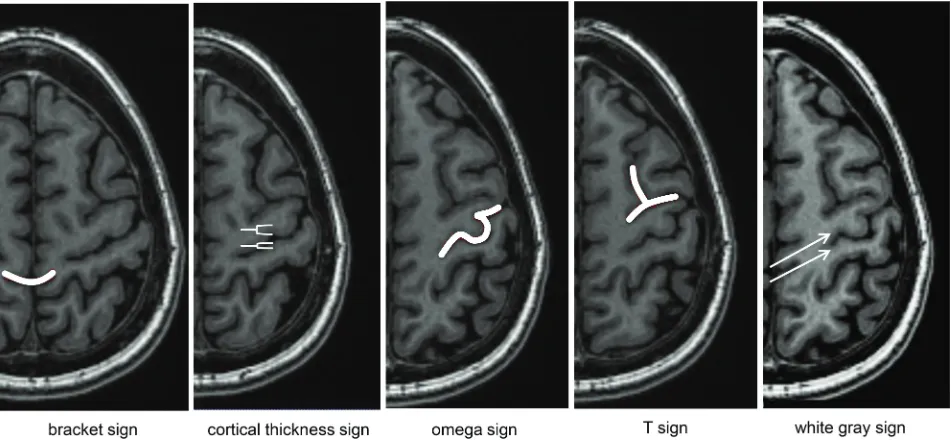
Two readers (M.W., N.J.F.) with 16 and 26 years of neurora-diology experience, respectively, evaluated the 51 hemispheres for the presence or absence of the white gray sign as well as the bracket, cortical thickness difference, omega, and T signs (Fig 3). The raters were blinded to the func-tional data. The following rating scale was used: 1⫽sign definitely not present; 2⫽sign likely not present; 3⫽sign likely present; and 4⫽sign definitely present. Each rater also annotated the putative sul-cus, and accuracy was confirmed by a co-author (O.F.K.) with the fMRI hand-mo-tor activation maps.
The 1– 4 scale was then dichotomized to summarize the presence or absence of the individual signs (ie, 1–2⫽not present; 3– 4⫽present). Rater agreement was as-sessed by summing the number of patients in which they agreed on a sign being pres-ent or abspres-ent divided by the total number of patients.
FIG 1. The “white gray sign.” Axial high-resolution 3D inversion recov-ery fast-spoiled gradient-echo T1-weighted image demonstrates de-creased gray-white contrast of the anterior and posterior cortices along the central sulcus (white arrow).
[image:2.594.52.287.337.486.2] [image:2.594.55.371.541.671.2]Statistical Analysis
Systematic disagreement between raters was assessed by a symme-try test, with a Bonferroni-corrected threshold of 0.01 for the 5 tests evaluated. Differences in presence of the white gray sign compared with the other signs across all hemispheres were tested for each rater by using a McNemar test, with a Bonferroni-cor-rected threshold of 0.0125 to correct for the 4 comparisons be-tween signs. For cases in which the white gray sign outperformed another sign, a subsequent post hoc analysis did the same com-parison separately for normal and abnormal hemispheres, with a Bonferroni-corrected threshold of 0.025.
RESULTS
Quantitative Analysis of Gray-White Contrast around the Central Sulcus
On axial T1-weighted 3D inversion recovery fast-spoiled gradi-ent-echo images of the 25 normal hemispheres, the mean gray-white contrast along the central sulcus was 0.218⫾0.0356 ante-riorly and 0.237 ⫾0.0457 posteriorly compared with 0.320⫾ 0.0318 and 0.295⫾0.0485 along the precentral and postcentral sulci, respectively (Fig 2B). Differences in gray-white contrast were statistically significant, with P values of⬍.001. In all 25 hemispheres tested, the gray-white contrast was lower along the
anterior bank of the central sulcus com-pared with the neighboring posterior bank of the precentral gyrus. In 23/25 (92%) cases, the contrast was lower along the posterior bank of the central sulcus compared with the neighboring anterior bank of the postcentral sulcus.
Qualitative Analysis of the White Gray Sign and Other Signs of the Central Sulcus
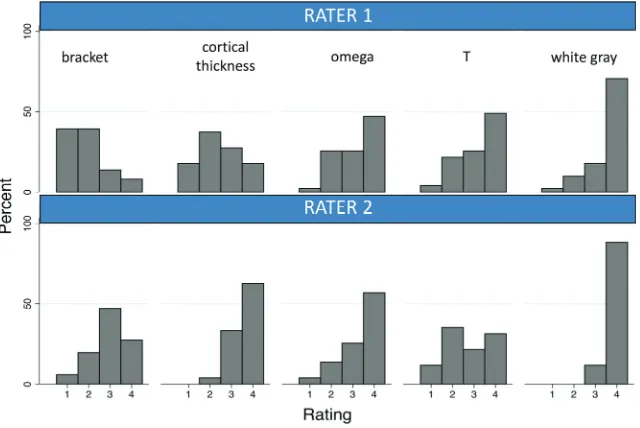
For the rater analyses of the 51 hemi-spheres, both raters correctly identified the central sulcus in all 35 normal and 16 abnormal hemispheres. Rater agreement for the bracket, cortical thickness, omega, T, and white gray signs was 43.1%, 45.1%, 74.5%, 62.8%, and 88.3%, respectively. The symmetry test was significant for the bracket and thickness signs (bothP⬍.001), suggesting a systematic difference between raters in scores for these signs (Fig 4). The asymmetry was not statistically significant for the omega, T, and white gray signs, withPvalues of .267, .019, and .031, respectively. The white gray sign was reported statistically significantly more often than the following signs across all hemispheres: the bracket sign for both raters, the thickness sign for rater 1, and the omega and T signs for rater 2 (Table,Fig 4). The post hoc analysis of normal hemispheres showed that these differences held for the bracket sign for both raters, the thickness sign for rater 1, and the omega and T signs for rater 2.
For those 16 hemispheres that contained lesions affecting the central sulcus, rater 1 found the white gray sign in all 16 spheres, whereas rater 2 found the white gray sign in 11/16 hemi-spheres. An example lesion extending to the precentral gyrus does not interfere with the correct identification of the white gray sign (Fig 5). Performance of the additional signs for the abnormal hemispheres was as follows: bracket (rater 1, 2/16; rater 2, 10/16), FIG 3. Signs of the central sulcus rated in this study. Bracket⫽central sulcus points to the marginal sulcus. Cortical thickness⫽increased cortical thickness along the anterior compared with posterior bank of the central sulcus. Omega⫽characteristic omega shape of the hand-motor knob. T⫽superior frontal sulcus meets the precentral gyrus.
Comparison of the white gray sign with other signs of the central sulcusa
Hemispheres White Gray Bracket Thickness Omega T Rater 1 51 45 11 (⬍.001)b 23 (⬍.001)b 37 (.022) 38 (.092)
35 normal 34 9 (⬍.001)b 15 (⬍.001)b 26 28
16 abnormal 11 2 (.004)b 8 (.375) 11 10
Rater 2 51 51 38 (⬍.001)b 49 (.500) 42 (.004)b 27 (⬍.001)b
35 normal 35 28 (.016)b 35 28 (.016)b 20 (⬍.001)b
16 abnormal 16 10 (.031) 14 14 (.500) 7 (⬍.004)b
a
Proportion of cases where each sign was reported, each compared with the white gray sign within rater. For the comparison of both hemispheres, a Bonferroni-adjustedPvalue of⬍.0125 was statistically significant correcting for the 4 signs evaluated. For the post-hoc separate evaluation of normal and abnormal hemispheres, the corrected threshold isP⬍.025.
b
[image:3.594.55.531.47.267.2]cortical thickness (8/16, 14/16), omega sign (11/16, 14/16), and T sign (10/16, 7/16). The post hoc analysis of abnormal hemispheres showed that the white gray sign was reported statistically signifi-cantly more often than the bracket sign for rater 1 and the T sign for rater 2.
DISCUSSION
We describe an additional reliable central sulcus sign that is based upon the physiologic high T1 signal of the cortices along the cen-tral sulcus and, consequently, the decreased contrast with the ad-jacent WM. It is likely that the relatively increased T1 signal dem-onstrated on high-resolution inversion recovery fast-spoiled gradient-echo images is reflective of the increased myelin content of this tissue. Previously described differences in signal of the
motor cortex on T2-FLAIR are also likely secondary to these differences in the underlying myeloarchitecture.23,24
Thus, increased cortical thickness along the anterior bank of the central sulcus, in combination with the increased T1 sig-nal within the cortex along both sides of the central sulcus, are together 2 distinct imaging markers for cytoarchitecture and myeloarchitecture that are likely to be robust for anatomic delineation.
There are several limitations to the current study. At our institution, all functional MR imaging examinations are performed at 3T; therefore, both the quantitative and qualitative portions of this study were also based only on 3T images, and we cannot assess if this sign would perform similarly at 1.5T. Al-though some volume averaging with the adjacent WM could occur in the cortical segmentations, in particular along the relatively thin posterior bank of the cen-tral sulcus, care was taken to confine the segmentations to cortices. Differences in gray-white contrast were only measured in normal hemispheres. Although the same relationship may not persist in the presence of local edema near a lesion, we have found that qualitatively, the white gray sign is identifiable along the en-tirety of the central sulcus, and this matches other imaging data regarding myelination along the central sulcus.25
Regarding the rating portion of the study, both raters accurately identified the central sulcus in all 51 cases; how-ever, it was not determined by which method they came to that conclusion. The 2 raters did not perfectly agree on all the signs, suggesting that these signs can all be subjective and dependent on fac-tors such as reader training. Neverthe-less, the white gray sign had the highest agreement and scored the highest among both raters in both normal and pathologic hemi-spheres. Future studies can evaluate the conspicuity of this finding on sequences other than T1-weighted inversion recovery fast-spoiled gradient-echo, the extension of this finding to other pri-mary cortices, and the relationship with developmental aspects of myelination along the central sulcus.
CONCLUSIONS
We have shown that inherent differences in T1 signal of the cor-tices along the central sulcus lead to discrete and appreciable dif-ferences in gray-white contrast. Clinically, the “white gray sign” is a reliable method for identifying the central sulcus, which was FIG 4. Rater evaluation of signs of the central sulcus in 51 hemispheres (35 normal, 16 with
pathology). 1⫽definitely not present, 2⫽likely not present, 3⫽likely present, 4⫽definitely present.
[image:4.594.56.376.47.261.2] [image:4.594.54.379.307.488.2]found to be present in the highest proportion of cases compared with other previously described and well-known signs. Anatomic imaging methods that take advantage of knowledge of underlying cyto- and myeloarchitecture are powerful tools for determining functional segregation of brain structure.
Disclosures: Max Wintermark—UNRELATED:Board Membership: GE Healthcare and National Football League Advisory Board. Michael Zeineh—UNRELATED:Other: GE Healthcare,Comments: research funding.* *Money paid to the institution.
REFERENCES
1. Miyai I, Suzuki T, Kang J, et al.Middle cerebral artery stroke that includes the premotor cortex reduces mobility outcome.Stroke
1999;30:1380 – 83CrossRef Medline
2. Hingwala D, Thomas B, Radhakrishnan A, et al.Correlation between anatomic landmarks and fMRI in detection of the sensorimotor cortex in patients with structural lesions.Acta Radiol 2014;55: 107–13CrossRef Medline
3. Lehe´ricy S, Duffau H, Cornu P, et al.Correspondence between func-tional magnetic resonance imaging somatotopy and individual brain anatomy of the central region: comparison with intraopera-tive stimulation in patients with brain tumors.J Neurosurg2000;92: 589 –98CrossRef Medline
4. Morioka T, Mizushima A, Yamamoto T, et al.Functional mapping of the sensorimotor cortex: combined use of magnetoencephalogra-phy, functional MRI, and motor evoked potentials.Neuroradiology
1995;37:526 –30CrossRef Medline
5. Morioka T, Yamamoto T, Mizushima A, et al.Comparison of mag-netoencephalography, functional MRI, and motor evoked poten-tials in the localization of the sensory-motor cortex.Neurol Res
1995;17:361– 67Medline
6. Wengenroth M, Blatow M, Guenther J, et al.Diagnostic benefits of presurgical fMRI in patients with brain tumours in the primary sensorimotor cortex.Eur Radiol2011;21:1517–25CrossRef Medline 7. Due-Tonnessen P, Rasmussen I, Berntsen EM, et al.Identifying the central sulcus in patients with intra-axial lesions: a multicenter study comparing conventional presurgical MRI to topographical analysis and BOLD-fMRI. J Comput Assist Tomogr2014;38:1– 8 CrossRef Medline
8. Naidich TP, Blum JT, Firestone MI.The parasagittal line: an ana-tomic landmark for axial imaging.AJNR Am J Neuroradiol2001;22: 885–95Medline
9. Rodrigues T, Rodrigues M, Paz D, et al.Is the omega sign a reliable landmark for the neurosurgical team? An anatomical study about the central sulcus region.Arq Neuropsiqiatr2015;73:934 –38CrossRef Medline
10. Sobel DF, Gallen CC, Schwartz BJ, et al.Locating the central sulcus: comparison of MR anatomic and magnetoencephalographic func-tional methods.AJNR Am J Neuroradiol1993;14:915–25Medline 11. Yousry TA, Schmid UD, Alkadhi H, et al.Localization of the motor
hand area to a knob on the precentral gyrus. A new landmark.Brain
1997;120(Pt 1):141–57CrossRef Medline
12. Yousry TA, Schmid UD, Schmidt D, et al.The central sulcal vein: a landmark for identification of the central sulcus using functional magnetic resonance imaging.J Neurosurg1996;85:608 –17CrossRef Medline
13. Naidich TP, Valavanis AG, Kubik S.Anatomic relationships along the low-middle convexity: part I–normal specimens and magnetic resonance imaging.Neurosurgery1995;36:517–32CrossRef Medline 14. Hattingen E, Good C, Weidauer S, et al.Brain surface reformatted images for fast and easy localization of perirolandic lesions.J Neu-rosurg2005;102:302–10CrossRef Medline
15. Wagner M, Jurcoane A, Hattingen E.The U sign: tenth landmark to the central region on brain surface reformatted MR imaging.AJNR Am J Neuroradiol2013;34:323–26CrossRef Medline
16. Biega TJ, Lonser RR, Butman JA.Differential cortical thickness across the central sulcus: a method for identifying the central sulcus in the presence of mass effect and vasogenic edema.AJNR Am J Neuroradiol2006;27:1450 –53Medline
17. Meyer JR, Roychowdhury S, Russell EJ, et al.Location of the central sulcus via cortical thickness of the precentral and postcentral gyri on MR.AJNR Am J Neuroradiol1996;17:1699 –706Medline 18. Dinse J, Ha¨rtwich N, Waehnert MD, et al.A cytoarchitecture-driven
myelin model reveals area-specific signatures in human primary and secondary areas using ultra-high resolution in-vivo brain MRI.
Neuroimage2015;114:71– 87CrossRef Medline
19. Geyer S, Weiss M, Reimann K, et al.Microstructural parcellation of the human cerebral cortex - from Brodmann’s post-mortem map to in vivo mapping with high-field magnetic resonance imaging.Front Hum Neurosci2011;5:19CrossRef Medline
20. Annese J, Pitiot A, Dinov ID, et al.A myelo-architectonic method for the structural classification of cortical areas.Neuroimage2004;21: 15–26CrossRef Medline
21. Nieuwenhuys R, Broere CA, Cerliani L.A new myeloarchitectonic map of the human neocortex based on data from the Vogt-Vogt school.Brain Struct Funct2015;220:2551–73CrossRef Medline 22. Yushkevich PA, Piven J, Hazlett HC, et al.User-guided 3D active
contour segmentation of anatomical structures: significantly im-proved efficiency and reliability. Neuroimage 2006;31:1116 –28 CrossRef Medline
23. Kakeda S, Korogi Y, Kamada K, et al.Signal intensity of the motor cortex on phase-weighted imaging at 3T.AJNR Am J Neuroradiol
2008;29:1171–75CrossRef Medline
24. Kamada K, Kakeda S, Ohnari N, et al.Signal intensity of motor and sensory cortices on T2-weighted and FLAIR images: intraindi-vidual comparison of 1.5T and 3T MRI.Eur Radiol2008;18:2949 –55 CrossRef Medline
indenophanyl]diruthenium(II)](data:image/gif;base64,R0lGODlhAQABAIAAAP///wAAACH5BAEAAAAALAAAAAABAAEAAAICRAEAOw==)