http://www.scirp.org/journal/wjet ISSN Online: 2331-4249 ISSN Print: 2331-4222
DOI: 10.4236/wjet.2018.61010 Feb. 27, 2018 176 World Journal of Engineering and Technology
Three-Dimensional Thermo-Elastic-Plastic
Finite Element Method Modeling for Predicting
Weld-Induced Residual Stresses and Distortions
in Steel Stiffened-Plate Structures
Myung Su Yi
1,2, Chung Min Hyun
2, Jeom Kee Paik
1,3,4*1Department of Naval Architecture and Ocean Engineering, Pusan National University, Busan, Korea 2Central Research Institute, Samsung Heavy Industries Co., Ltd., Geoje, Korea
3The Korea Ship and Offshore Research Institute (The Lloyd’s Register Foundation Research Centre of Excellence), Pusan National
University, Busan, Korea
4Department of Mechanical Engineering, University College London, London, UK
Abstract
The objective of the present paper is to develop nonlinear finite element method models for predicting the weld-induced initial deflection and resi-dual stress of plating in steel stiffened-plate structures. For this purpose, three-dimensional thermo-elastic-plastic finite element method computations are performed with varying plate thickness and weld bead length (leg length) in welded plate panels, the latter being associated with weld heat input. The finite element models are verified by a comparison with experimental data-base which was obtained by the authors in separate studies with full scale measurements. It is concluded that the nonlinear finite element method mod-els developed in the present paper are very accurate in terms of predicting the weld-induced initial imperfections of steel stiffened plate structures. Details of the numerical computations together with test database are documented.
Keywords
Steel Stiffened-Plate Structures, Weld-Induced Initial Distortion, Weld-Induced Residual Stress, Nonlinear Finite Element Method, Three-Dimensional Ther-mo-Elastic-Plastic Finite Element Analysis, Full Scale Measurements
1. Introduction
Ships and offshore structures are fabricated by welding and thus weld-induced How to cite this paper: Yi, M.S., Hyun, C.M.
and Paik, J.K. (2018) Three-Dimensional Thermo-Elastic-Plastic Finite Element Me-thod Modeling for Predicting Weld-Induced Residual Stresses and Distortions in Steel Stiffened-Plate Structures. World Journal of Engineering and Technology, 6, 176-200.
https://doi.org/10.4236/wjet.2018.61010
Received: December 18, 2017 Accepted: February 24, 2018 Published: February 27, 2018
Copyright © 2018 by authors and Scientific Research Publishing Inc. This work is licensed under the Creative Commons Attribution International License (CC BY 4.0).
http://creativecommons.org/licenses/by/4.0/
DOI: 10.4236/wjet.2018.61010 177 World Journal of Engineering and Technology initial imperfections in the form of initial distortions and residual stresses are unavoidable. It is required to predict the weld-induced initial imperfections in magnitude and pattern in association with structural design and construction.
A large number of studies are found in the literature. In recent years, these studies are associated with weld-induced initial distortions [1] [2] [3] [4] [5] and welding-induced residual stresses [6] [7] [8] [9] [10]. Figure 1 shows typical modes of weld-induced initial distortions in plated structures [11] [12].
Simplified methods to predict weld-induced initial distortions are available in the literature [13]-[18]. However, weld-induced initial imperfections are affected by various parameters such as weld joint details, plate thickness, thickness tran-sition (when the joint consists of plates with different thicknesses), stiffener spacing, numbers of attachments, corrugated constructions, mechanical restraint
conditions, assembly sequences and overall construction planning [19]. In this
regard, more refined method is still required to accurately predict them. Nonlinear finite element method is a powerful tool to predict the weld-induced initial imperfections as it can deal with the distribution of heat transfer and
gen-eral deformation due to welding. Ueda and Murakawa [20] undertook a
pioneer-ing work uspioneer-ing two-dimensional finite element method to predict weld-induced residual stresses. Lindgrean and Karlsson [21] are the first to use three-dimensional finite element method for predicting weld-induced residual stresses. Chen and
Guedes Soares [22] also used the three-dimensional finite element method to
[image:2.595.128.537.427.709.2]predict the weld-induced residual stresses with a validation by a comparison with test database on small scale models.
DOI: 10.4236/wjet.2018.61010 178 World Journal of Engineering and Technology Studies on predicting the weld-induced initial distortions using finite element method are also found in the literature [23]-[28]. It was realized from the studies that the computing times are very expensive, and thus simplified methods using inherent strain have been suggested [27] [29] [30]. Michaleris and DeBiccari [31]
developed a useful method to predict weld-induced distortions of large and complex structures, where two-dimensional thermal analysis was performed while three-dimensional structural analysis was undertaken. Regardless of the useful contributions in the literature, more efforts are still required for predict-ing the weld-induced initial imperfections of ships and offshore structures in association with welding and repair methods as well as robust design [32].
And, studies on repair welding using finite element method and experiment are also found in the literature [33] [34] [35].
In this paper, a three-dimensional thermo-elastic-plastic finite element me-thod model is developed to predict the weld-induced distortions and residual stresses of thin-walled structures while achieving the goals in resulting accuracy and computational cost. The validity of the method is confirmed by a compari-son with test database separately obtained from the full scale measurements by the authors.
2. Finite Element Modeling for Predicting the Weld-Induced
Residual Stresses
In this section, the finite element model is presented to predict the weld-induced residual stresses. The three-dimensional thermo-elastic-plastic finite element analysis method is applied.
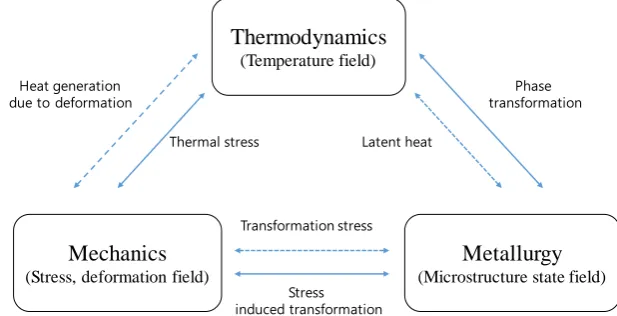
DOI: 10.4236/wjet.2018.61010 179 World Journal of Engineering and Technology above, the features of the welding problem requires consideration of many
physical phenomena. Figure 2 shows the form of the connection between
ther-mal, mechanical and metallurgical processes for the phenomena occurring dur-ing the welddur-ing process. This method is used to analyze the weld-induced resi-dual stress.
The validation of the finite element model is made by a comparison with test
database obtained by Paik and Yi [36]. The MSC/MARC computer program [37]
is used for computations in the present study.
2.1. Modeling of Heat Source
As heat source moves associated with welding, the heat input can change
accor-dingly. Rosenthal [38] suggested a model to simulate the moving heat source
al-though the distribution of heat input was not considered due to the change of heat source. Goldak et al. [39] suggested a model to consider thermal distribu-tion through moving heat source using Gaussian surface or double-ellipsoidal distributions. For welding with low depth of penetration, the Gaussian surface distribution model is well more suitable to apply. However, as the weld penetra-tion becomes deep like in shipbuilding industry practice, heat transfer is of sig-nificance in the thickness direction. In this case, the double-ellipsoidal distribu-tion model is more suitable.
Figure 3 presents the configuration of the heat source distribution with a double ellipsoidal shape. The heat flux for the first half-ellipsoidal internal area located at the front of the welding arc can then be defined as follows:
(
)
22 22 226 3 3 3 3
, , exp exp exp
π π f f
f f
f Q x y z
q x y z
a b c
abc
− − −
=
(1)
at z≥0
where qf
(
x y z, ,)
is the heat flux for the first half-ellipsoidal internal area lo-cated at the front of the welding arc, ff is the heat input proportion in thefront part, Q is the heat flux of arc which is taken as Q=
η
IU, a b, and cf [image:4.595.216.525.548.706.2]are geometric parameters, and η is the arc efficiency, I is the current and U is
Figure 2. Schematic diagram coupling between temperature, microstructure and stress.
Thermodynamics
(Temperature field)Mechanics
(Stress, deformation field)Metallurgy
(Microstructure state field) Heat generationdue to deformation
Phase transformation
Thermal stress Latent heat
Transformation stress
DOI: 10.4236/wjet.2018.61010 180 World Journal of Engineering and Technology Figure 3. Definition of geometric parameters for the heat source distribution with a double-ellipsoidal shape [39].
the voltage. x, y and z are the coordinate where the origin is located on the weld surface below the heat source as shown in Figure 2.
The arc efficiency η is defined as the ratio of the heat transferred from the arc to the base material and the total heat generated by the arc, which is a con-stant simply indicative of the complex heat loss between the substrates in the arc. Since the arc efficiency is influenced by various factors such as welding condi-tions, melting depth and protective gas, it is very challenging to predict it theo-retically and it is usually determined experimentally. This is because the arc effi-ciencies given in the literature are somewhat different from each other. For flux cored arc welding considered in the present method, η =0.75 is usually taken. The heat flux at any point
(
x y z, ,)
in the second semi-ellipsoid covering the rear part of the arc can be defined as follows:(
)
22 22 226 3 3 3 3
, , exp exp exp
π π
r r
r r
f Q x y z
q x y z
a b c
abc
− − −
=
(2)
at z<0
where qr
(
x y z, ,)
is the heat flux at any point(
x y z, ,)
in the second semi-ellipsoid covering the rear part of the arc, cr is the geometric parameter,and fr is the heat input proportion in the rear part. It is realized that
2
f r
f + f = is approximately taken as far as the following conditions are satisfied:
(
2)
,(
2)
1 1
f r
r f f r
f f
c c c c
= =
+ + (3)
2.2. Geometric Properties
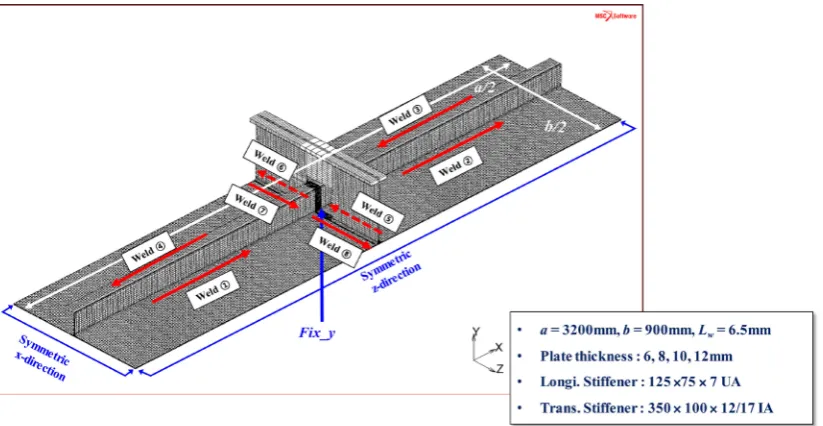
Figure 4 shows a steel stiffened-plate structure which is extracted from living quarter structures of a very large crude oil carrier (VLCC) class floating, produc-tion, storage and offloading (FPSO) unit which is used for the production of oil in deep water. Typically, the longitudinal stiffener spacing (plate breadth) is in
Q
z
x
y
a
b cr
DOI: 10.4236/wjet.2018.61010 181 World Journal of Engineering and Technology the range of 800 - 1000 mm, the transverse stiffener spacing (plate length) is in the range of 1800 - 3600 mm, and the plate thickness is in the range of 6 - 13 mm.
Paik and Yi [36] measured the weld-induced residual stresses of the structure shown in Figure 4 where angle type longitudinal stiffener and T type transverse stiffener as shown in Figure 5 are used. Table 1 indicates the overall dimensions of the test structures. The weld-induced residual stresses for a total of four structures were measured with varying the plate thickness. It was noted that 1/2 + 1 + 1/2 bay structure model could minimize the interacting effect of adjacent plate panels. While details of the measurements are referred to in Paik and Yi
[36], the finite element model presented in this paper is validated by a compari-son with the measurements. A quarter of the structure is taken as the extent of
the present finite element analysis for the geometric symmetry as shown in
[image:6.595.209.536.284.372.2]Fig-ure 4. Table 1 indicates the geometric properties of the structures where the
Figure 4. A steel stiffened-plate structure to measure the weld-induced residual stresses [36].
[image:6.595.239.505.407.555.2](a) (b)
Figure 5. Types of stiffeners used in the test structures [36]. (a) Transverse stiffener; (b) Longitudinal stiffener.
Table 1. Dimensions of the test structures considered [33].
Type [mm] a [mm] b tp
[mm] [mm] Lw Stiffener Type [mm] hw [mm] tw [mm] bf [mm] tf
Deck 3200 800 6
6.5
Longi. 125 7 75 7
8 10
Trans. 350 12 100 17 12
Note: Lw indicates the weld bead length (leg length of welding).
Trans. stiffeners
a/2 a a/2
[image:6.595.209.541.616.709.2]DOI: 10.4236/wjet.2018.61010 182 World Journal of Engineering and Technology plate thickness is varied as 6, 8, 10 and 12 mm.
[image:7.595.129.539.333.741.2]2.3. Material Properties
Table 2 indicates the mechanical properties of material at room temperature. During welding, the material properties greatly change with elevated tempera-tures as described in Figure 6 [40]. It is noted that the minimum requirement of the yield strength specified by classification societies is 235 MPa for mild steel which is used for construction of the living quarter structures, but the actual yield strength of 309 MPa is used for the finite element analysis in the present study.
Table 2. Mechanical properties of steel at room temperature used for the living quarter structures.
Kind of material E [GPa] σY [MPa] σu [MPa] ν [−] Elongation [mm/mm]
Mild A 203 309 458 0.3 0.23
Note: E is the elastic modulus, σY is the yield strength, σu is the ultimate tensile strength, and ν is the Pois-son’s ratio. (a) 0 50 100 150 200 250
0 500 1000 1500 2000 2500 3000
Young's Modulus Youn g's Modulu s[ G Pa] Temperature[˚C] 0 50 100 150 200 250 300 350
0 500 1000 1500 2000 2500 3000
Yield Strength Yiel d S tre ngth[MPa] Temperature[˚C] 0 5 10 15 20 25
0 500 1000 1500 2000 2500 3000
Thermal Expansion Th ermal Exp ansion [1X10 -6 /K] Temperature[˚C] 0.2 0.25 0.3 0.35 0.4 0.45 0.5 0.55
0 500 1000 1500 2000 2500 3000
Poisson's Ratio
Poisson
's Ratio
DOI: 10.4236/wjet.2018.61010 183 World Journal of Engineering and Technology (b)
Figure 6. Mechanical and thermal properties [40]. (a) Mechanical properties; (b) Thermal properties.
2.4. Thermal Loading Load and Boundary Conditions
As mentioned earlier, a quarter model of the target structure is applied as the
extent of the finite element analysis as shown in Figure 4 in association with
the symmetric condition. Figure 7 shows the sample model of the
ther-mo-elastic-plastic finite element analysis together with loading and boundary conditions where the welding sequence is divided into 8 zones in the same order as the actual welding sequence. The structure is modelled using eight-node 3D brick thermal-mechanical finite elements or Solid 7 (full integration type) ele-ments which treat plasticity, hyper-elasticity, stress stiffening, creep, large def-lection, and large strain capabilities [37].
Welding heat input is applied using the dual heat source model where thermal loading and boundary conditions with convection and radiation are allocated. With convective conditions, the related constants depending on elevated tem-perature are defined from the database obtained from experiments and compu-tational fluid dynamics simulations [41]. Figure 8 shows the variation of the temperature-dependent convection coefficient values [41].
Table 3 indicates the heat input defined from welding parameters associated with weld bead length applied in the present study. Table 4 gives the values of double ellipsoidal moving source model [22].
2.5. Computed Results and Discussion
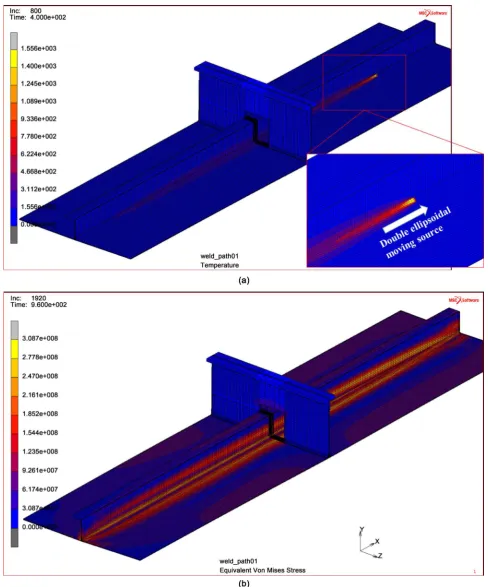
Figure 9(a) shows the process of the moving heat source and resulting
temper-ature distributions when welding is performed at the second weld zone. Figure
9(b) shows the equivalent von Mises stress distribution for the structure with a plate thickness of 6 mm after welding and cooling are completed.
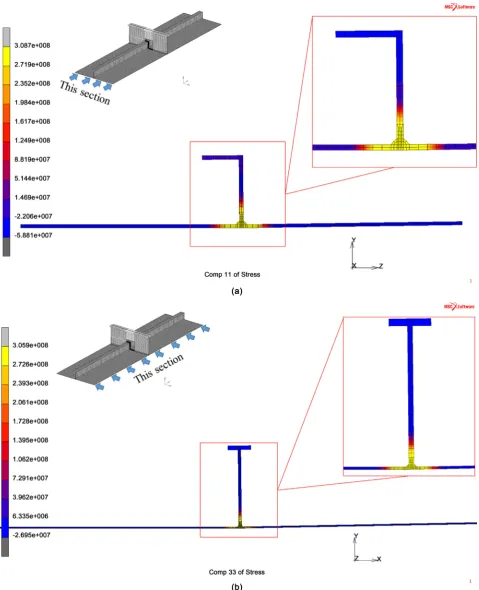
Figure 10 shows the residual stress perpendicular to the weld line in relation to the section surface in the direction of each stiffener for a 6 mm thickness model.
200 400 600 800 1000 1200 1400 1600
0 500 1000 1500 2000 2500 3000
Specific Heat
S
p
ecific He
a
t[J/K
g
K]
Temperature[˚C]
0 50 100 150
0 500 1000 1500 2000 2500 3000
Thermal Conductivity
Th
ermal Cond
u
ctivity[J/smK]
DOI: 10.4236/wjet.2018.61010 184 World Journal of Engineering and Technology Figure 7. Thermal loading and boundary conditions for a quarter model of the structure.
Figure 8. Variation of the temperature-dependent convection coefficient [41].
Table 3. Welding parameter for leg length.
Leg length
[mm] Current [A] Voltage [V] [CPM] Speed [mm/s] Speed Heat input [KJ/mm]
6.5 320 32 36 6.0 1.71
Table 4. Values of the double ellipsoidal heat source model [22].
a [mm] b [mm] cf [mm] cf [mm] ff fr
4 4 4 16 0.4 1.6
2 4 6 8 10 12 14 16
0 500 1000 1500 2000 2500 3000
Convection Coefficient
Convection
C
oe
ff
icien
t[J/sm
2 K]
DOI: 10.4236/wjet.2018.61010 186 World Journal of Engineering and Technology Figure 10. Computed results of welding-induced residual stresses in transverse and longitudinal directions. (a) Distribution of residual stress in the transverse direction section with tp= 6 mm. (b) Distribution of residual stress in the longitudinal direction
DOI: 10.4236/wjet.2018.61010 187 World Journal of Engineering and Technology The observed residual stress distribution is typically characterized by a high ten-sile stress near the weld bead and a distribution of compressive stress as it moves away from the weld.
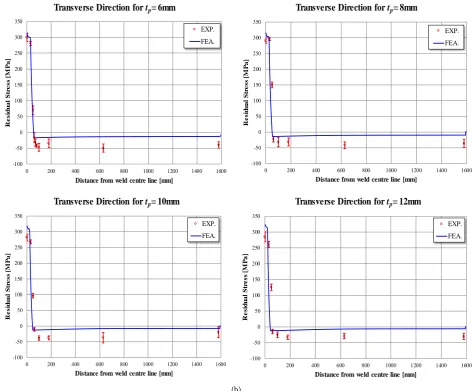
2.6. Comparison with Test Data
Paik and Yi [36] performed the experiment to obtained test database of the
welding-induced residual stresses in a full scale prototype structure. Figure 11
compares the experiments and the present computations. It is obvious that the welding-induced residual stresses are affected by plate thickness. With increase in the plate thickness, the compressive residual stresses decrease. It is also found that the magnitude of tensile residual stresses developed in the heat-affected zone reaches the material yield stress. The breadth of the heat-affected zone tends to decrease as the plate thickness increases for the same heat input. This may be due to the fact that the thermal load due to heat transfer is increased in the plate thickness direction and subsequently the magnitude of compressive re-sidual stresses tends to decrease with increase in the plate thickness.
(a) -150 -100 -50 0 50 100 150 200 250 300 350
0 50 100 150 200 250 300 350 400
R e si d u a l S tr e ss [M P a ]
Distance from weld centre line [mm]
8t_Longitudinal Direction
EXP. FEA. -150 -100 -50 0 50 100 150 200 250 300 3500 50 100 150 200 250 300 350 400
R e si d u a l S tr e ss [M P a ]
Distance from weld centre line [mm]
6t_Longitudinal Direction
EXP.
FEA.
Longitudinal Direction for tp= 6mm Longitudinal Direction for tp= 8mm
-100 -50 0 50 100 150 200 250 300 350
0 50 100 150 200 250 300 350 400
R e si d u a l S tr e ss [M P a ]
Distance from weld centre line [mm] 10t_Longitudinal Direction EXP. FEA. -100 -50 0 50 100 150 200 250 300 350
0 50 100 150 200 250 300 350 400
R e si d u a l S tr e ss [M P a ]
Distance from weld centre line [mm] 12t_Longitudinal Direction
EXP.
FEA.
DOI: 10.4236/wjet.2018.61010 188 World Journal of Engineering and Technology (b)
Figure 11. Comparison between the experiment and the computations. (a) Comparison of residual stresses in the longitudinal direction; (b) Comparison of residual stresses in the transverse direction.
It is concluded that the present finite element analysis model gives very good agreements with test database.
3. Finite Element Modelling for Predicting the Weld-Induced
Distortions
In this section, the finite element model is presented to predict the weld-induced distortions. The thermal buckling analysis method is applied. The validation of the finite element model is made by a comparison with test database obtained
from Paik and Yi [36]. The MSC/MARC computer program [37] is used for
computations in the present study.
3.1. Procedure of the Analysis
Figure 12 presents the procedure for the nonlinear finite element analysis to predict the weld-induced distortions comprising 3 steps [42]. In step I, the welding
-100 -50 0 50 100 150 200 250 300 350
0 200 400 600 800 1000 1200 1400 1600
R e si d u a l S tr e ss [M P a ]
Distance from weld centre line [mm]
6t_Transverse Direction
EXP. FEA. -100 -50 0 50 100 150 200 250 300 3500 200 400 600 800 1000 1200 1400 1600
R e si d u a l S tr e ss [M P a ]
Distance from weld centre line [mm] 8t_Transverse Direction
EXP.
FEA.
Transverse Direction for tp= 6mm Transverse Direction for tp= 8mm
-100 -50 0 50 100 150 200 250 300 350
0 200 400 600 800 1000 1200 1400 1600
R e si d u a l S tr e ss [M P a ]
Distance from weld centre line [mm] 10t_Transverse Direction EXP. FEA. -100 -50 0 50 100 150 200 250 300 350
0 200 400 600 800 1000 1200 1400 1600
R e si d u a l S tr e ss [M P a ]
Distance from weld centre line [mm] 12t_Transverse Direction
EXP.
FEA.
DOI: 10.4236/wjet.2018.61010 189 World Journal of Engineering and Technology Figure 12. Procedure for the finite element analysis to predict the weld-induced distortions [42].
analysis is performed using strain-as-direct-boundary (SDB) method [43] [44].
In step II, shrinkage forces are calculated in association with the weld-induced residual stresses of welding. In step III, thermal buckling analysis is performed to determine the weld-induced distortions.
3.2. Material Properties
The mechanical properties of material in Table 2 are used. The yield strength of both plating and stiffeners is 309 MPa. The elastic modulus and Poisson’s ratio are 203 GPa and 0.3, respectively. The elastic-perfectly material model without strain-hardening effect is applied.
3.3. Thermal Loading and Boundary Conditions
For welding analysis to obtain initial irregularity in thermal buckling analysis, contact analysis is carried out using self-weight and spring elements connected on four vertexes. The spring node constrains all six degrees of freedom to
pre-Start
StepⅠWelding analysis for initial imperfection (SDB method).
Pre-processing
1) Modeling
2) Material property input 3) Boundary condition input
: Mesh generation based on CAD
: Thermal & Mechanical property (Base & filler metal) : Imaginary heat input, convection & supporting condition
Analysis 1) Performing non-linear thermal- mechanical analysis
Post-processing
1) Checking result of global deformation 2) Rezone meshing
3) Extract geometry information from results of welding analysis
StepⅢ. Thermal buckling analysis
Pre-processing
1) Modeling
2) Material property input 3) Boundary condition input
: Rezoned mesh by welding analysis
: Thermal & Mechanical property (Base & filler metal) : S.F. input, supporting condition
Analysis 1) Performing non-linear mechanical analysis (Using arc length method)
Post-processing
1) Checking result of global deformation 2) Confirming final results
End StepⅡ. CalculatingS.F. (Shrinkage Force)
DOI: 10.4236/wjet.2018.61010 190 World Journal of Engineering and Technology vent rigid body motion. In order to simulate the actual welding process situa-tion, the planar state is analyzed to the plane and the contact analysis with the structural element is carried out. The contact friction uses a stick-slip model with excellent convergence. A two-bay (1/2 + 1 + 1/2) model both in the longi-tudinal and transverse directions is taken as the extent for the analysis as shown in Figure 13. The symmetry condition at all edges is then applied in association with structural continuity.
The thermal loads obtained from steps I and II indicated in Table 5 are
ap-plied to individual finite elements. Figure 13(a) shows the boundary conditions. The imaginary welding temperature (Ttop and Tbot) loads indicated in Table 5
(a)
[image:15.595.214.539.235.567.2](b)
Figure 13. Extent of the analysis together with the boundary conditions [42]. (a) Initial imperfection analysis (Pre-welding analysis); (b) Thermal buckling analysis.
Table 5. Shrinkage forces depending on the plate thickness [45] [46].
tp
[mm] Lw [mm] Shrinkage force [N] temperature at top, TImaginary top [˚C]
Imaginary
temperature at bottom, Tbot [˚C]
6
6.5
45,466.49
0.174 −0.174
8 36,963.12
10 31,861.09
12 28,459.75
y
x
b/2
b/2 b
a a/2
a/2
Initial imperfection analysis
(Pre-welding analysis) 6DOF
6DOF 6DOF
6DOF
: Spring
element : Surface (Rigid surface for contact) : Meshed model(Deformable body for contact)
Gravity
x
b/2
b/2 b
a a/2
a/2
..
.. ..
Therrmal buckling analysis
Rot = [0 1 1] Rot = [0 1 1]
Rot = [1 0 1]
Rot = [1 0 1] u = [0 0 1]
u = [0 0 1]
u = [0 0 1]
[image:15.595.207.543.631.728.2]DOI: 10.4236/wjet.2018.61010 191 World Journal of Engineering and Technology [45] [46] are applied at the top and bottom of the plates along the welding lines. After the thermal buckling analysis is completed, thermal shrinkage forces are applied to the target structure with modified boundary conditions as described in Figure 13(b).
[image:16.595.74.522.177.746.2]3.4. Computed Results and Discussion
DOI: 10.4236/wjet.2018.61010 194 World Journal of Engineering and Technology Figure 14. Computed results of the weld-induced distortions after welding. (a) Distortions of initial imperfection analysis and thermal buckling analysis for tp= 6 mm. (b) Distortions of initial imperfection analysis and thermal buckling analysis for tp = 8
mm. (c) Distortions of initial imperfection analysis and thermal buckling analysis for tp =10 mm. (d) Distortions of initial
DOI: 10.4236/wjet.2018.61010 195 World Journal of Engineering and Technology (a)
[image:20.595.235.511.74.506.2](b)
Figure 15. Computed results of the weld-induced distortions of initial imperfection (during welding) and thermal buckling analysis at plate center along the longitudinal di-rection. (a) Distortions of initial imperfection at the plate center in the longitudinal direc-tion; (b) Distortions of thermal buckling analysis at plate center along the longitudinal di-rection.
presents the computed results of the weld-induced distortions after welding at the plate center in the longitudinal direction. According to the analysis proce-dure shown in Figure 12, at first welding analysis for initial imperfection was performed. The initial imperfection is assumed to be the deformation that oc-curs due to welding, and then thermal buckling analysis is performed by apply-ing the shrinkage force as the boundary condition to this model. It is observed that the deflection at the welding line, i.e., on the transverse stiffeners is zero and has the maximum values at the middle of plating between stiffeners. The mag-nitude of the initial deflection in a thick plate is smaller than that in a thin plate.
-2 0 2 4 6 8 10 12 14
0 1000 2000 3000 4000 5000 6000 7000
D e fl e c ti o n o f z-d ir e c ti o n [ m m ] Length [mm]
tp= 6mm
tp= 12mm
-8 -6 -4 -2 0 2 4
0 1000 2000 3000 4000 5000 6000 7000
DOI: 10.4236/wjet.2018.61010 196 World Journal of Engineering and Technology Figure 16. Comparison of weld-induced distortions between the experiment and the computations. (a) Final deflection after welding for a plate thickness of tp= 6 mm. (b) Final deflection after welding for a plate thickness of tp = 8 mm. (c) Final deflection
DOI: 10.4236/wjet.2018.61010 197 World Journal of Engineering and Technology
3.5. Comparison with Test Data
Paik and Yi [36] performed the experiment to obtained test database of the
welding-induced distortions in a full scale prototype structure. Figure 16
com-pares the weld-induced distortions obtained from experiment as well as the computations. It is concluded that the computations are in very good agreement with the experimental results.
4. Conclusions
The objectives of the present study were to develop finite element modelling techniques to predict weld-induced residual stresses and weld-induced distor-tions in a stiffened plate structures. The developed techniques were validated using test database obtained from direct measurements from a full scale proto-type stiffened plate structures. Based on the results obtained from this study, the following conclusions are drawn.
1) In terms of predicting the weld-induced residual stresses, the modelling of heat source is important. In the present study, a double ellipsoidal shape model was applied to describe the heat source distribution during welding. It was con-firmed that the numerical computations applying the proposed model are in good agreement with test data.
2) The procedure for predicting the weld-induced distortions comprises three steps, namely the weld temperature analysis, the shrinkage force computations and the thermal buckling analysis. The proposed procedure was implemented into a commercial computer code. It was confirmed that the numerical compu-tations are in good agreement with test data.
Acknowledgements
The present study was undertaken in the Korea Ship and Offshore Research In-stitute at Pusan National University which has been a Lloyd’s Register Founda-tion Research Centre of Excellence. The support of Samsung Heavy Industries is greatly acknowledged.
References
[1] Bruno, G., Yordan, G. and Soares, C.G. (2011) Effect of Weld Shape Imperfections on the Structural Hot-Spot Stress Distribution. Ships and Offshore Structures, 6, 145-159.https://doi.org/10.1080/17445302.2010.497052
[2] Teresa, M. and Craig, F. (2013) Effect of Weld-Induced Imperfections on the Ulti-mate Strength of an Aluminium Patrol Boat Determined by the ISFEM Rapid As-sessment Method. Ships and Offshore Structures, 9, 218-235.
[3] Luís, R.M., Soares, C.G. and Nikolov, P.I. (2009) Collapse Strength of Longitudinal Plate Assemblies with Dimple Imperfections. Ships and Offshore Structures, 3, 359-370.https://doi.org/10.1080/17445300802370024
DOI: 10.4236/wjet.2018.61010 198 World Journal of Engineering and Technology [5] Khedmati, M.R., Pedram, M. and Rigo, P. (2012) The Effects of Geometrical Imper-fections on the Ultimate Strength of Aluminium Stiffened Plates Subject to Com-bined Uniaxial Compression and Lateral Pressure. Ships and Offshore Structures, 9, 88-109.https://doi.org/10.1080/17445302.2012.726761
[6] Farajkhah, V., Liu, Y. and Gannon, L. (2016) Finite Element Study of 3D Simulated Welding Effect in Aluminium Plates. Ships and Offshore Structures, 12, 196-208. https://doi.org/10.1080/17445302.2015.1123865
[7] Gannon, L.G., Liu, Y., Pegg, N.G. and Smith, M.J. (2012) Effect of Three-Dimensional Welding-Induced Residual Stress and Distortion Fields on Strength and Behaviour of Flat-Bar Stiffened Panels. Ships and Offshore Structures, 8, 565-578.
https://doi.org/10.1080/17445302.2012.707386
[8] Gannon, L., Liu, Y., Pegg, N. and Smith, M.J. (2015) Nonlinear Collapse Analysis of Stiffened Plates Considering Welding-Induced Residual Stress and Distortion. Ships and Offshore Structures, 11, 228-244.
https://doi.org/10.1080/17445302.2014.985428
[9] Khan, I. and Zhang, S. (2011) Effects of Welding-Induced Residual Stress on Ulti-mate Strength of Plates and Stiffened Panels. Ships and Offshore Structures, 6, 297-309.https://doi.org/10.1080/17445301003776209
[10] Gannon, L.G., Pegg, N.G., Smith, M.J. and Liu, Y. (2013) Effect of Residual Stress Shakedown on Stiffened Plate Strength and Behaviour. Ships and Offshore Struc-tures, 8, 638-652.https://doi.org/10.1080/17445302.2012.664429
[11] Ueda, Y. (1999) Computational Welding Mechanics (Selected from Papers Pub-lished in English). Japan Osaka: Joining and Welding Research Institute, Osaka University, Osaka.
[12] Paik, J.K. and Thayamballi, A.K. (2003) Ultimate Limit State Design of Steel-Plated Structures. Wiley, Chichester.
[13] Masubuchi, K. (1980) Analysis of Welded Structures: Residual Stresses, Distortion and Their Consequences. Pergamon Press, Oxford.
[14] Radaj, D. (1992) Heat Effects of Welding: Temperature Field, Residual Stress and Distortion. Springer Verlag Publishing, Berlin Heidelberg.
https://doi.org/10.1007/978-3-642-48640-1
[15] Lindgren, L.E. (2007) Computational Welding Mechanics: Thermo Mechanical and Microstructural Simulations. Woodhead Publishing Limited, Cambridge.
[16] Goldak, J.A. and Akhlaghi, M. (2005) Computational Welding Mechanics. Springer Science & Business Media, New York.
[17] Feng, Z. (2005) Processes and Mechanisms of Welding Residual Stress and Distor-tion. Woodhead Publishing Limited, Cambridge.
[18] Michaleris, P. (2011) Minimization of Welding Distortion and Buckling: Modelling and Implementation. Woodhead Publishing Limited, Cambridge.
https://doi.org/10.1533/9780857092908
[19] Tsai, C.L., Park, S.C. and Chueng, W.T. (1999) Welding Distortion of a Thin-Plate Panel Structure. Welding Research Supplement, 78, 157-165.
[20] Ueda, Y. and Yamakawa, T. (1971) Analysis of Thermal Elastic-Plastic Stress and Strain during Welding by Finite Element Method. Transactions of Japan Welding Research Institute, 2, 90-100.
DOI: 10.4236/wjet.2018.61010 199 World Journal of Engineering and Technology [22] Chen, B.Q., Hashemzadeh, M., Garbatov, Y. and Guedes Soares, C. (2015) Numeri-cal and Parametric Modeling and Analysis of Weld-Induced Residual Stresses. In-ternational Journal of Mechanical and Material in Design, 11, 439-453.
https://doi.org/10.1007/s10999-014-9269-7
[23] Guangming, F., Marcelo, I.L., Menglan, D. and Segen, F.E. (2016) Influence of the Welding Sequence on Residual Stress and Distortion of Fillet Welded Structures. Marine Structures, 46, 30-55.https://doi.org/10.1016/j.marstruc.2015.12.001
[24] Wang, J., Yuan, H., Ma, N. and Murakawa, H. (2016) Recent Research on Welding Distortion Prediction in Thin Plate Fabrication by Means of Elastic FE Computa-tion. Marine Structures, 47, 42-59.https://doi.org/10.1016/j.marstruc.2016.02.004
[25] Gray, T., Camilleri, D. and McPherson, N. (2014) Control of Welding Distortion in Thin-Plate Fabrication: Design Support Exploiting Computational Simulation. Woodhead Publishing Limited, Cambridge.
[26] Deng, D., Murakawa, H. and Liang, W. (2007) Numerical Simulation of Welding Distortion in Large Structures. Computer Methods in Applied Mechanics and En-gineering, 196, 4613-4627. https://doi.org/10.1016/j.cma.2007.05.023
[27] Luo, Y., Deng, D., Xie, L. and Murakawa, H. (2004) Prediction of Deformation for Large Welded Structures Based on Inherent Strain. Transactions of JWRI, 33, 65-70. [28] Wang, R., Zhang, J.X., Serizawa, H. and Murakawa, H. (2009) Study of Welding
In-herent Deformations in Thin Plates Based on Finite Analysis using Interactive Sub-structure Method. Materials & Design, 30, 3474-3481.
https://doi.org/10.1016/j.matdes.2009.03.015
[29] Daniewicz, S.R., McAninch, M.D., Mc-Farland, B. and Knoll, D. (1993) Application of Distortion Control Technology during Fabrication of Large Offshore Structures. Proceedings of AWS/ORNL International Conference on Modeling and Control of Joining Processes, Orlando, 8-10 December 1993, 239-246.
[30] Murakawa, H., Luo, Y. and Ueda, Y. (1996) Prediction of Welding Deformation and Residual Stress by Elastic FEM Based on Inherent Strain (First Report)—Mechanism of Inherent Strain Production. Journal of the Society of Naval Architects of Japan, 180, 739-751. (In Japanese)https://doi.org/10.2534/jjasnaoe1968.1996.180_739
[31] Michaleris, P. and DeBiccari, A. (1997) Prediction of Welding Distortion. Welding Journal, 76, 172-179.
[32] Yi, M.S., Kim, S.H., Kim, S.J., Seo, J.K. and Paik, J.K. (2017) Development of an Empirical Formula for Predicting Weld-Induced Initial Deflection in Steel Stif-fened-Plate Structures: Numerical and Experimental Studies.
[33] Jiang, W., Luo, Y., Zhang, G. and Tu, S.-T. (2013) Experimental to Study the Effect of Multiple Weld-Repairs on Microstructure, Hardness and Residual Stress for a Stainless Steel Clad Plate. Materials & Design, 51, 1052-1059.
https://doi.org/10.1016/j.matdes.2013.05.027
[34] Jiang, W., Xu, X.P., Gong, J.M. and Tu, S.-T. (2012) Influence of Repair Length on Residual Stress in the Repair Weld of a Clad Plate. Nuclear Engineering and Design, 246, 211-219.https://doi.org/10.1016/j.nucengdes.2012.01.021
[35] Jiang, W., Liu, Z., Gong, J.M. and Tu, S.-T. (2010) Numerical Simulation to Study the Effect of Repair Width on Residual Stresses of a Stainless Steel Clad Plate. In-ternational Journal of Pressure Vessels and Piping, 87, 457-463.
https://doi.org/10.1016/j.ijpvp.2010.06.003
DOI: 10.4236/wjet.2018.61010 200 World Journal of Engineering and Technology [37] MSC (2013) Online User’s Guide. MSC Software Corporation, Newport Beach. [38] Rosenthal, D. (1941) Mathmatical Theory of Heat Distribution during Welding and
Cutting. Welding Journal, 20, 220-234.
[39] Goldak, J., Chakravarti, A. and Bibby, M. (1984) A New Finite-Element Model for Welding Heat-Sources. Metallurgical and Materials Transactions B, 15, 299-305.
https://doi.org/10.1007/BF02667333
[40] Yi, M.S. (2006) The Effect of Geometry Non-Linearity in Welding Deformation. Ms.D. Thesis, Pusan National University, Busan. (In Korean)
[41] Yi, M.S., Hyun, C.M., Cho, S.H. and Jang, T.W. (2009) A Study of Correction Effect in T-Bar According to Cooling Method. Proceeding of the 2009 Spring Annual Meeting of Korea Welding Society, Changwon, 21-22 April 2009, 60. (In Korean) [42] Yi, M.S., Hyun, C.M. and Yoo, J.S. (2016) Development of New Thermal Buckling
Analysis Technique Caused by Welding. International Welding/Joining Conference, Gyeongju, 11-14 April 2017, 21.
[43] Ha, Y.S., Cho, S.H. and Jang, T.W. (2008) Development of Welding Distortion Analysis Method using Residual Strain as Boundary Condition. Material Science Forum, 580-582, 649-654.
https://doi.org/10.4028/www.scientific.net/MSF.580-582.649
[44] Ha, Y. (2011) A Study on Weldment Boundary Condition for Elasto-Plastic Ther-mal Distortion Analysis of Large Welded Structures. Journal of Welding and Join-ing, 29, 410-415.https://doi.org/10.5781/KWJS.2011.29.4.410
[45] Shin, S.B., Kim, K.K. and You, J.G. (2006) A Study on Control of Buckling Distor-tion at the Thin Panel during Welding. International Offshore and Polar Engineer-ing Conference, San Francisco, CA, 28 May-2 June 2006, 236-242.
![Figure 1. Typical modes of weld-induced initial distortions in plated structures [11] [12]](https://thumb-us.123doks.com/thumbv2/123dok_us/9966882.497639/2.595.128.537.427.709/figure-typical-modes-induced-initial-distortions-plated-structures.webp)
![Figure 3. Definition of geometric parameters for the heat source distribution with a double-ellipsoidal shape [39]](https://thumb-us.123doks.com/thumbv2/123dok_us/9966882.497639/5.595.225.524.66.258/figure-definition-geometric-parameters-source-distribution-double-ellipsoidal.webp)
![Figure 4. A steel stiffened-plate structure to measure the weld-induced residual stresses [36]](https://thumb-us.123doks.com/thumbv2/123dok_us/9966882.497639/6.595.209.541.616.709/figure-steel-stiffened-structure-measure-induced-residual-stresses.webp)
![Table 2 indicates the mechanical properties of material at room temperature. During welding, the material properties greatly change with elevated tempera-tures as described in Figure 6 [40]](https://thumb-us.123doks.com/thumbv2/123dok_us/9966882.497639/7.595.129.539.333.741/indicates-mechanical-properties-material-temperature-material-properties-described.webp)
![Figure 6. Mechanical and thermal properties [40]. (a) Mechanical properties; (b) Thermal properties](https://thumb-us.123doks.com/thumbv2/123dok_us/9966882.497639/8.595.165.537.74.276/figure-mechanical-thermal-properties-mechanical-properties-thermal-properties.webp)