Evaluating health care financing in a highly
decentralized Beveridge model
Jan Klavus1*, Ilkka Vohlonen1,2, Juha Kinnunen1, Veli Koistinen1, Martti Virtanen3
1Department of Health and Social Management,University of Eastern Finland, Kuopio, Finland; *Corresponding Author: [email protected]
2Audiapro Ltd., Helsinki, Finland
3Nordic Casemix Centre, Helsinki, Finland
Received 11 June 2012; revised 19 July 2012; accepted 25 July 2012
ABSTRACT
The Finnish health care system is financed in a highly decentralized manner. In the tax-financed Beveridge model each municipality is response- ble for financing and organizing health care services for its residents. This paper examined the annual incidence and treatment costs of three cost-intensive DRG-groups, and all DRG- groups together. The objective was to estimate municipal level predictions on the incidence of new illness cases and their associated costs, and to analyze whether there was greater un- certainty in anticipated specialized health care costs in municipalities with smaller populations. The dataset comprised of longitudinal hospital utilization and discharge data from Hospital Discharge Registers. The expected annual va- riation of illness cases and costs was assessed with respect to 95% confidence intervals esti- mated for each morbidity group and municipality. The results indicated that the costs of the se- lected morbidity groups fluctuated in a com- pletely uncontrollable manner in municipalities with small populations. As the median size of Finnish municipalities is less than 6000, the in- ability to anticipate periodic health care costs constitutes an extensive financial problem and calls for the establishment of larger regional units and funding pools.
Keywords: Health Care Financing; Beveridge Model; Predictability of Treatment Costs; Risk Pooling
1. INTRODUCTION
In Finland, the financing of health care, including spe-cialized inpatient care, is mainly based on municipal
taxation. It is a highly decentralized Beveridge model. Finnish municipalities are legally obliged to finance and organize health services for their residents. There are currently 336 municipalities with a median size of less than 6000 inhabitants. This indicates the highly decen- tralized structure of the Finnish health care system, as well as the small size of catchment populations response- ble for funding service provision.
In a widely scattered financing system municipalities face difficulties in acting in an economically systematic manner. The unpredictability of the incidence of new illness cases materializes particularly in smaller munici- palities as uncontrollable annual fluctuations in health care budgets and expenditures. In small municipalities individual “cost peaks” generate more severe cash flow problems than in larger municipalities where the financ- ing burden is distributed across larger populations. Such uncertainty causes unpredictability in budgetary planning and can lead to rising health care costs and accumulating budget deficits.
This paper presents the findings of the VAKKA study. The study builds on an extensive database comprising of longitudinal hospital utilization and discharge data from Hospital Discharge Registers. The study aims at estimat- ing municipal level predictions on the incidence of new illness cases, as well as their associated costs. The pre-dicted annual variation of illness cases and costs is indi-cated by the width of the respective confidence intervals. The objective is to analyze empirically whether there is greater uncertainty in anticipated specialized health care treatment episodes/costs in municipalities with smaller populations, and if so, is there a cut-off point in popula-tion size after which annual variapopula-tion in costs levels off. The paper is organized as follows. The next section presents a short overview of two principal public health insurance models and outlines the main characteristics of Finnish tax-based health care financing in an Euro- pean context. Section 3 describes the data and estima-tion methods. Secestima-tion 4 presents the predicted annual variation of illness cases and treatment costs for se-lected diagnosis groups. The final section concludes and discusses the main policy implications of the study.
2. PUBLIC HEALTH INSURANCE
Particularly all developed countries apply a public fi- nancing scheme for insuring their populations for the costs of health care. Publicly financed health care sys- tems are usually funded in one of two ways: general taxation (the Beveridge model) or social (national) health insurance contributions (the Bismarck model). In social health insurance systems, health services are funded from some combination of employees’ salary deductions, employers’ contributions, and possibly additional state funds. Social insurance schemes may cover other bene- fits besides health. Social health insurance is usually ad- ministered by sickness funds (Austria, France, Germany, Switzerland) or a central government-run fund (Luxem- bourg, the Netherlands) that distributes contributions to sickness funds [4]. The number of funds, their size and structure vary by country.
Tax-funded health care is based on revenue collected through general taxation. Taxes can be levied on indi- viduals, households’ and firms (direct taxes), or on commodities (indirect taxes). Direct and indirect taxes can be levied at the national regional or local levels.
Similarly to social health insurance, tax-funded health care functions principally as an insurance scheme. In a well functioning insurance scheme a large number of contributors (pooling fund) offer financial protection against unreasonable high health care costs for any indi- vidual insured. In a broader perspective the risk-pooling principle concerns not only individuals using health care services but also the agents responsible for fund pooling,
and the organizers and providers of health services. In case the size of the pooling fund is not sufficiently large, and insurance premiums cannot be allocated over time, costs of the insurance scheme tend to rise and the scheme operates under higher unpredictability of risk. The pre- miums and operating costs associated with the scheme may vary significantly from one period to another [5].
The funding of health and social services in Finland comprises of revenue collected through general taxation (65%), sickness insurance contributions (15%) and out- of-pocket payments (20%). In addition to the fiscal fi- nancing system, the social insurance scheme adminis- tered by Kela, collects payroll taxes that finance old-age pensions, a range of income transfers and reimburse- ments for private health services and prescription drugs.
Revenue is collected through a mixture of municipal income taxes, state taxes (income and commodity taxes) and user charges. In the system of locally administered service provision municipalities act as autonomous pool- ing funds. The funds are prospectively allocated through an annual budgetary plan/process to purchase needed health and social services. The Finnish health care sys-tem resembles those of other Nordic countries. It offers universal coverage for a comprehensive range of health services delivered primarily by publicly owned and op-erated providers. However, the Finnish system is clearly more decentralized in its organizational structure than those of the other Nordic countries [6].
In the decentralized municipal health care system, or- ganizational responsibility is distributed across 336 mu- nicipalities and 20 hospital districts. In 2007 the average population in a municipal pooling fund was less than 16,000 (Table 1). In the European Union context, Fin-
land stands out as a country with exceptionally small size of pooling funds. For example, France and England oc-cupy a single national fund covering their total popula- tions of over 60 million people. In Germany with the highest number of pooling funds after Finland, the aver- age size of members per fund was over 400,000 in 2007.
In most Member States publicly collected health care funds are pooled at the national level. Exceptions are Member States where local taxes are used to finance health care and those where individual health insurance funds are responsible for the collection of insurance con- tributions. There is a clear trend in Europe towards cre- ating national pools. For example from 2009 social in- surance contributions in Germany have been pooled na- tionally by the new national health insurance fund.
3. METHODOLOGY AND MATERIALS
Table 1. Risk pooling and service provision in EU Member
States.
Funders Purchasers
Pooling Population/ Population/
Funds Pooling fund Purchasers Purchasers
Finland 336 15,795 336 15,795
Greece 30 374,000 30 374,000
Austria 21 397,000 21 397,000
Malta 1 406,000 1 406,000
Germany 200 411,000 200 411,000
Sweden 21 439,000 21 439,000
Luxembourg 1 471,000 9 52,000
Cyprus 1 793,000 1 793,000
Slovakia 6 899,000 6 899,000
Denmark 5 1,098,000 5 1,098,000
Czech
Republic 9 1,140,000 9 1,140,000
Estonia 1 1,340,000 4 335,000
Slovenia 1 2,010,000 1 2,010,000
Spain 20 2,216,000 20 2,216,000
Latvia 1 2,271,000 8 284,000
Italy 20 2,943,000 20 2,943,000
Lithuania 1 3,366,000 5 673,000
Ireland 1 4,250,000 1 4,250,000
Bulgaria 1 7,538,000 28 269,000
Hungary 1 10,035,000 1 10,035,000
Belgium 1 10,517,000 7 1,502,000
Portugal 1 10,620,000 5 2,124,000
Netherlands 1 16,390,000 19 863,000
Romania 1 22,215,000 42 529,000
Poland 1 38,116,000 1 38,116,000
England 1 60,520,000 152 398,000
France 1 61,840,000 3 20,613,000
Source: S. Thomson, T. Foubister, E. Mossialos. Financing Health Care in Europe [7].
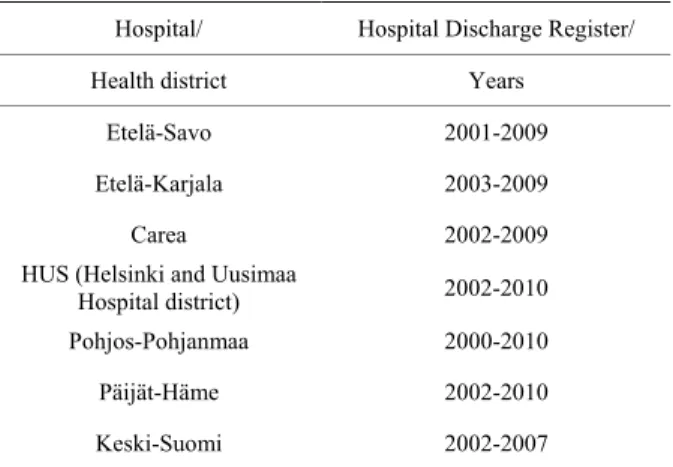
Register data from all the hospital districts were merged and classified using the 2009 NordDRG-grouper. The number of unclassified patient cases was identified and compared on a yearly basis with respect to MDC- groups in the hospital districts own register data. In addi- tion, a check-up was run in order to make sure that the
Table 2. Hospital discharge register (HILMO) data.
Hospital/ Hospital Discharge Register/
Health district Years
Etelä-Savo 2001-2009
Etelä-Karjala 2003-2009
Carea 2002-2009 HUS (Helsinki and Uusimaa
Hospital district) 2002-2010
Pohjos-Pohjanmaa 2000-2010
Päijät-Häme 2002-2010
Keski-Suomi 2002-2007
MDC-group 99 (erroneous, obscure) was not exception- ally large.
The HILMO-registers contained hospital utilization data on 125 (35%) Finnish municipalities. In terms of population coverage VAKKA-data represented about half (49 %) of the total Finnish population.
The dataset was a representative sample of the Finnish population. In comparison to the population distribution of all Finnish municipalities, VAKKA-data corresponded rather closely to the percentage shares of municipalities of various sizes in the overall distribution. The dataset had a slightly more even size distribution, but this dif- ference was negligible in the framework of the current analysis. The data corresponded rather closely to the gender distribution of the population. With respect to age structure, a slight difference in the population shares of the oldest age group existed. The VAKKA-data con- tained a somewhat smaller share of population over 65-year-old (13%) in comparison to the total population (17%). This was mainly due to the effect of the large HUS hospital district (greater Helsinki area and neigh- boring municipalities).
The morbidity indicators (DRGs) applied in the study were selected among those diagnosis groups that were expected to create an unpredictable and significant fi-nancial burden for a municipality.
This burden could be generated by the incidence of a single high-cost treatment episode or by the long dura- tion of several semi-costly episodes and the associated treatment costs. The selection process emphasized the identification of indicators with a high degree of consis- tency and a low impact of supplier induced demand. In addition the estimations were carried out for all DRGs together. The ten morbidity indicators were:
014A Specific cerebrovascular disorders except TIA with cc
014B Specific cerebrovascular disorders except TIA w/o cc
reoperation
122 Other circulatory disorders with ami without cardiovascular complications, alive at 4th day of care
167 Appendectomy w/o complicated principal diag w/o cc
183 Esophagitis, gastroent & misc digest disorders, age > 17 w/o cc
436B Other abuse disorders w/o cc
373 Vaginal delivery w/o complicating diagnoses 039A Lens procedures with or without vitrectomy ALL All DRGs together
Due to space limitations, only three morbidity indica-tors and all DRGs together were analyzed in the present study (014B, 122, 209A and ALL).
In the first stage the annual incidence of the indicators was calculated for each municipality. In the second stage the expected value and 95% confidence intervals were estimated from data covering all the study years. These confidence intervals were interpreted as the interval within which the number of new illness cases in the next period will lie with a 95% probability.
The confidence intervals (CI) were estimated as fol-
lows:
1.96 s CI x
n
The standard error of the mean (s) describes the
accu-racy of the sample mean and it is used to measure the width of the confidence interval corresponding to a cer-tain probability level.
In the third stage the costs of treatment for each mor-bidity indicator were calculated. The treatment costs per morbidity indicator were calculated using the associated DRG-weights and the average DRG-price. The average DRG-price of the HUS hospital district was used as ref-erence.
Similarly to the interpretation of the confidence inter-val described before, this estimate was considered to indicate the interval within which costs by morbidity group were expected to lie in the next budgetary period. Costs of preceding years were converted to constant 2010 Euros using the hospital cost index published by the Statistics Finland [8].
The following example will help to clarify the estima- tion method. According to the HILMO-registers of the Etelä-Savo hospital district, a total of 1024 uncompli- cated brain infarctions (DRG 014B) occurred in the mu- nicipality of Mikkeli in 2001-2009. On the average there were 114 such episodes per year (1024/9). As the inci-dence of brain infarctions is subject to random variation, the incidence of new cases will vary by year. Taking into account the random element in the occurrence of new treatment episodes, the confidence interval associated
with this morbidity indicator ranged from 98 to 130 epi-sodes. Consequently, the number of brain infarctions in the Mikkeli municipality was estimated (with a 95% probability) to be at the minimum 98 and at the maxi- mum 130 episodes per year. The expected annual costs of brain infarctions were €287,175 ((=114*(average cost*DRG-weight*price index 2010)) and the expected variation of costs €235,655 - 338,655.
In the present study the annual variation of costs per 1000 inhabitants was analyzed by the relationship of the standard error of the mean and the size of the population of each municipality. The aim of this analysis was to examine if the annual variation in treatment episodes and costs was larger in municipalities with smaller popula- tions. In other words, is it more difficult for a small mu- nicipality to assess beforehand the future costs of spe- cialized health care than for a bigger municipality? The analysis is presented in the next section using scatter grams.
A linear regression line was fitted in the diagrams. This line gives an indication of the “trend” prevailing between the magnitude of the annual variation of treat- ment episodes (or their associated costs) and population size. A decrease in the annual variation with an increase of the population size of a municipality was expected. The linear regression model simplifies the true relation- ship and the regression line should not be interpreted as an accurate prediction of annual costs for a certain popu- lation size.
4. RESULTS
In order to examine more closely the random element in the incidence of new treatment episodes, the incidence of uncomplicated brain infarction in the municipalities of the Etelä-Savo hospital district was analyzed. Annual new brain infarction episodes per 1000 inhabitants were more frequent in municipalities with small populations (Juva, Suomenniemi) (Table 3).
In municipalities with larger populations the incidence of brain infarction was clearly smaller, about half of that of small municipalities, being 233 and 453 cases per 1000 inhabitants.
In the smaller municipalities the higher incidence of brain infarction was accompanied by greater annual variance. In the smallest municipality the range of new treatment episodes varied by 301 cases per year, while in the biggest municipality, the range of variation was 33 cases per year (see Table 3).
Correspondingly the annual treatment costs of new treatment episodes per 1000 inhabitants were highest in the two smallest municipalities (Table 4).
Table 3. Incidence and annual variation (+/−) of brain infarction (DRG 014B) in four municipalities of the Etelä-Savo
hospital district (cases/1000 inhabitants).
Municipality Population DRG (014B)
2010
At lower bound of At upper bound of Range of
Average/ Confidence interval/ Confidence interval/ Confidence interval/
1000 inhabitants 1000 inhabitants 1000 inhabitants 1000 inhabitants
Mikkeli 48,688 2.33 2.00 2.66 +/−0.33
Pieksämäki 20,151 2.42 2.07 2.76 +/−0.35
Juva 7,499 4.02 3.22 4.83 +/−0.80
Suomenniemi 843 4.53 1.52 7.53 +/−3.01
Table 4. Treatment costs and annual variation (+/−) of brain infarction (DRG 014B) in four municipalities of the
Etelä-Savo hospital district (€/1000 inhabitants).
Municipality Population DRG (014B)
2010
At lower bound of At upper bound of Range of
Average/ Confidence interval/ Confidence interval/ Confidence interval/
1000 inhabitants 1000 inhabitants 1000 inhabitants 1000 inhabitants
Mikkeli 48,688 5880 4895 6865 +/−985
Pieksämäki 20,151 6110 5058 7161 +/−1052
Juva 7499 10,256 7744 12,769 +/−2512
Suomenniemi 843 11,697 3864 19,530 +/−7833
biggest municipality the annual variation of costs was €985 (about 17 percent of average treatment costs) while it was €7833 in the smallest municipality (about 67 per- cent of average treatment costs).
The municipality with a population of less than 1000 had in the worst case to prepare for about €20,000 annual treatment costs of uncomplicated brain infarctions per 1000 inhabitants. In the two biggest municipalities with populations in the range of 20,000 and 50,000 the uncer- tainty related treatment costs would at their highest reach €7000 per 1000 inhabitants.
The greater uncertainty regarding the incidence and treatment costs of brain infarction in smaller municipali-ties can be observed more generally in an analysis in-volving all the municipalities (under 100,000 inhabitants) in the dataset (Figure 1(a)). The magnitude of the annual
variation of treatment costs of brain infarctions as meas-ured by the standard error fluctuated randomly in the smallest municipalities. In municipalities with a popula-tion of less than 10,000 the annual fluctuapopula-tion of costs could be almost non-existent, but at the same time in other equally small municipalities, it could reach
ex-tremely high values.
The fluctuation in the annual variation of treatment costs decreased as the population of the municipality approached 20,000, and fell further when the population reached 40,000 and above. However, for populations larger than 40,000 inhabitants, no clear tendency towards a systematically diminishing periodic fluctuation of costs could be observed. This relationship was very similar as regards the other morbidity indicators. When all DRGS were analyzed together a similar pattern occurred, but the standard errors were more widely scattered along the vertical axis (Figures 1(b)-(d)).
The inverse relationship between population size and the annual variation of treatment costs could be observed more clearly when the population axis was cut-off at 100,000 inhabitants. Including all municipalities (even those over 100,000 inhabitants) the trend line for all DRGs together was still declining (Figure 2). However,
(a)
(b)
(c)
(d)
Figure 1. Annual variation of treatment costs of selected DRGs
in Finnish municipalities of under 100,000 inhabitants (€/1000 inhabitants; se = standard error; Lin. (se) = trend line).
Figure 2. Annual variation of treatment costs of all DRGs
to-gether in Finnish municipalities (€/1000 inhabitants; se = stan-dard error; Lin. (se) = trend line).
not statistically possible to estimate an optimal size of the pooling fund in the present analysis.
5. CONCLUSIONS AND DISCUSSION
The study indicated that the annual incidence and treatment costs of the most cost-intensive morbidity groups fluctuated in a completely uncontrollable manner in small municipalities. The annual variation was largest in municipalities with populations under 10,000 inhabi- tants. The fluctuation in the annual variation of treatment costs decreased as the population of the municipality approached 20,000 and diminished further at populations of 40,000 and beyond. Further, the analysis suggested that the predictability of specialized health care costs may not significantly improve when the size of the catchment population exceeds 100,000 inhabitants.
As about three fourths of Finnish municipalities have populations of less than 10,000 inhabitants, the inability to foresee the periodic costs of specialized health care constitutes a serious and wide-spread financial problem. This uncertainty is likely to undermine health care re- sources and reflect to the sufficiency and quality of health services as well as other public services. On the other hand, the study suggested that very large popula- tions do not necessarily guarantee a further reduction in the variation of treatment costs. Therefore, if the primary policy criterion is the minimization of the risk of unpre- dictable financial burdens, a nationally administered health care funding scheme is not self-evidently sup- ported.
How-ever, these mechanisms are either too small-scaled (state subsidies) or exclusive with respect to compensation criteria (costly patients) for providing sufficient insur- ance coverage for municipalities.
REFERENCES
[1] Huuhtanen, J. (2005) The Kela model on the financing and organization of health services (in Finnish). Power-Point Presentation, Helsinki.
The ongoing reform of local government structures is in accordance with the findings of the study; larger mu- nicipal entities enable larger catchment populations and promote wider risk-sharing pools. However, reforming of the financing structures of primary and specialized health care should be carried out simultaneously with the establishment of such larger municipal organizations. In the current situation a comprehensive strategy compris-ing a reconciliation of the various organizations, schemes and functions of health care (and social care) is more or less missing.
[2] Aronkytö, T., Hallipelto, A. and Kangasharju, A. (2010) A new health care financing and organization scheme (in Finnish). SITRA Reports 24, Helsinki.
[3] National Institute for Health and Welfare (2010) The advantages, drawbacks and development requirements of the multi-channeled health care financing system (in Fin-nish). Report by the THL Expert Panel, Helsinki. [4] Figueras, J., Saltman, R.B., Busse, R. and Dubois, F.W.
(2004) Patterns and performance in social health insur-ance systems. In: Saltman, R.B., Busse, R. and Figueras, J., Eds., Social Health Insurance Systems in Western Europe. Open University Press, Berkshire, 81-140.
The analysis showed that existing register data sources on health care utilization and costs enable the provision of research based evidence to support a critical assess- ment of various policy alternatives for health care fi- nancing. The models presented in this study, and their future developments, can be used for determining a suf- ficient population size that will enable better administra- tion and predictability of health care costs. In accordance with the need to avoid piecemeal reforms, the VAKKA- project will continue to provide topical research evidence for policy purposes. In the next phase the findings and materials of the current study will be utilized in analyz- ing and calculating the prerequisites of profitable pro- duction units in specialized health services (TUOTA- project).
[5] Busse, R., Saltman, R. and Dubois, H. (2004) Organiza-tion and financing of social health insurance systems: Current status and recent policy developments. In: Saltman, R.B., Busse, R. and Figueras, J., Eds., Social Health Insurance Systems in Western Europe. Open Uni-versity Press, Berkshire, 33-81.
[6] Teperi, J., Porter, M.E., Vuorenkoski, L. and Baron, J.F. (2009) The Finnish Health Care System: A value based perspective. Sitra Reports 82, Helsinki.
[7] Thomson, S., Foubister, T. and Mossialos, E. (2004) Fi-nancing health care in the European Union: challenges and policy responses. Observatory Studies Series, 17.
[8] Statistics Finland (2010) Public expenditures price index.