http://www.scirp.org/journal/ajac ISSN Online: 2156-8278 ISSN Print: 2156-8251
DOI: 10.4236/ajac.2018.91003 Jan. 12, 2018 27 American Journal of Analytical Chemistry
Optimizing Sampling, Sample Processing and
Analysis Methods for Radon (
222
Rn) in Water by
Liquid Scintillation Counting
Uttam K. Saha
1*, Michael E. Kitto
2, Dana R. Lynch
3, Anchal Bangar
1, Pamela R. Turner
4,
Gabrielle Dean
4, Leticia S. Sonon
11Agricultural and Environmental Services Laboratories, The University of Georgia, Athens, GA, USA
2Laboratory of Inorganic and Nuclear Chemistry, Wadsworth Center, New York State Department of Health, Albany, NY, USA
3Family and Consumer Science Extension Agent, Monroe County Extension, The University of Georgia, Forsyth, GA, USA
4Department of Financial Planning, Housing and Consumer Economics, The University of Georgia, Athens, GA, USA
Abstract
Throughout the United States, laboratories use different sampling methods (“Direct Fill” vs. “Submerged Bottle” methods), sample preparations (“Simul-taneous Drawing” vs. “Separate Drawing”), scintillators (“Mineral Oil” vs. “Opti-Fluor”), volume of water plus scintillator in the cocktail (“8 mL plus 8 mL” vs. “10 mL plus 10 mL”), and liquid scintillation counting assays (“Full Spectrum: 0 - 2000 keV” vs. “Region of Interest: 130 - 700 keV”) for analyzing
radon (222Rn) in water. We compared these and few other variables on the
re-covery of radon from two “Proficiency Test (PT)” samples and four “House-hold Well Water” samples from Georgia. The “130 - 700 keV” assay had sig-nificantly higher radon recovery than the “0 - 2000 keV” assay. The “Direct Fill” sampling produced significantly lower radon recovery than the “Sub-merged Bottle” sampling. “Simultaneous Drawing” of both scintillator and water sample yielded higher radon recovery than “Separate Drawing”. Air bubble in the samples resulted in significant loss of radon gas; and such loss became greater as the air bubble was larger. A “10 mL scintillator + 10 sam-ple” combination appeared better than “8 mL scintillator + 8 mL samsam-ple”. Mixing scintillator and sample in the laboratory, when compared with doing it on-site, was found superior for better results and practicality of testing ra-don in private well waters. “Mineral Oil” scintillator provided higher rara-don activity than “Opti-Fluor”. However, in 10 consecutive measurements of the
two proficiency test (PT) samples at 60 days interval (i.e., with full ingrowing),
“Mineral Oil” overestimated the radon activity compared to the predicted/as- signed value in most cases, whereas “Opti-Fluor” invariably produced results
How to cite this paper: Saha, U.K., Kitto, M.E., Lynch, D.R., Bangar, A., Turner, P.R., Dean, G. and Sonon, L.S. (2018) Optimiz-ing SamplOptimiz-ing, Sample ProcessOptimiz-ing and Ana- lysis Methods for Radon (222Rn) in Water
by Liquid Scintillation Counting. American Journal of Analytical Chemistry, 9, 27-45. https://doi.org/10.4236/ajac.2018.91003
Received: December 16, 2017 Accepted: January 9, 2018 Published: January 12, 2018
Copyright © 2018 by authors and Scientific Research Publishing Inc. This work is licensed under the Creative Commons Attribution International License (CC BY 4.0).
http://creativecommons.org/licenses/by/4.0/
DOI: 10.4236/ajac.2018.91003 28 American Journal of Analytical Chemistry
close to the predicted/assigned value. There were noticeable temporal varia-tions in both radon and uranium concentravaria-tions in the study wells; neverthe-less, uranium and radon concentrations had good positive correlation.
De-spite this, the use of uranium concentration over 30 ppb (theMCLofuranium
indrinkingwater) as a trigger for recommending test for radon in well water remains questionable because there may be the safe level of uranium but un-safe level of radon in a well and vice versa.
Keywords
Mineral Oil, Opti-Fluor, Proficiency Test (PT), Radon (222Rn), Liquid
Scintillation
1. Introduction
Both groundwater and surface water in some parts of Georgia and South Caro-lina have long been known to contain varying levels of radionuclides from three
naturally occurring decay series headed by 238U, 232Th, and 235U [1][2] [3][4].
For example, Coker and Olive [4] tested 90 wells in Georgia for radon (222Rn)
and other radionuclides and concluded that groundwater from the granite and gneiss aquifers in the Piedmont physiographic province contained the highest
average concentrations of naturally occurring radionuclides. Likewise, Stone et
al.[5] found elevated levels of radium in drinking water in the “Piedmont and
Coastal Plain Sandhills” regions and elevated uranium in water in the “Piedmont
(and Blue Ridge)” region of South Carolina. Furthermore, Albertson [6]
re-ported activities of gross alpha, radium-226, and combined radium-226 plus ra-dium-228 above Environmental Protection Agency’s (EPA) corresponding drinking water Maximum Contaminant Levels (MCL) in some community wa-ter systems in the Piedmont, Blue Ridge, and parts of the Coastal Plain physio-graphic provinces of Georgia. Elevated uranium concentrations were also de-tected in drinking water in the Piedmont and Blue Ridge physiographic prov-inces [6].
In 2010, routine testing of waters from some private drinking water wells at the University of Georgia’s (UGA) Agricultural and Environmental Services La-boratories (AESL) detected uranium at concentrations above EPA’s MCL of 30 parts per billion (ppb). As of November 16, 2017, the total number of water samples tested for uranium was 1265. Of these, 148 had detectable amounts of uranium (above 10 ppb) with 63 being above the 30 ppb MCL. One of the wells tested as high as 6297 ppb, which is more than 200 times greater than EPA’s MCL. All of these 63 samples with uranium above the MCL were from the Piedmont Blue Ridge Regions above the “Fall Line”, which extends from Co-lumbus in the west, Macon in the middle to Augusta in the east. The AESL de-veloped a mapping program and made it available online for public at:
DOI: 10.4236/ajac.2018.91003 29 American Journal of Analytical Chemistry
of uranium in well water was often associated with high levels of radon in well water and in indoor air (measured in air by the homeowner). The geographical association of high uranium and radon results in the AESL database suggests that uranium, radon, and other radionuclides in deep wells originate predomi-nantly from naturally occurring granitic bedrock located primarily in the Pied-mont and Blue-Ridge (PBR) regions of Georgia, corroborating the observations
of earlier investigators [4][5][6].
Exposure to radionuclides through drinking water could result in various public health concerns. In this context, alpha radiation from uranium, radium, and their progenies, including radon are particularly important. According to
World Health Organization, when the gross-alpha (α) activity in drinking water
exceeds 0.5 Bq/L (or 13.5 pCi/L) or gross-beta (β) activity exceeds 1 Bq/L (or 27
pCi/L), radionuclide-specific activities should be analyzed and brought below
the WHO guidance levels, which are 0.1 Bq/L for 228Ra; 1 Bq/L each for 223-226Ra,
234U, and 235U; 10 Bq/L for 238U; 100 Bq/L for 222Rn, and 15 μg/L (ppb) for total
uranium [7]. Ingested radionuclides could get absorbed into the blood stream
and accumulate in specific tissues, bone, and organs causing damage to them or
can be excreted out of the body [8]. Some examples in this regards are: 66% of
absorbed uranium could be rapidly eliminated via urine, while the rest could be distributed and stored in the kidney (12% - 25%), bone (10% - 15%), and soft
tissues (Wrenn et al., 1985); radium could accumulate primarily in the bone [9].
Ingested uranium primarily causes chemical toxicity, especially nephrotoxicity
[10][11], whereas ingested radium and radon could induce radiotoxicity leading
to cancer [9]. Ingested radon gas through drinking water diffuses into the
sto-mach wall and can cause stosto-mach cancer by irradiating stosto-mach wall tissues
[12]. In contrast, lung cancer due to inhaled radon from indoor air has been
un-disputedly established [13].
Interestingly, radon in a household water supply poses both inhalation and ingestion risks with most risk due to inhalation of radon released from the water
into the indoor air during showering, laundering, etc. A very rough rule of
thumb for estimating the contribution of radon in household water to indoor air radon is that water with 10,000 pCi/L of radon contributes about 1 pCi/L to the level of radon in the indoor air. Based on a National Academy of Sciences report
on radon in drinking water [14], it has been estimated that in the USA radon in
drinking water causes about 168 cancer deaths per year, 89% from lung cancer caused by breathing in radon released from water, and 11% percent from
sto-mach cancer caused by ingesting radon-containing water [15].
From 2010 through 2013, The University of Georgia (UGA) Extension con-ducted a public education program, along with a half-price water testing service, to encourage well owners to test their waters for uranium. The intent was to ex-pand the database to better understand the nature and extent of the problem, and increase public awareness in this regard. The program is still active, but at a full price for the test. People from Georgia counties with high uranium and
DOI: 10.4236/ajac.2018.91003 30 American Journal of Analytical Chemistry
problems including cancer, kidney problems, autoimmune disorders, gastroin-testinal symptoms, and neuropathy despite the apparent absence of any pub-lished report for the affected areas directly linking these contaminants and the reported illnesses.
In August 2015, the AESL and the College of Family and Consumer Sciences of the UGA launched a new Radon in Household Water Testing and Education program in collaboration with the Laboratory of Inorganic and Nuclear Chemi-stry, New York State Department of Health. The EPA recommended Liquid
Scintillation Counting (LSC) for analyzing radon in water [17], which was
sub-sequently approved in New York State by the Environmental Laboratory
Ap-proval Program [18] [19]. However, laboratories analyzing radon in drinking
water across the USA follow different sampling methods (“Direct Fill” vs. “Sub-merged Bottle”), sample preparations (“Simultaneous Drawing” vs. “Separate Drawing”), scintillation fluids (“Mineral Oil” vs. “Opti-Fluor”), volume of water plus scintillator in the counting vial (“8 mL + 8 mL” vs. “10 mL + 10 mL” com-binations), mixing scintiallation fluid and water in the laboratory vs. on-site, and LSC assays (“0 - 2000 keV” vs. “130 - 700 keV”). The advantages and disadvan-tages of these practices are yet to be fully evaluated to optimize the sampling and analysis conditions. Moreover, it has also remained unresolved as to whether presence of an air bubble in the water sample vial is acceptable or unacceptable. This paper reports the results of a study comparing these variables on the recov-ery of radon from two “Proficiency Test (PT)” samples and four “Household Well Water” samples.
2. Materials and Methods
2.1. Water Samples
We used two 222Rn in water “proficiency test (PT)” or standard samples
desig-nated as “Standard-15” and “Standard-17” obtained from co-author Kitto and numerous samples from four household wells from Monroe County, Georgia. The four household wells included in this study are designated as “Well-1: 6090DFR”, “Well-2: 711JP”, “Well-3: 715JP”, and “Well-4: 578TR”. Three of these household well waters contained elevated levels of uranium. A prior analy-sis of the Well-6090DFR water revealed 629 ppb uranium, 3.8 pCi/L radium
(226Ra + 228Ra), and 79,000 pCi/L radon. The “Standard-15” and “Standard-17”
are reusable radon-in-water standards as they were prepared using a 226Ra-
loaded filter sandwiched in polyethylene sheeting [20]. At full in growth (>30
days), the 222Rn produced by the sandwiched 226Ra sources in both “Standard-15”
DOI: 10.4236/ajac.2018.91003 31 American Journal of Analytical Chemistry
2.2. Methods of Sampling
We compared “Submerged Bottle” versus “Direct Fill” methods of sample col-lection. Two samples were collected for each method. For the “Submerged
Bot-tle” method (Figure 1), water was collected into a bowl by gently flowing
down one side with minimal disturbance. Then the entire sample bottle and lid were submerged under water in the bowl, opened, and filled. The water-filled bottle was capped while still under water and turned it upside down. If air bubbles were present, the bottle was emptied and refilled again until air bub-bles were no longer observed. The procedure was repeated with the second
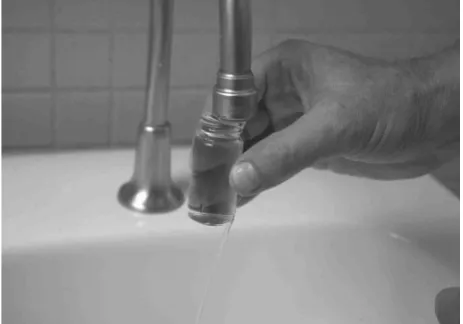
bottle. For the “Direct Fill” method (Figure 2), gently flowing water was
[image:5.595.257.492.346.510.2]col-lected directly into the top opening of the sample bottle, carefully avoiding tur-bulence. The bottle was allowed to gently overflow, forming a slight dome of water at the opening. The bottle was promptly capped and checked for air bubbles by inverting bottle and tapping gently. If air bubbles were present, the bottle was emptied, and the filling procedure repeated until air bubbles were no longer observed in the water sample. The procedure was repeated with the second bottle.
Figure 1. “Submerged bottle” method of sampling.
[image:5.595.258.490.544.706.2]DOI: 10.4236/ajac.2018.91003 32 American Journal of Analytical Chemistry
2.3. Liquid Scintillation Counting (LSC) Assays
Using a Tricarb 2910 Liquid Scintillation Counter (PerkinElmer, Waltham , MA) for counting radon in water, we compared radon recovery from two
dif-ferent liquid scintillation counting assays as presented in Table 1. The “Assay-1”
is a full spectrum assay covering the whole range of energy with the region of interest (ROI) from 0 to 2000 keV. In contrast, the “Assay-2” is limited within
the ROI for 222Rn from 130 to 700 keV, excluding the counts below 130 keV
(which is indeed from “Bremsstrahlung” radiation). Cutting out the low-energy (below 130 keV) betas also reduces the quenching and background. The effi-ciency (cpm/dpm) in Assay-2 is 3.0 to 3.1 (or about 66% absolute effieffi-ciency for each alpha or beta emission).
2.4. Scintillation Cocktail Prepared On-Site versus in the
Laboratory
Here we compared two situations: 1) right after collection, the samples were in-jected underneath the preloaded scintillator in the vial “on-site”; and 2) the col-lected samples were brought to laboratory and then injected underneath the preloaded scintillator in the vial. A “10 mL scintillator + 10 mL sample” combi-nation was used in both cases. We compared both “Mineral Oil” and “Opti- Fluor” in combination with these two variables.
2.5. Type of Scintillation Fluids
We compared the efficacy of two different scintillation fluids namely, “Opti- Fluor” and “High Efficiency Mineral Oil Scintillator” (PerkinElmer, Waltham, MA), as both are recommended and used for analyzing radon in water. “Opti- Fluor” used in this study is a benzene-based mixture of high flash point and low volatility organic solvents that produced a background count rate of 15 cpm and 71% quench parameter, it is biodegradable. The “High Efficiency Mineral Oil Scintillator” used in this study contains primarily white mineral oil (60% - 80%) and 1, 2, 4-trimethylbenzene (20% - 40%), it is not biodegradable, with a back-ground of 15 cpm and 107.5% counting efficiency.
2.6. Volume of Sample and Scintillation Fluid
[image:6.595.208.541.625.699.2]We compared recovery of radon for two different preparations: “8 mL scintilla tion fluid + 8 mL sample” versus “10 mL scintillation fluid + 10 mL sample”.
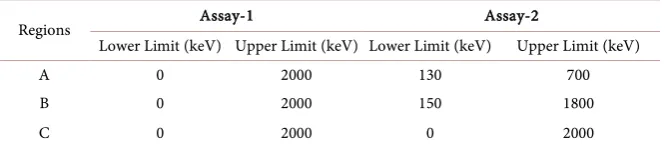
Table 1. The two different LSC assays compared in this study§.
Regions Assay-1 Assay-2
Lower Limit (keV) Upper Limit (keV) Lower Limit (keV) Upper Limit (keV)
A 0 2000 130 700
B 0 2000 150 1800
C 0 2000 0 2000
§Lower and upper limits represents ranges of energy (in kilo-electric-volt) used in the two different LSC
DOI: 10.4236/ajac.2018.91003 33 American Journal of Analytical Chemistry
The volumes used by analytical laboratories vary but must be identical to those used to standardize the Liquid Scintillation Counter used for the analyses.
2.7. Methods of Mixing the Sample and Scintillation Fluid
We compared two different methods of mixing sample and scintillation fluid on
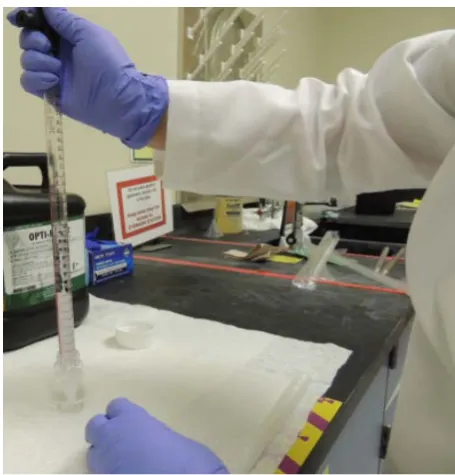
the recovery of radon. For the first method, called “Separate Drawing” (Figure
3), the scintillation fluid (8 or 10 mL) was preloaded into the scintillation vial,
and then the sample (8 mL or 10 mL) was pipetted and injected underneath the
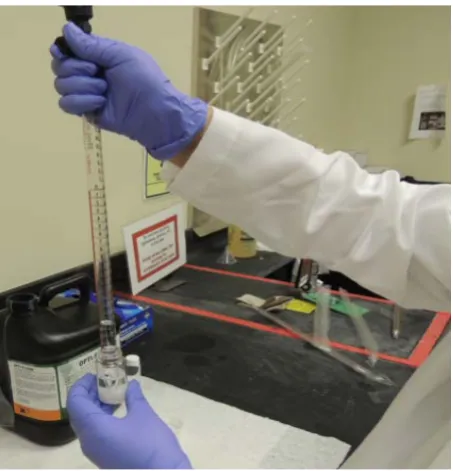
scintillation fluid. The second method, called “Simultaneous Drawing” (Figure
4), had the scintillation fluid (8 mL or 10 mL) drawn into a pipette, then the
wa-ter sample (8 mL or 10 mL) was drawn into the same pipette underneath the scintillation fluid and finally both sample and scintillation fluid were dispensed into the scintillation vial. The vials were capped immediately in both methods and shaken vigorously to expedite transfer of radon into the scintillation fluid.
2.8. Effects of Air Bubble in the Sample
[image:7.595.261.488.459.695.2]After collection of samples with no air bubble, 0.5 mL of water was quickly withdrawn from a set of samples collected from each of “Well-715JP” and “Well- 578TR”. Another set of samples were prepared withdrawing 1 mL of water in the same way. The vials were recapped immediately after such withdrawal. The withdrawal of 0.5 or 1 mL of water created an air bubble of either 0.5 cc or 1 mL thereby enabling us to study the effect of air bubble on radon counts in these two wells. Simultaneous drawing of 10 mL of mineral oil + 10 mL water sample was used to prepare the samples, which were then measured by assay-2 (130 - 700 keV).
DOI: 10.4236/ajac.2018.91003 34 American Journal of Analytical Chemistry
Figure 4. “Simultaneous Drawing” method of making scintil-lation cocktail.
2.9. Procedure for Testing Uranium in Well Waters
Well water samples were preserved by addition of HNO3 to pH < 2 upon receipt
and filtered prior to analysis when suspended solids appear excessive for passage through the ICP nebulizer. Uranium in the acidified-filtered samples was
deter-mined following the EPA method 200.7 [21] on an “ICP-AVOES” instrument;
model “ARCOS FHE” (SPECTRO Analytical Instruments GmbH, Germany). In this method, analysis of samples begins with introduction of the sample into the nebulizer/spray chamber where uniform droplets are swept via an argon gas stream into a high temperature plasma torch. The power delivered by a radio frequency field is absorbed by atomic species in the sample inducing an elec-tronic transition to a higher orbital. Upon passage through this high energy field, the electrons ‘relax’ into more stable orbits by releasing the previously absorbed energy. Much of this released energy is measurable as light in the ultraviolet to visible range of the electromagnetic spectrum. The wavelength of the light emit-ted corresponds to a specific analyte, and it is 385.958 nm for uranium. The in-tensity of the light emitted by uranium is positively correlated to concentration in the original sample, and thus the intensity is calibrated to indicate the con-centration. It is worth mentioning here that this method is appropriate for the simultaneous analysis of any and all analytes specified in EPA method 200.7.
3. Results and Discussion
3.1. Studies on the Well Water Sample
3.1.1. Sampling Method: Direct-Fill Method versus Submerged Bottle Method
DOI: 10.4236/ajac.2018.91003 35 American Journal of Analytical Chemistry
Fill” and “Submerged Bottle” methods. They were prepared in the laboratory by “Simultaneous Drawing” of 10 mL Opti-Fluor fluid and 10 mL sample, and then
counted by “Assay-2 (130 - 700 keV)”. As depicted in Figure 5, measured radon
in “Direct Fill” sampling was significantly lower than that in “Submerged Bottle” sampling for all four wells. Such results suggest that the “Direct Fill” method of sampling is prone to a substantial loss of radon as compared to “Submerged Bot-tle” method. It is also worth mentioning here that it is very difficult to collect a sample by “Direct Fill” without formation of an air bubble. Generally, it required several attempts to collect a bubble free sample. So, this method of sampling was dropped from our laboratory’s recommendation because it is troublesome and susceptible to substantial loss of radon during sampling.
3.1.2. Liquid Scintillation Assays: “Assay-1 (0 - 2000 keV)” versus “Assay-2 (130 - 700 keV)”
Figure 6 shows the results of radon concentrations in the water sampled by the
submerged bottle method from well-6090DFR given by the two LSC assays,
“Assay-1 (0 - 2000 keV)” versus “Assay-2 (130 - 700 keV)”. The “Assay-2” gave significantly higher radon results than “Assay-1” regardless of scintillation fluids (Opti-fluor or mineral oil) and volume ratios of the scintillator: sample (10 mL: 10 mL or 8 mL: 8 mL) used. Thus, it is clear that exclusion of the low-energy portion (prior to 130 keV) with higher background and Bremsstrahlung radia-tion is a better way to analyze radon in water. Similar results were also obtained with the samples from the other three wells (data not shown for the sake of brev-ity).
3.1.3. Sample Preparation: On-Site versus Laboratory
Duplicate samples, collected by the “Submerged Bottle” method from each well, were prepared onsite using 10 mL of mineral oil or Opti-fluor by “Separate Drawing” (2 × 2 = 4 samples for each of the four wells). Another set of 4 samples
Figure 5. Measured radon in four well waters as affected by two different methods of Sampling. • Well-1: 6090DFR; Well-2: 711JPR; Well-3: 715JPR; Well-4: 578TR. Note: Part
of these results was published in the Proceedings of the 2016 International Radon
[image:9.595.208.538.505.669.2]DOI: 10.4236/ajac.2018.91003 36 American Journal of Analytical Chemistry
Figure 6. Measured radon in a well (well-6090DFR) water as affected by two different liquid scintillation assays. Note: Part of these results was published in the Proceedings of
the 2016 International Radon Symposium.
for each well collected by the same method were brought to the laboratory and prepared in the same away using 10 mL of mineral oil or Opti-fluor fluid in dup-licate. All of these 8 samples for each of the four wells were counted on LSC by “Assay-2 (130 - 700 keV)”. The results revealed that the radon concentration in the samples prepared in the laboratory were in general significantly higher than
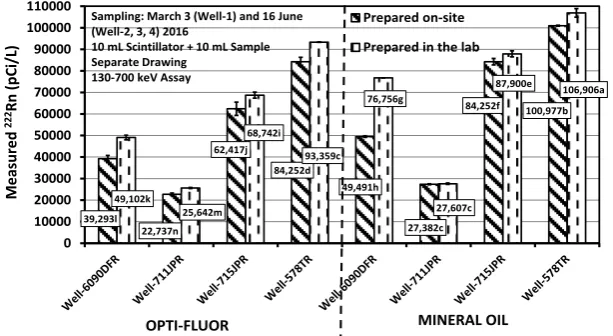
those obtained for the samples prepared on-site (Figure 7), regardless of
wheth-er Opti-fluor or minwheth-eral oil was used as the scintillator. The only exception where these two variables produced statistically similar results was the samples from the well-711JPR prepared in mineral oil. Our results suggest that radon is better retained in the scintillation fluids if the waters are injected under the scin-tillation fluid in the laboratory rather than on-site. Such results may be due the fact that to some extent longer time was elapsed keeping the vial exposed to air in case of on-site preparation as compared to when it was done in the laboratory because preparation in the laboratory was more convenient as compared to on- site. This finding negates the general belief that water sample for testing radon need to be mixed with scintillator on-site. The finding is indeed favorable for practicality because the ordinary homeowners would most likely be unable to inject the right amount of water sample under the scintillation fluid in the vial on-site in correct manner by themselves and it would expose them to the scintil-lation fluid.
3.1.4. Effects of Scintillation Fluid Type, Volume of Scintillation Fluid and Sample, and Methods of Mixing
As depicted in Figure 8, for all four well waters, use of 10 mL mineral oil + 10
mL sample resulted in significantly higher radon count rates than 10 mL Opti- fluor + 10 mL sample regardless of the mixing methods (“Simultaneous Draw-ing” or “Separate DrawDraw-ing”). Mineral oil also yielded significantly higher radon count rates than Opti-fluor when an 8 mL scintillator + 8 mL sample was used (datanotshown).
28,790c 31,560c 41,184b 45,480b 30,316c
58,856a
30,797c
60,390a
20000 25000 30000 35000 40000 45000 50000 55000 60000 65000 70000 75000 80000
Assay-1 (0-2000 keV) Assay-2 (130-700 keV)
8 mL Opti-Fluor+ 8 mL Sample 10 mL Opti-Fluor + 10 mL Sample 8 mL Mineral Oil + 8 mL Sample 10 mL Mineral Oil + 10 mL Sample
M
ea
sur
ed
222
Rn
(p
Ci
/L)
Well-6090DFR
Sampling: March 3 (Submerged Bottle Sampling Method) Prepared in the Lab
DOI: 10.4236/ajac.2018.91003 37 American Journal of Analytical Chemistry
Figure 7. Measured radon in four well waters collected by “Submerged Bottle Method” when scintillation cocktails were prepared onsite versus in the laboratory. • Well-1: 6090DFR; Well-2: 711JPR; Well-3: 715JPR; Well-4: 578TR. Note: Part of these results was
[image:11.595.214.534.312.519.2]published in the Proceedings of the 2016 International Radon Symposium.
Figure 8. Measured radon in four well waters collected by the “Submerged Bottle Me-thod” and prepared in the laboratory with 10 mL Scintillator + 10 mL Sample to compare:
• Two different scintillation fluids: Mineral Oil versusOpti-Fluor. • Two different prepa-ration methods: Separate Drawing versus Simultaneous Drawing. Note: Part of these
re-sults was published in the Proceedings of the 2016 International Radon Symposium.
The extraction of radon from water relies on the fact that radon is more so-luble in organic solvents than in water. When added to water, the Opti-fluor scintillation fluid (emulsifying) initially forms a white emulsion, which should separate into two clear layers before counting to avoid the disruption of extrac-tion and recovery of the radon and interference of water soluble radionuclides, such as radium, with radon counting. Mineral oil is more effective to bring about
such desired separation into two distinct layers faster (Figure 9).
Figure 10 shows that with simultaneous drawing, 10 mL mineral oil + 10 mL
39,293l 22,737n
62,417j 84,252d
49,491h
27,382c
84,252f 100,977b
49,102k
25,642m 68,742i
93,359c 76,756g
27,607c
87,900e 106,906a
0 10000 20000 30000 40000 50000 60000 70000 80000 90000 100000 110000
Prepared on-site Prepared in the lab
OPTI-FLUOR MINERAL OIL
Sampling: March 3 (Well-1) and 16 June (Well-2, 3, 4) 2016
10 mL Scintillator + 10 mL Sample Separate Drawing
130-700 keV Assay
M
ea
sur
ed
222Rn
(p
Ci
DOI: 10.4236/ajac.2018.91003 38 American Journal of Analytical Chemistry
(a) (b)
[image:12.595.211.538.63.436.2](c)
Figure 9. (a) Sample + Fluid (Opti-Fluor and Mineral Oil) at 3 hours after mixing; (b) Sample + Fluid (Opti-Fluor and Mineral Oil) at 5 hours after mixing; (c) Sample + Fluid (Opti-Fluor and Mineral Oil) at 68 hours after mixing.
[image:12.595.216.530.494.669.2]DOI: 10.4236/ajac.2018.91003 39 American Journal of Analytical Chemistry
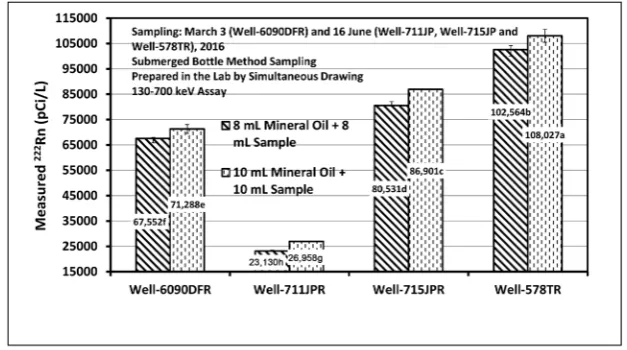
sample resulted in significantly higher radon count rates (i.e., counts per unit
volume of water) than 8 mL mineral oil + 8 mL sample for all four well waters. With separate drawing of mineral oil and sample similar results were obtained
with regards to the effects of these two different volume ratios (datanotshown).
Furthermore, use of 10 mL Opti-fluor + 10 mL sample also gave significantly higher radon count rates than 8 mL Opti-fluor + 8 mL regardless of
simultane-ous or separate drawing (Figure 11).
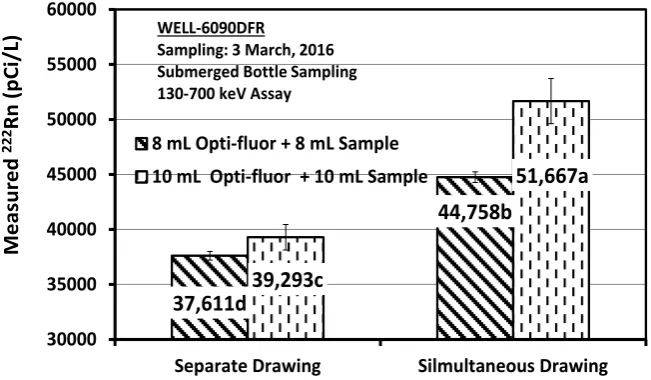
The simultaneous drawing of scintillator and the sample in the same pipette yielded significantly higher radon count rates than their separate drawing
re-gardless of whether mineral oil (Figure 8) or opti-fluor (Figure 11) was the
scintillator and whether the volume ratios of the scintillator: sample was 10 mL:10 mL or 8 mL:8 mL. Such results suggest that some radon escaped, proba-bly into the headspace of the pipette, when done as a “Separate Drawing.
3.1.5. Temporal Variation of Radon Concentration in the Same Well
When the same three wells were sampled and analyzed on two different dates (28 May, 2016 and 16 June, 2016), we obtained remarkably different radon
con-centrations for the two different dates in any given wells (Figure 12). Such
re-sults suggest that temporal variation in radon concentration in the well waters is significant and should be duly considered for determining the actual overall ex-posure of the household members.
3.1.6. Effects of Air Bubble in the Sample
The negative effect of air bubble was paramount. As shown in Figure 13, the
presence of air bubble gave significantly lower radon counts than when air bub-ble was absent. This effect was greater as the size of the air bubbub-ble was larger. As
[image:13.595.211.537.479.669.2]an example, the well-578TR with 108,027 pCi/L radon, a 1 cm3 air bubble
Figure 11. Measured radon in a well (well-6090DFR) collected by the “Submerged Bottle Method” and prepared in the laboratory with Opti-fluor to compare: • Two different vo-lume ratios of Sample: Scintillation Fluid, 8 mL:8 mL versus 10 mL:10 mL. • Two differ-ent preparation methods: Separate Drawing versus Simultaneous Drawing.
37,611d
44,758b
39,293c
51,667a
30000 35000 40000 45000 50000 55000 60000
Separate Drawing Silmultaneous Drawing
8 mL Opti-fluor + 8 mL Sample 10 mL Opti-fluor + 10 mL Sample
WELL-6090DFR
Sampling: 3 March, 2016 Submerged Bottle Sampling 130-700 keV Assay
M
ea
sur
ed
222
Rn
(p
Ci
DOI: 10.4236/ajac.2018.91003 40 American Journal of Analytical Chemistry
Figure 12. Measured radon in three well waters collected by the “Submerged Bottle Me-thod” and prepared in the laboratory by simultaneous drawing of Opti-fluor and sample to compare: • Two different dates of sampling in a given well.
Figure 13. Measured radon in two well waters collected by the “Submerged Bottle Me-thod” and prepared in the laboratory by simultaneous drawing of 10 mL mineral oil and 10 mL sample to compare: • Absence versus presence of 0.5 and 1.0 cc air bubble.
reduced the radon count by 24,508 pCi/L. According to Passo and Floeckher
[22], there could be 4 times as much radon in the air bubble as it would be in an
equal volume of water. Thus, for a 22 mL vial used in this study with 21 mL wa-ter and 1 mL air bubble, 1 mL wawa-ter would contain radon equivalent to 5144
pCi/L for the Well-578TR. Therefore, a 1 cm3 bubble could cause a theoretical
loss of 20,576 pCi/L. However, the measured loss (24,508 pCi/L) was to some extent higher than this theoretical loss, which could be due to additional loss that might have happened during sample preparation. Based on this study, a sample with an air bubble must be rejected even though some literature has re-ported an insignificant effect of an air bubble on the recovery of radon in water.
12,268f 69,267c 68,376b 21,453e 42,756d 96,892a 0 10000 20000 30000 40000 50000 60000 70000 80000 90000 100000 110000
Well-711JPR Well-715JPR Well-578TR 28-May-16
16-Jun-16
Submerged Bottle Sampling Prepared in the lab Simultaneous Drawing
10 mL Opti-fluor + 10 mL Sample 130-700 keV Assay
M
ea
sur
ed
222Rn
(p
Ci
/L)
86,901e 77,140f 108,027a 91,456b 70,726g 83,519c 50000 55000 60000 65000 70000 75000 80000 85000 90000 95000 100000 105000 110000 115000 Well-715JP Well-578TRd
No Air Bubble 0.5 CC Air Bubble 1.0 CC Air Bubble
M eas ur ed 222 Rn (p Ci/ L)
Submerged Bottle Sampling Prepared in the Lab
10 mL Mineral Oil + 10 mL Sample Simultaneous Drawing
[image:14.595.218.538.314.513.2]DOI: 10.4236/ajac.2018.91003 41 American Journal of Analytical Chemistry
Figure 14. Measured radon after 60 d ingrowth in the proficiency testing standard
sam-ples received from New York State Department of Health to compare: • Two different
LSC assays: 0 - 2000 keV versus 130 - 700 kev. • Two different scintillation fluids: Mineral Oil versus Opti-Fluor. • Two different preparation methods: Separate Drawing versus Simultaneous Drawing. Note: Each bar represents the mean and standard error from 8
consecutive measurements carried out at 60 days interval.
3.2. Studies on the Standard Samples
The assigned known concentration of radon in both “Standard-15” and “Stan-dard-17” is 3840 pCi/L with the lower and upper acceptance limits of 2880 (~75% of the known) and 4800 (~125% of the known) pCi/L, respectively (Kitto
et al., 2008b). As depicted in Figure 14, the assay-1 (0 - 2000 keV) gave unac-ceptably lower radon counts (2451 - 2532 pCi/L) than that (4150 - 5133 pCi/L) given by assay-2 (130 - 700 keV) for both Standard-15 and Standard-17 regard-less of using mineral oil or Opti-fluor and simultaneous or separate drawing. The results further show that when measured using assay-2 (130 - 700 keV), use
of “mineral oil” gave higher radon activity than “Opti-fluor” (Figure 14), just as
we observed with the well waters (Figure 8). However, “simultaneous drawing”
gave radon counts statistically identical to “separate drawing” (Figure 14) for
the standard samples despite the fact that “simultaneous drawing” gave signifi-cantly higher radon counts than “separate drawing” for the well water samples
(Figure 8). Such variable results may be related to the fact that the radon
con-centrations in the four well waters (21,453 - 108,027 pCi/L) were much higher than that in the standard samples (4150 - 5133 pCi/L). However, it is worth not-ing that “mineral oil” grossly overestimated the radon activity (5090 and 5133 pCi/L) as compared to their predicted or assigned value (3840 pCi/L).
Figure 15 plots the detailed results of the 10 consecutive radon measurements
carried out at around 60-day intervals at the University of Georgia (UGA) labor-atory using LSC assays and compare these results with those reported by other laboratories across the United States using various methods. The x-axis represents the various laboratories in the US. The y-axis is the measured radon.
2511c
5090a
2511c
5133a
2451c
4252b
2532c
4150b
1000 1500 2000 2500 3000 3500 4000 4500 5000 5500
Assay-1 (0-2000 keV) Assay-2 (130-700 keV)
Simultaneous Drawing in Mineral Oil Separate Drawing in Mineral Oil Simultaneous Drawing in Opti-Fluor Separate Drawing in Opti-Fluor
M
eas
ur
ed
222
Rn
(p
Ci/
L)
DOI: 10.4236/ajac.2018.91003 42 American Journal of Analytical Chemistry
Figure 15. Radon levels in the NYDOH proficiency testing standard samples in 10 con-secutive measurements at around 60-day interval at the University of Georgia (UGA) la-boratory to compare: • Two different LSC assays: 0 - 2000 keV versus 130 - 700 keV. •
Two different scintillation fluids: mineral oil versusopti-fluor. Note: The UGA laboratory
results generated by LSC have been plotted together with the results (obtained from the
coauthor M.E. Kitto, New York State Department of Health) from different laboratories
across the United States generated by various methods.
The data points corresponding to x-axis values1-22 were reported by various
other laboratories in the nation [20] and plotted in ascending order. The data
points corresponding to x-axis values 23 and higher are the values obtained in the UGA laboratory by 4 different sample processing (mineral oil and Opti-fluor in combination with simultaneous and separate drawings: 2 × 2 = 4). The blue- filled and red-filled circles are the results obtained from the cocktails prepared in mineral oil and analyzed the assay-2 (130 - 700 keV ROI) and assay-1 (0 - 200 keV ROI), respectively. The blue-open and red-open circles are the results ob-tained from the cocktails prepared in opti-fluor and analyzed the assay-2 (130 - 700 keV ROI) and assay-1 (0 - 200 keV ROI), respectively.
As depicted in Figure 15, all results generated by the assay-1 (0 - 2000 keV
ROI) were lower than the lower limit of acceptance, which means they all failed. Among the results generated by assay-2 (130 - 700 keV), the data points for the samples prepared in “mineral oil” were mostly higher than the upper limit of acceptance, which means they also failed in most cases. In contrast, all results from Opti-fluor are acceptable, and at least half of them were very close to the true value. Therefore, the assay-1 (0 - 2000 kev ROI) with both mineral oil and Opti-fluor can grossly underestimate the actual radon concentration, and with assay-2 (130 - 700 keV ROI), mineral oil can over-estimate the radon concentra-tion; both of these should be avoided.
3.3. Uranium Concentration
Out of the four wells, three wells (Well-6090DFR, Well-715JP, and Well-578TR) had uranium concentration much higher than the EPA’s drinking water MCL
(Table 2). The uranium level in the Well-711JP was below the MCL. However,
all of the four study wells had radon concentrations much higher than the EPA- proposed MCL of 300 pCi/L as well as the proposed alternate MCL (AMCL) of
2000 2500 3000 3500 4000 4500 5000 5500 6000 6500 7000 7500 8000
0 2 4 6 8 10 12 14 16 18 20 22 24 26 28 30 32 34 36 38 40 42 44 46 48 50 52 54 56 58 60 62 64 66 68 70 72 74 76 78 80 82 84 86 88 90 92 94 96 LSC
Electret CRM Gamma Spec CD etch
UGA LAB-LSC (130-700 keV Assay): Mineral Oil UGA LAB-LSC (130-700 keV Assay): Opti-fluor UGA LAB-LSC (0-2000 keV Assay): Mineral Oil UGA LAB-LSC (0-2000 keV Assay): Opti-fluor
Laboratory M ea su re d
222Rn (
pCi /L )i n th e N YD OH PT Sa m pl es
Known Value: 3840 pCi/L
Upper Limit of Acceptance: 4800 pCi/L (+25% of Known)
Lower Limit of Acceptance: 2880 pCi/L (-25% of Known)
DATA GENERATED BY UGA LAB
DOI: 10.4236/ajac.2018.91003 43 American Journal of Analytical Chemistry
Table 2. Concentration of uranium in the four wells.
Well Date Conc. (ppb)Uranium ‡ Comment Date Conc. (ppb) Uranium
Well-6090DFR 3 March, 2016† 542 Sampled by U. Saha 14 June,
2011§ 629
Well-711JP 20 June, 2016† 22.6 Sampled by D. Lynch
Well-715JP 16 June, 2016† 407 Sampled by U. Saha
Well-578TR 16 June, 2016† 4939 Sampled by U. Saha 15-June,
2011§ 1549
†Sampled and analyzed as part of this study. ‡EPA’s MCL for drinking water is 30 ppb. §Voluntary
submis-sion by the well owner.
4000 pCi/L. Furthermore, the radon concentrations followed the same trend as the uranium concentrations in the wells. Nevertheless, it is important to note here that despite there was no concern about the uranium concentration (22.6 ppb) in the Well-711JP, it contained well over 20,000 pCi/L radon. Therefore, using uranium concentration over 30 ppb as a trigger for recommending test for radon in well water remains questionable. We also noticed temporal variation in the uranium concentration in the well-6090DFR and well-578TR. Such variation was substantially wide in the case of well-578TR (1549 ppb obtained from vo-luntary sample submitted by the well owner in June, 2011 versus 4939 ppb ob-tained when sampled as part of this study in June, 2016).
4. Conclusions
• Direct-fill method is susceptible to significant loss of radon gas; so the
sub-merged bottle method should be used.
• The assay-2 (130 - 700 keV) based on the region of interest for radon is
bet-ter than the assay-2 based on a full spectrum (0 - 2000 keV) analysis.
• An air bubble in a sample results in significant loss of radon gas, and the
loss is higher with larger air bubble size.
• Mineral oil generally gives higher radon count rates than Opti-fluor. But the
results of the two proficiency or standard samples showed that mineral oil clearly overestimated the actual radon concentration whereas Opti-fluor al-ways gave the results close to the predicted or assigned value. As a scintilla-tor for radon in water, it is widely believed that mineral oil is a better scin-tillator for radon than Opti-fuor. But our results show that the opposite is indeed true.
• A 10 mL scintillator + 10 sample combination is better than 8 mL
scintilla-tor + 8 mL sample combination for a liquid scintillation cocktail.
• Separate drawing of scintillator and sample may result in significant loss of
radon, so simultaneous drawing should be adopted when laboratories use open pipettes. However, this effect may be insignificant if a closed-top (no headspace) sampling syringe is used.
• Mixing scintillator and sample in the laboratory is better than making the
DOI: 10.4236/ajac.2018.91003 44 American Journal of Analytical Chemistry
well waters.
• There was noticeable temporal variation in both radon and uranium
con-centrations in the study wells.
• Use of uranium concentration over 30 ppb (theMCLofuraniumin
drink-ingwater) as a trigger for recommending test for radon in well water re-mains questionable because there may be safe level of uranium but unsafe level of radon, and vice versa in a given well water.
Acknowledgements
This study was partially funded by The University of Georgia Radon Education Program which is supported by Georgia Department of Community Affairs through funding from State Indoor Radon Grants (SIRG) program of The Unit-ed States Environmental Protection Agency, Region-4. It is an outcome of col-laboration between The University of Georgia and The Laboratory of Inorganic and Nuclear Chemistry, Wadsworth Center, New York State Department of Health.
References
[1] Cline, W., Adamovitz, S., Blackman, C. and Kahn, B. (1983) Radium and Uranium
Concentrations in Georgia Community Water Systems. Health Physics, 44, 1-12.
https://doi.org/10.1097/00004032-198301000-00001
[2] Hess, C.T., Weiffenbach, C.V. and Norton, S.A. (1983) Environmental Radon and
Cancer Correlations in Maine. Health Physics, 45, 339-348.
https://doi.org/10.1097/00004032-198308000-00006
[3] Zapecza, O.S. and Szabo, Z. (1988) Natural Radioactivity in Ground Water—A
Re-view in National Water Summary 1986, 50-57. Hydrologic Events and Ground- Water Quality, Water-Supply Paper 2325, U.S. Geological Survey, Reston, VA. [4] Coker, G. and Olive, R. (1989) Radionuclide Concentrations from Selected Aquifers
in Georgia. U.S. Environmental Protection Agency Region IV Report, 21 p.
[5] Stone, P.A., Devlin, R.J., Allen, B.P. and Crawford, B.D. (2002) Radionuclides in South Carolina Well Water. Proceedings of the 10th Annual David S. Snipes/Clem-
son Hydrogeology Symposium, April 18 2002, 32.
[6] Albertson, P.N. (2003) Naturally Occurring Radionuclides in Georgia Water
Sup-plies: Implications for Community Water System. In: Hatcher, K.J., Ed.,
Proceed-ings of the 2003 Georgia Water Resources Conference, Athens, Georgia.
[7] World Health Organization (WHO) (2004) Guidelines for Drinking Water Quality.
3rd Edition, World Health Organization, Geneva, Switzerland.
[8] International Commission on Radiological Protection (2007) Publication 100:
Hu-man Alimentary Tract Model for Radiological Protection. Elsevier Sciences, Oxford, United Kingdom.
[9] Wrenn, M.E., Durbin, P.W., Howard, B., Lipsztein, J., Rundo, J. and Still, E.T.
(1985) Metabolism of Ingested U and Ra. Health Physics, 48, 601-633.
https://doi.org/10.1097/00004032-198505000-00004
DOI: 10.4236/ajac.2018.91003 45 American Journal of Analytical Chemistry
[11] Zamora, M.L., Zielinski, J.M., Moodie, G.B., Falcomer, R.A., Hunt, W.C. and
Ca-pello, K. (2009) Uranium in Drinking Water: Renal Effects of Long-Term Ingestion by an Aboriginal Community. Archives of Environmental & Occupational Health, 64, 228-241. https://doi.org/10.1080/19338240903241267
[12] Hopke, P.K., Borak, T.B., Doull, J., Cleaver, J.E., Eckerman, K.F. and Gundersen,
C.S. (2000) Health Risks Due to Radon in Drinking Water. Environmental Science
and Technology, 34, 921-926. https://doi.org/10.1021/es9904134
[13] Darby, S., Hill, D., Auvinen, A., Barros-Dios, J.M., Baysson, H., Bochicchio, F., Deo, H., Falk, R., Forastiere, F., Hakama, M., Heid, I., Kreienbrock, L., Kreuzer, M., La-garde, F., Mkelinen, I., Muirhead, C., Oberaigner, W., Pershagen, G., Ruano-Ravina, A., Ruosteenoja, E., Rosario, A.S., Tirmarche, M., Tomsek, L., Whitley, E., Wich-mann, H.E. and Doll, R. (2005) Radon in Homes and Risk of Lung Cancer: Colla-borative Analysis of Individual Data from 13 European Case-Control Studies.
Brit-ish Medical Journal, 330, 223-226. https://doi.org/10.1136/bmj.38308.477650.63
[14] National Academy of Science (NAS) (1999) National Academy of Science. Report of
the Committee on Risk Assessment of Exposure to Radon in Drinking Water. Board on Radiation Effects Research, Commission on Life Sciences, National Research Council, National Academy Press, Washington, DC.
[15] United States Environmental Protection Agency (USEPA) (2012) A Citizen’s Guide
to Radon, the Guide to Protecting, Yourself and Your Family from Radon. EPA402/ K-12/002|May2012|www.epa.gov/radon.
https://www.epa.gov/sites/production/files/2016-02/documents/2012_a_citizens_gu
ide_to_radon.pdf
[16] Perry, J. (2013) Health Consultation—June 30, 2013: Naturally-Occurring Uranium
in Private Well Water, Juliette, Monroe County, Georgia. Chemical Hazards Pro-gram, Georgia Department of Public Health, Atlanta, GA.
https://dph.georgia.gov/sites/dph.georgia.gov/files/EnvHealth/Chemical/Monroe%2
0County%20HC%206_30_13.pdf
[17] Whittaker, E.L., Akridge, J.D. and Giovano, J. (1989) Two Test Procedures for Ra-don in Drinking Water: Inter-laboratory Collaborative Study. U.S. EPA Environ-mental Monitoring Systems Laboratory, Las Vegas, NV. EPA 600/2-87/082.
[18] New York State Department of Health (NYSDOH) (2007) Environmental Laborato-
ry Approval Program. http://www.wadsworth.org/labcert/elap/radon.html
[19] Kitto, M.E., Fielman, E.M., Haines, D.K., Menia, A. and Bari, A. (2008)
Perfor-mance of a Commercial Radon-in-Water Measurement Kit. Journal of
Environ-mental Radioactivity, 99, 1255-1257. https://doi.org/10.1016/j.jenvrad.2008.03.006
[20] Kitto, M.E., Menia, T.A., Bari, A., Fielman, E.M. and Haines, D.K. (2008)
Develop-ment and Intercomparison of a Reusable Radon-in-Water Standard. Radiation
Measurements, 45, 231-233. https://doi.org/10.1016/j.radmeas.2010.02.002
[21] United States Environmental Protection Agency (USEPA) (1994) Method 200.7
Determination of Metals and Trace Elements in Water and Wastes by Inductively Coupled Plasma-Atomic Emission Spectrometry. Rev. 4.4. U.S. Environmental Pro-tection Agency, Cincinnati, Ohio.
[22] Passo Jr., C.J. and Floeckher, J.M. (1991) The LSC Approach to Radon Counting in Air and Water. In: Ross, H., Noakes, J.E. and Spaulding, J.D., Eds., Liquid