http://www.scirp.org/journal/jgis ISSN Online: 2151-1969
ISSN Print: 2151-1950
DOI: 10.4236/jgis.2017.96043 Dec. 1, 2017 685 Journal of Geographic Information System
Reliability of Recent Global Digital Elevation
Models for Geomatics Applications in
Egypt and Saudi Arabia
Gomaa Dawod
1, Khaled Al-Ghamdi
21Survey Research Institute, National Water Research Center, Giza, Egypt 2Umm Al-Qura University, Makkah, KSA
Abstract
Global Digital Elevation Models (DEMs) have been utilized in various geomat-ics activities worldwide. Recently, there exist several available DEMs vary sig-nificantly in terms of spatial resolution and release dates. This paper examines the reliability of eight recent global DEMs, namely the EarthEnv-D90, SRTM 1, SRTM 3, ASTER, GMTED2010, GLOBE, GTOPO30, and AW3D30, in two study areas in Egypt and Saudi Arabia representing different topography pat-terns. Known ground control points with measured accurate coordinates and precise elevations have been utilized in evaluating the performance of those DEMs. It has been concluded that such a judgment procedure should not be carried based on a single statistical measure. First, five statistical measures, specifically the range, standard deviation, correlation, kurtosis, and skewness, have been evaluated separately for each DEM’s errors. Then, a new reliability index is introduced based on the weighted average concept. The accomplished results show that global DEMs perform differently in different topography pat-terns. It has been concluded that the EarthEnv-D90 and SRTM1 models attain high reliability indexes in the Nile delta region that represents a flat topogra-phy, while the GMTED2010 and EarthEnv-DEM90 models came in the first places for the second study area, Makkah, which represents mountainous to-pography.
Keywords
DEM, Geomatics, Reliability, Egypt, Saudi Arabia
1. Introduction
Digital Elevation Models (DEMs) play an essential role in various geomatics, geo-How to cite this paper: Dawod, G. and
Al-Ghamdi, K. (2017) Reliability of Recent Global Digital Elevation Models for Geo-matics Applications in Egypt and Saudi Arabia. Journal of Geographic Information System, 9, 685-698.
https://doi.org/10.4236/jgis.2017.96043
Received: October 30, 2017 Accepted: November 28, 2017 Published: December 1, 2017
Copyright © 2017 by authors and Scientific Research Publishing Inc. This work is licensed under the Creative Commons Attribution International License (CC BY 4.0).
DOI: 10.4236/jgis.2017.96043 686 Journal of Geographic Information System detic, Geographic Information Systems (GIS) environmental, surveying, and map-ping applications. Some of such utilizations include, for instance, planner and to-pographic mapping [1] [2], hydrological modelling [3] [4] [5], seismic hazard as-sessment [6], morphometric analysis [7], cost distance modelling [8], landslide moni-toring [9], landform classification [10], and climate change impacts monitoring [11] [12].
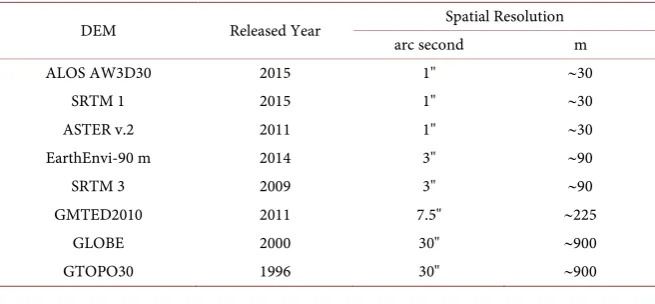
Although there are many available free global DEMs, their accuracy and relia-bility should be quantified prior to actual implementation [13] [14] [15] [16]. This paper investigates the accuracy and reliability of eight existing global DEMs based on several statistical measures. Table 1 summarizes the characteristics of those selected global DEMs, including:
− SRTM: The Shuttle Radar Topography Mission (SRTM) is a global DEM that
has two versions: SRTM1 with a spatial resolution of 1 arc second, i.e., approx-imately 30 meter, and SRTM3 model with a 3 arc second resolution (download from e.g. https://earthexplorer.usgs.gov/).
− ASTER: The Advanced Spaceborne Thermal Emission and Reflection
Radi-ometer (ASTER) is 1 arc second global DEM. The ASTER version 2 has been pub-lically released in 2011 (download from e.g.
https://asterweb.jpl.nasa.gov/gdem.asp).
− EarthEnv-DEM90: A global DEM derived from processing and merging SRTMv4
and ASTER v2 data products to provide continuous coverage of 91% of the globe (download from http://www.earthenv.org/DEM)
− GMTED2010: The Global Multi-resolution Terrain Elevation Data 2010 (GMTED
2010) is a global DEM available with three levels of spatial resolution: 7.5, 15, and 30 arc seconds (download from e.g.
https://earthexplorer.usgs.gov/).
− GLOBE: The Global Land One-km Base Elevation (GLOBE) is a global DEM
with a spatial resolution of 30 arc seconds, i.e. almost 1 kilometer (download from e.g. https://earthexplorer.usgs.gov/).
− GTOPO30: The Global 30 arc-second (GTOPO30) is global DEM derived from
several sources of topographic information (download from e.g.
[image:2.595.210.538.580.732.2]https://earthexplorer.usgs.gov/).
Table 1. Characteristics of the utilized global DEM.
DEM Released Year Spatial Resolution arc second m ALOS AW3D30 2015 1" ∼30
SRTM 1 2015 1" ∼30
ASTER v.2 2011 1" ∼30
EarthEnvi-90 m 2014 3" ∼90
SRTM 3 2009 3" ∼90
GMTED2010 2011 7.5" ∼225
GLOBE 2000 30" ∼900
DOI: 10.4236/jgis.2017.96043 687 Journal of Geographic Information System
− AW3D30: The Advanced Land Observing Satellite (ALOS), is a Japanese
sa-tellite mission resulted in the development of ALOS World 3D - 30 m (AW3D30); a global free DEM with a spatial resolution of 1 arc second (download from
http://www.eorc.jaxa.jp/ALOS/en/aw3d30/).
2. Data and Study Areas
Two study areas have been utilized in this research: the Nile delta region, Egypt and Makkah metropolitan area, Kingdom of Saudi Arabia (KSA). These two test areas have been selected so that the first one represents flat topography envi-ronment, while the second area is representing a hilly or complex topography region. The first study area covers most of the Nile delta region north of Egypt from Alexandria at the west (29.6˚E) to Port Said at the east (32.3˚E) on the Me-diterranean coasts (Figure 1(a)). It is bounded by the two branches of the Nile River, and extending a little bit from both sides to cover coastal areas with exist-ing ground data, with an overall area of approximately 13,000 square kilometers. The topography of the region smoothly slopes northwards towards the Mediter-ranean coast, where the difference in elevation between its southern peak, at Cairo, and northern coastal fringes is approximately 18 meter. 416 control points with measured GPS coordinates along with precise elevations (relative to the Mean Sea Level: MSL datum) have been utilized in this research study. Those points lay mainly on the two Nile branches and on the coasts of the Mediterranean, with an average spacing of 5 kilometers (Figure 1(a)).
The second study area is located at south west of KSA, about 80 kilometers east of the Red sea and extending from latitude 21˚09'N to 21˚37'N and from longitude 39˚35'E to 40˚02'E, covering 1301 square kilometers approximately (Figure 1(b)). Its elevations vary from almost 100 meters in the west to more than 960 me-ters in the west. It is a matter of reality that the topography of Makkah is com-plex in nature, and several mountainous areas exist inside its metropolitan area. With-in this region, 137 ground control poWith-ints with precise MSL-based elevations and GPS coordinates are known and utilized in the research study.
3. Methodology and Data Processing
For global DEM accuracy assessment, the measured elevation of each control point (Hm) has been compared against its corresponding DEM-based elevation (HDEM), and the height differences or DEM errors (∆H) is then estimated:
DEM m
H H H
∆ = − (1)
DOI: 10.4236/jgis.2017.96043 688 Journal of Geographic Information System (a)
[image:4.595.229.515.64.704.2](b)
DOI: 10.4236/jgis.2017.96043 689 Journal of Geographic Information System
(
)
i i
Z = Y −Y− s (2)
where, Yi is an observation, Y− denotes the sample mean, and SD is the sample standards deviation. The computed Zi score, for each observation, is compared against the values obtained from normal distribution table. If the score exceeds the given limits, it is considered as a possible outlier and should be removed.
Next, five statistical measures have been evaluated individually [17], and then a unique reliability index has been proposed and computed. The correlation be-tween observed elevations of the control points (X or HM) and their respective elevation from a particular DEM (Y or HDEM) is computed as:
XY
XX YY
S COR
S S
= (4)
where,
(
)
22
XX
X
S X
n
=
∑
−∑
(5)(
)
22
YY
Y
S Y
n
=
∑
−∑
(6)(
)(
)
XY
X Y
S XY
n
=
∑
−∑
∑
(7)where COR represents the correlation between X and Y,
∑
X ,∑
Y,∑
XYare the summation of X, Y, and XY respectively, and n is the total number of available sample points.
Subsequently, the range of height difference is evaluated as the difference be-tween the maximum and minimum computed differences for each DEM. Third-ly, the standard deviation (SD) of height differences is computed as:
2 1 n H SD n ∆
=
∑
(8)where n is the number of the utilized control points. It is expected that the larger the standard deviation, the flatter the normal distribution curve. The smaller the standard deviation, the higher the peak of the curve. Several research studies [18] [19] depend primly on the standard deviation measure in evaluating DEMs performance, which is not the case in this study. Afterward, a histogram of each DEM errors is plotted, and the skewness and kurtosis statistical measures are evaluated. The skewness is computed as:
3 3 2 2 m sk m
= (9)
where
(
)
33
Y Y
m
n −
=
∑
(10)DOI: 10.4236/jgis.2017.96043 690 Journal of Geographic Information System
(
)
22
Y Y
m
n −
=
∑
(11)The kurtosis, as another measure of the shape of the histogram or the normal distribution curve, is computed as:
4 2 2 m K m
= (12)
where
(
)
44
Y Y
m
n −
=
∑
(13)Having those five statistical measures attained for each DEM, they are catego-rized in a certain manner and a rank is assigned to each DEM in each measure (Ri). For the correlation, range, and standard deviation measures, the ranks vary from 1 to 8 based on the ascending order of those measures for each DEM. For the skewness measure the assigned rank is 8 if its value range between +0.5 and −0.5 (approximately symmetric), 5 if the value range from −1 to −0.5 or from +0.5 and +1 (moderately skewed), and 3 if the skewness is between −1 and +1 (highly skewed). For the kurtosis measure the assigned rank is 8 if the kurtosis equals 3, 5 if the kurtosis is greater than 3, and 3 if the kurtosis is less than 3.
In the last step, a new reliability index (RI) is introduced and computed for each DEM, based on the weighted mean approach. It ranges from zero as the lowest reliability of a DEM, to value of 10 represents the highest reliability. This concept is similar to the optimization approach utilized in GIS applications (e.g. [20]). The selected weights (Wj) are: a value of 4 for the standard deviation, 2 for both the range and the correlation, and 1 for both kurtosis and skewness. The reliability index measure is computed as:
i j
R W RI
W
=
∑
∑
(14) where∑
W denotes the sum of the utilized weight, i.e. 10.4. Results and Discussion
DOI: 10.4236/jgis.2017.96043 691 Journal of Geographic Information System
Table 2. (a) Statistical measures of DEM elevations in delta area; (b) Statistical measures of DEM elevations in Makkah area.
(a)
Min Max Mean Correlation
Observed H −1.9 22.3 8.7 NA
SRTM 1 −4.8 24.0 7.2 0.92
SRTM 3 −3.0 25.9 7.1 0.89
EarthEnv-DEM90 −4.0 28.2 6.7 0.94
GTOPO30 −6.6 35.9 10.7 0.47
GMTED2010 −5.1 29.1 7.1 0.90
ASTER −4.4 34.5 11.1 0.57
GLOBE −6.3 30.4 10.2 0.47
AW3D30 −4.0 39.2 8.0 0.94
(b)
Min Max Mean Correlation Observed H 147.1 420.9 269.4 NA
SRTM 1 140.5 424.4 273.5 0.996 SRTM 3 146.4 424.4 273.4 0.997 EarthEnv-DEM90 148.2 425.0 274.0 0.997 GTOPO30 133.8 432.2 278.9 0.958 GMTED2010 149.0 426.0 274.1 0.997 ASTER 142.6 421.2 269.4 0.989 GLOBE 132.8 419.0 265.5 0.979 AW3D30 149.2 425.5 275.9 0.995
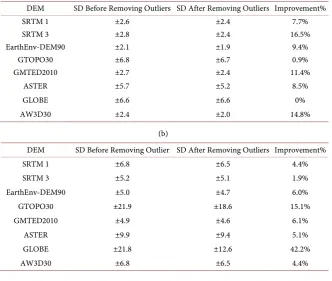
Table 3. (a) Statistical characteristics of DEM errors in Delta area; (b) Statistical characte-ristics of DEM errors in Makkah area.
(a)
DEM SD Before Removing Outliers SD After Removing Outliers Improvement%
SRTM 1 ±2.6 ±2.4 7.7%
SRTM 3 ±2.8 ±2.4 16.5%
EarthEnv-DEM90 ±2.1 ±1.9 9.4%
GTOPO30 ±6.8 ±6.7 0.9%
GMTED2010 ±2.7 ±2.4 11.4%
ASTER ±5.7 ±5.2 8.5%
GLOBE ±6.6 ±6.6 0%
AW3D30 ±2.4 ±2.0 14.8%
(b)
DEM SD Before Removing Outlier SD After Removing Outliers Improvement%
SRTM 1 ±6.8 ±6.5 4.4%
SRTM 3 ±5.2 ±5.1 1.9%
EarthEnv-DEM90 ±5.0 ±4.7 6.0%
GTOPO30 ±21.9 ±18.6 15.1%
GMTED2010 ±4.9 ±4.6 6.1%
ASTER ±9.9 ±9.4 5.1%
GLOBE ±21.8 ±12.6 42.2%
[image:7.595.209.542.451.732.2]DOI: 10.4236/jgis.2017.96043 692 Journal of Geographic Information System should be applied in similar studies in order to detect and remove gross errors prior to further analysis. From Table 3, it can be seen that, after removing out-liers, the EarthEnv-DEM90 and GMTED2010 models attain the smallest stan-dard deviation in both study areas as ±1.9 and ±4.6 m respectively. Therefore, the difference in these two values implicitly implies that global DEMs perform better in flat area than in hilly or complex topography. Similar results have been reported by other researchers [18] [19] [21] particularly for SRTM and ASTER models. In addition, those accuracy measures confirm the known fact that global DEMs should not be the first option to be utilized in high-precision geomatics activities.
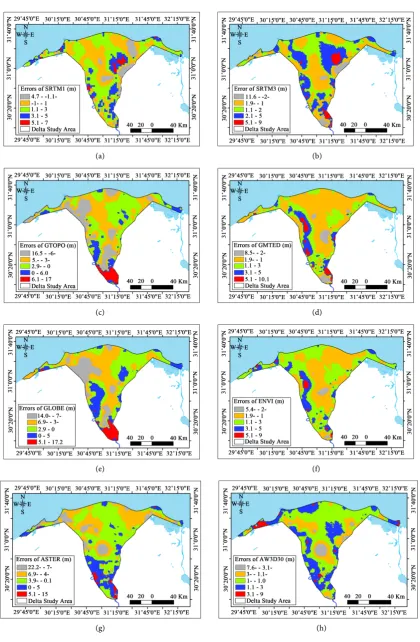
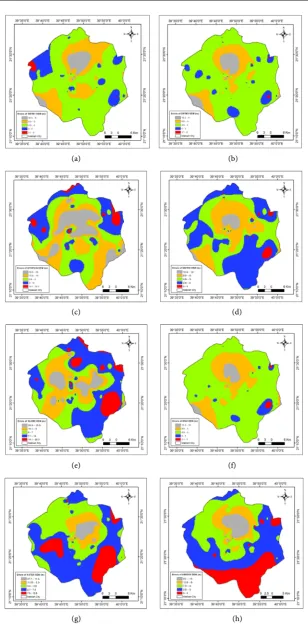
Next, the height differences or DEMs’ errors have been computed, for all uti-lized models, at both study areas (Figures 2(a)-(h) and Figures 3(a)-(h)). Know-ing that the elevations in the Delta region decrease from north to east and that in the Makkah region increase from east to west, it can be seen from these two figures that all global DEMs do not follow that particular schemes. Hence, it can be con-cluded that those errors do not spatially depend on geographic locations in both case study areas.
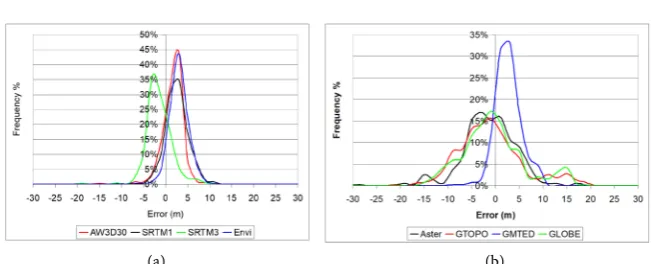
The statistical measures for utilized DEMs have been computed and presented in Table 4, and their histograms are plotted in Figure 4(a) and Figure 4(b), Fig-ure 5(a) and Figure 5(b). From Table 4(a) it can be realized that the AW3D30 model has the lowest mean value of the DEM errors in the first area, while ASTER has it in the second area. However, both models did not get the smallest error range. Additionally, the EarthEnv-DEM90 model has the smallest error range in both case studies respectively, even though it does not attain the smallest mean error value. Consequently, it can be said that judgment of DEMs performance can-not be evaluated based on just one statistical quantity.
Figure 4(a) and Figure 4(b), Figure 5(a) and Figure 5(b) also reveal notewor-thy remarks, from which it can be recognized that in both study regions, ASTER, GTOPO30, and GLOBE models present histograms spread over larger area with lower peaks. That generally implies that the error distributions of those global DEMs are relatively far away from the normal distribution and spread over wider ranges. This remark can be also recognized from the bigger errors range values presented in Table 4 for both study areas.
DOI: 10.4236/jgis.2017.96043 693 Journal of Geographic Information System
Table 4. (a) Statistical measures of DEM errors in delta area; (b) Statistical measures of DEM errors in Makkah area.
(a)
DEM Min Max Range Mean Kurtosis Skewness SRTM 1 −11.6 9.4 21.0 1.6 1.5 −0.01 SRTM 3 −16.2 11.7 27.9 1.6 4.7 −0.1 EarthEnv-DEM90 −7.6 9.5 17.1 2.0 1.4 −0.1 GTOPO30 −21.3 19.0 40.3 −2.0 0.6 0.6 GMTED2010 −10.5 9.4 19.9 1.6 1.4 0.1 ASTER −29.1 17.6 46.7 −2.4 2.1 −0.4 GLOBE −16.0 17.0 33.0 −1.5 0.3 0.6 AW3D30 −16.9 8.9 25.8 0.7 8.3 −1.4
(b)
DEM Min Max Range Mean Kurtosis Skewness SRTM 1 −18.7 11.1 29.8 −4.2 0.4 −0.2 SRTM 3 −17.1 8.4 25.5 −4.1 0.2 −0.5 EarthEnv-DEM90 −17.5 5.3 22.8 −4.6 0.1 −0.5 GTOPO30 −52.1 32.6 84.7 −9.6 −0.9 −0.2 GMTED2010 −18.6 5.7 24.2 −4.7 0.2 −0.4 ASTER −28.3 20.3 48.6 −0.01 0.6 −0.7 GLOBE −27.1 28.5 55.7 3.9 0.05 −0.8 AW3D30 −24.1 6.9 31.0 −6.3 0.5 −0.9
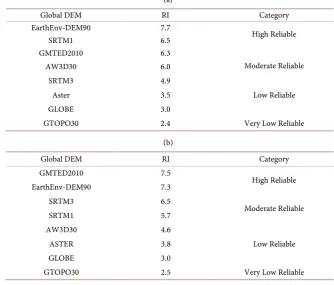
Table 5. (a) Reliability index of Global DEM in delta area; (b) Reliability index of global DEM in Makkah area.
(a)
Global DEM RI Category
EarthEnv-DEM90 7.7
High Reliable
SRTM1 6.5
GMTED2010 6.3
Moderate Reliable
AW3D30 6.0
SRTM3 4.9
Low Reliable
Aster 3.5
GLOBE 3.0
GTOPO30 2.4 Very Low Reliable (b)
Global DEM RI Category
GMTED2010 7.5
High Reliable EarthEnv-DEM90 7.3
SRTM3 6.5
Moderate Reliable
SRTM1 5.7
AW3D30 4.6
Low Reliable
ASTER 3.8
GLOBE 3.0
[image:9.595.204.539.444.729.2]DOI: 10.4236/jgis.2017.96043 694 Journal of Geographic Information System
(a) (b)
(c) (d)
(e) (f)
[image:10.595.89.510.60.703.2]
(g) (h)
DOI: 10.4236/jgis.2017.96043 695 Journal of Geographic Information System (a) (b)
(c) (d)
(e) (f)
[image:11.595.219.528.57.691.2]
(g) (h)
DOI: 10.4236/jgis.2017.96043 696 Journal of Geographic Information System (a) (b)
Figure 4. Histograms of DEM errors in Nile delta study area.
(a) (b)
Figure 5. Histograms of DEM errors in Makkah study area.
resolution of a DEM. Additionally, it can be seen that the GMTED2010, AW3D30 present a moderate reliability index in the first study area and SRTM1 and SRTM 3 gave the same result in the second area. Moreover, the older models, namely GLOBE and GTOPO30, came in the last places, from the reliability point of view, in both study areas. That might be due to the recent development attained, in the last few years, in both sensor development and data processing techniques.
5. Conclusions
This research study has investigated the reliability of eight recent global digital eleva-tion models for geomatics and GIS applicaeleva-tions. Those models include EarthEnv-D90, SRTM 1, SRTM 3, ASTER, GMTED2010, GLOBE, GTOPO30, and AW3D30. The evaluation has been carried out over two study areas: the Nile delta region, Egypt, representing a flat topography, and Makkah metropolitan area, Saudi Arabia representing a hilly or complex topography region. 416 and 137 control points with measured GPS coordinates along with precise elevations have been utilized in both areas respectively. First, the outlier detection procedure has been applied using the Z-score approach in order to increase the accuracy and integrity of the datasets. It has been concluded that the improvements, or the reduction of the standard deviation, have averages of 8.6% and 10.1% for both study areas re-spectively. Accordingly, the outlier detection should be a regular routine applied in similar studies.
re-DOI: 10.4236/jgis.2017.96043 697 Journal of Geographic Information System liability index is introduced based on the weighted average concept and has been applied in two study areas in both Egypt and Saudi Arabia. The attained results showed that the EarthEnv-D90 and SRTM1 models attain high reliability index-es in the Nile delta region that reprindex-esents a flat topography. In addition, for the second study area, Makkah, which represents mountainous topography, the GMTED 2010 and EarthEnv-DEM90 models came in the first places on the relative relia-bility scale of ten. Moreover, the accomplished findings reveal that global DEMs perform better in flat area than in hilly or complex topography. Furthermore, it is concluded that even though the accuracy measures of global DEMs are not high, they present a good candidate when accurate local models are not available.
References
[1] Elaksher, A. (2017) Automatic Correction of DEM Surface Errors. Journal of Geo-graphic Information System, 9, 326-338. https://doi.org/10.4236/jgis.2017.93020 [2] Ouerghi, S., Elsheikh, R., Achour, H. and Bouazi, S. (2015) Evaluation and
Valida-tion of Recent Freely-Available ASTER-GDEM V.2, SRTM V.4.1, and DEM Derived from Topographic Maps over SW Grombalia (Test Area) in North East of Tunisia. Journal of Geographic Information System, 7, 266-279.
https://doi.org/10.4236/jgis.2015.73021
[3] Reddy, G., Kumar, N., Sahu, N. and Singh, S. (2017) Evaluation of Automatic Drai-nage Extraction Thresholds Using ASTER GDEM and Cartosat-1 DEM: A Case Study from Basaltic Terrain of CENTRAL India. The Egyptian Journal of Remote Sensing and Space Sciences. https://doi.org/10.1016/j.ejrs.2017.04.001
[4] Fernandeza, A., Adamowskib, J. and Petrosellic, A. (2016) Analysis of the Behavior of Three Digital Elevation Model Correction Methods on Critical Natural Scenarios. Journal of Hydrology: Regional Studies, 8, 304-315.
https://doi.org/10.1016/j.ejrh.2016.09.009
[5] Dawod, G., Mirza, M. and Al-Ghamdi, K. (2011) GIS-Based Spatial Mapping of Flash Flood Hazards in Makkah City, Saudi Arabia. Journal of Geographic Informa-tion System, 3, 217-223. https://doi.org/10.4236/jgis.2011.33019
[6] Ahmed, R. and Singh, R. (2017) Seismic Hazard Assessment of Syria Using Seismic-ity, DEM, Slope, Active Faults, and GIS. Journal of Remote Sensing Applications: Society and Environment, 6, 59-70. https://doi.org/10.1016/j.rsase.2017.04.003 [7] Farahan, Y. (2017) Morphometric Assessment of Wadi Wala Watershed, Southern
Jordan Using ASTER (DEM) and GIS. Journal of Geographic Information System, 9, 158-190. https://doi.org/10.4236/jgis.2017.92011
[8] Becker, D., de Andrés-Herrero, M., Willmes, C., Weniger, G. and Bareth, G. (2017) Investigating the Influence of Different DEMs on GIS-Based Cost Distance Model-ing for Site Catchment Analysis of Prehistoric Sites in Andalusia. International Journal of Geo-Information, 6, 1-28.
[9] Du, Y., Xu, Q., Zhang, L., Feng, C. and Lin, C. (2017) Recent Landslide Movement in Tsaoling, Taiwan Tracked by TerraSAR-X/TanDEM-X DEM Time Series. Jour-nal of Remote Sensing, 9, 353. https://doi.org/10.3390/rs9040353
[10] Mokarrama, M. and Hojati, M. (2016) Landform Classification Using a Sub-Pixel Spatial Attraction Model to Increase Spatial Resolution of Digital Elevation Model (DEM). The Egyptian Journal of Remote Sensing and Space Sciences.
DOI: 10.4236/jgis.2017.96043 698 Journal of Geographic Information System [11] Hasan, E., Khan, S. and Hong, Y. (2015) Investigation of Potential Sea Level Rise
Impact on the Nile Delta, Egypt Using Digital Elevation Models. Journal of Envi-ronmental Assessment Monitoring, 187, 649.
https://doi.org/10.1007/s10661-015-4868-9
[12] Al-Ghamdi, K., Mirza, M., Elzahrany, R. and Dawod, G. (2012) GIS Evaluation of Urban Growth and Flood Hazards: A Case Study of Makkah City, Saudi Arabia. FIG Working Week 2012, Rome, 6-10 May 2010.
[13] Elkhrachy, I. (2017) Vertical Accuracy Assessment for SRTM and ASTER Digital Elevation Models: A Case Study of Najiran City, Saudi Arabia. Ain Shams Engi-neering Journal. https://doi.org/10.1016/j.asej.2017.01.007
[14] Al-Karargy, E., Hosny, M. and Dawod, G. (2015) Investigating the Precision of Re-cent Global Geoid Models and Global Digital Elevation Models for Geoid Modelling in Egypt. The Regional Conference on Surveying and Development, Sharm El-Sheikh, 3-6 October 2015.
[15] Mukherjee, S., Joshi, P., Mukherjee, S., Chosh, A., Garg, R.D. and Mukhopadhyay, A. (2013) Evaluation of Vertical Accuracy of Open Source Digital Elevation Model (DEM). International Journal of Applied Earth Observation and Geoinformation, 21, 205-217. https://doi.org/10.1016/j.jag.2012.09.004
[16] Mirza, M.,Dawod, G. and Al-Ghamdi, K. (2011) Accuracy and Relevance of Digital Elevation Models for Geomatics Applications—A Case Study of Makkah Munici-pality, Saudi Arabia. International Journal of Geomatics and Geosciences, 1, 803-812. [17] NIST (US National Institute of Standards and Technology) (2012) Engineering
Sta-tistics Handbook.
http://www.itl.nist.gov/div898/handbook/toolaids/pff/E-Handbook.pdf
[18] Althumania, D. and Achour, H. (2014) External Validation of the ASTER GDEM2, GMTED2010 and CGIAR-CSI-SRTM v4.1 Free Access Digital Elevation Models (DEMs) in Tunisia and Algeria. Journal of Remote Sensing, 6, 4600-4620.
[19] Patel, A., Katiyar, S. and Prasas, V. (2016) Performance Evaluation of Different Open Source DEM Using Differential Global Positioning System (DGPS). The Egyptian Jour-nal of Remote Sensing and Space Sciences, 19, 7-16.
https://doi.org/10.1016/j.ejrs.2015.12.004
[20] Dawod, G., Al-Ghamdi, K. and Mandoer, M. (2017) Optimum Sites for Solar Ener-gy Harvesting in Makkah Metropolitan Area Based on Multi-Criteria GIS. The 11th National Conference on GIS Applications, Imam Abdul Rahman Bin Faisal Univer-sity, Dammam, Saudi Arabia, 11-13 April 2017. (In Arabic)
[21] Ghaieb, A., Rebai, N. and Bouaziz, S. (2016) Vertical Accuracy Assessment of SRTM Ver 4.1 and ASTER GDEM Ver 2 Using GPS Measurements in Central West of Tu-nisia. Journal of Geographic Information System, 8, 57-64.