A Benchmark Data Set for Model-Based Glycemic Control in Critical Care
J. Geoffrey Chase, Ph.D., M.S., B.S.,
1Aaron LeCompte, B.E. (Hons),
1Geoffrey M. Shaw, MBChB, FANCZA, FJFICM,
2Amy Blakemore, B.E. (Hons),
1Jason Wong, B.E. (Hons),
1Jessica Lin, B.E. Ph.D., B.E. (Hons),
3and Christopher E. Hann, Ph.D., B.Sc.
1Author Affiliations:1University of Canterbury, Centre for Bio-Engineering, Department of Mechanical Engineering, Christchurch, New Zealand; 2Department of Intensive Care, Christchurch Hospital, University of Otago School of Medicine, Christchurch, New Zealand; and 3University of Otago School of Medicine, Christchurch, New Zealand
Abbreviations: (APACHE II) Acute Physiology and Chronic Health Evaluation II, (ICU) intensive care unit, (LoS) length of stay, (SI) international system of units, (SPRINT) Secondary Prevention Reinfarction Israeli Nifedipine Trial
Keywords: clinical results, control, critical care, glucose variability, hyperglycemia, model based, mortality
Corresponding Author: J. Geoffrey Chase, Ph.D., M.S., B.S., University of Canterbury, Centre for Bio-Engineering, Department of Mechanical Engineering, Private Bag 4800, Christchurch, New Zealand; email address [email protected]
Volume 2, Issue 4, July 2008 © Diabetes Technology Society
Abstract
Background:
Hyperglycemia is prevalent in critical care. That tight control saves lives is becoming more clear, but the “how” and “for whom” in repeating the initial results remain elusive. Model-based methods can provide tight, patient-specific control, as well as providing significant insight into the etiology and evolution of this condition. However, it is still often difficult to compare results due to lack of a common benchmark. This article puts forward a benchmark data set for critical care glycemic control in a medical intensive care unit (ICU). Based on clinical patient data from Secondary Prevention Reinfarction Israeli Nifedipine Trial (SPRINT) studies, it provides a benchmark for comparing and analyzing performance in model-based glycemic control.
Methods:
Data from 20 of the first 150 postpilot patients treated under SPRINT are presented. All patients had longer than a 5-day length of stay (LoS) in the Christchurch ICU. The benchmark data set matches overall patient data and glycemic control results for the entire cohort and this particular LoS >5-day group. The mortality
outcome (n = 3, 15%) also matches SPRINT results for this patient group.
Results:
Data cover 20 patients and 6372 total patient hours with an average of 339.4 hours per patient. It includes insulin and nutrition inputs along with 4182 blood glucose measurements at an average of 224.3 measurements per patient, averaging a measurement approximately every 1.5 hours (16 per day). Data are available via download in a Microsoft Excel format. A series of cumulative distribution functions and tables are used to summarize data in this article.
Conclusion:
Model-based methods can provide tighter, more adaptable “one method fits all” solutions using methods that enable patient-specific modeling and control. A benchmark data set will enable easier model and protocol development for groups lacking clinical data, as well as providing a benchmark to compare results of different protocols on a single (virtual) cohort based on real clinical data.
Introduction
H
yperglycemia is prevalent in critical care.1–4Increased counterregulatory hormone secretion stimulates endogenous glucose production and increases effective
insulin resistance,3,4 elevating equilibrium glucose levels
and reducing the amount of glucose that the body can utilize with a given amount of insulin. Nutritional regimes with high glucose content can exacerbate the
issue further.5–10
Hyperglycemia worsens outcomes, increasing the risk
of severe infection,11 myocardial infarction,1 and
poly-neuropathy and multiple-organ failure.2,12 Evidence also
exists of significant reductions in other therapies with
aggressive glycemic control.2,13–17 Van den Berghe et al.2,16,17
and Krinsley14,15 reduced intensive care unit (ICU)
patient mortality 18–45% for patients with a length of stay greater than 3 days. Both studies also showed significant
cost savings per patient.18,19 Other studies focused
primarily on glucose control are limited in duration or patient numbers and do not extend to mortality end
points.20–25
All of these studies used ad-hoc sliding scale or titration-based protocols developed primarily by clinical experience (i.e., expert-based control), a typical “one size fits all” solution. They are thus less optimal when faced with the dynamic patient variation typical of critical
care. This issue has been illustrated in simulation26,27
and clinical analysis.7,27–33 There is also little agreement
on what constitutes desirable glycemic performance,34–36
particularly with regard to how tight control affects outcome, although evidence is emerging that tighter is better.37,38
In contrast, model-based tight glycemic control protocols
have been successful in producing consistent control.28,39–44
The general state of model-based glycemic control for
critical care has been reviewed,45 although the field is
evolving rapidly. However, almost all such model-based clinical studies have been first trialled using some form of virtual patient or simulator that is typically based
on retrospective clinical data,46–49 with similar uses
in controlling type 1 diabetes.50–55 Thus, a significant
prerequisite of model-based methods is the availability of
clinical data, or other validated virtual patient models,56,57
on which to test and develop glycemic control protocols.
Finally, it is often very difficult to compare results. Differences across patient cohorts, condition, and other
variables are almost impossible to reasonably normalize or eliminate, making concrete direct comparison of results from different studies or virtual trials infeasible. What is needed is the ability to compare different protocols on the same patient, a task that is most reasonably feasible in virtual or simulated trials. The benchmark data set presented here offers the opportunity to make these comparisons in an open source data set from the ongoing clinical implementation of the SPRINT protocol, which has significantly reduced mortality for a general medical ICU cohort in Christchurch Hospital
(New Zealand).26,48,58–60
Methods
Benchmark Patient Cohort
All 20 patients were part of the ongoing Secondary Prevention Reinfarction Israeli Nifedipine Trial (SPRINT) clinical practice change in the Department of Intensive Care Medicine at Christchurch Hospital. The details of SPRINT and its development are well documented from initial virtual trials to pilot study results and correlation of virtual results with clinical results and the end result of
this approach to glycemic control.26,48,59,60 However, main
criteria to note for this benchmark data set include the following.
• Entry criteria: random glucose greater than 8 mmol/liter or clinician’s choice based on condition, and enteral or parenteral nutrition
• Exclusion criteria: none
• Length of stay greater than 5 days on SPRINT
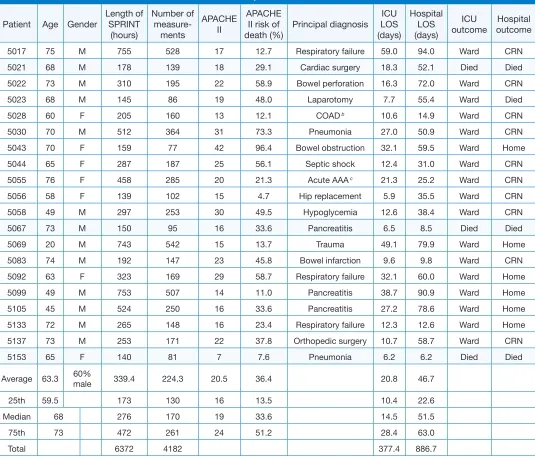
Specific patient data are presented in Table 1, including
age, sex, Acute Physiology and Chronic Health Evaluation II (APACHE II) score and associated risk of death, principal diagnosis, and the ICU and hospital mortality outcome. Summary statistics are presented in the bottom portion.
All patient data are for time on SPRINT. Stopping criteria for SPRINT were implemented when the patient was
stable and only required 2 U/hour or less of insulin.26
Therefore, time spent on SPRINT may be shorter than
the total ICU stay in Table 1.
SPRINT and Treatment Data
Almost all insulin was given as intravenous boluses over ~15–30 seconds, but a few patients may have also received a background intravenous infusion. Infusions are shown separately in data and were given for various clinical reasons. The insulin employed for all patients was Actrapid™ (Novo Nordisk Pharmaceuticals Ltd., NZ).
All patients were on a constant nasogastric feed of RESOURCE™ Diabetic (Novartis Medical Nutrition)
[image:3.612.40.575.86.546.2]or Glucerna (Abbott Laboratories, Illinois) at a rate not exceeding 700 kilocalories of glucose per day (~90 ml/h). This nutritional input has an approximate caloric value of 1 kcal/ml, with 35% derived from carbohydrate. Thus, it provides approximately 0.49 mmol/ml of glucose input. The minimum feeding rate in SPRINT is 30% of a patient-specific specified goal feed rate. However, lower values may be seen in data, particularly in the first few hours, where clinicians have adjusted it based on specific
Table 1.
Benchmark Patient Cohort Data with Relevant Summary Statistics a
Patient Age Gender Length of SPRINT (hours)
Number of
measure-ments
APACHE II
APACHE II risk of
death (%) Principal diagnosis ICU LOS (days)
Hospital LOS (days)
ICU
outcome outcomeHospital
507 75 M 755 58 7 .7 Respiratory failure 59.0 94.0 Ward CRN
50 68 M 78 9 8 9. Cardiac surgery 8. 5. Died Died
50 7 M 0 95 58.9 Bowel perforation 6. 7.0 Ward CRN
50 68 M 45 86 9 48.0 Laparotomy 7.7 55.4 Ward Died
508 60 F 05 60 . COAD b 0.6 4.9 Ward CRN
500 70 M 5 64 7. Pneumonia 7.0 50.9 Ward CRN
504 70 F 59 77 4 96.4 Bowel obstruction . 59.5 Ward Home
5044 65 F 87 87 5 56. Septic shock .4 .0 Ward CRN
5055 76 F 458 85 0 . Acute AAA c . 5. Ward CRN
5056 58 F 9 0 5 4.7 Hip replacement 5.9 5.5 Ward CRN
5058 49 M 97 5 0 49.5 Hypoglycemia .6 8.4 Ward CRN
5067 7 M 50 95 6 .6 Pancreatitis 6.5 8.5 Died Died
5069 0 M 74 54 5 .7 Trauma 49. 79.9 Ward Home
508 74 M 9 47 45.8 Bowel infarction 9.6 9.8 Ward CRN
509 6 F 69 9 58.7 Respiratory failure . 60.0 Ward Home
5099 49 M 75 507 4 .0 Pancreatitis 8.7 90.9 Ward Home
505 45 M 54 50 6 .6 Pancreatitis 7. 78.6 Ward Home
5 7 M 65 48 6 .4 Respiratory failure . .6 Ward Home
57 7 M 5 7 7.8 Orthopedic surgery 0.7 58.7 Ward CRN
55 65 F 40 8 7 7.6 Pneumonia 6. 6. Died Died
Average 6. 60% male 9.4 4. 0.5 6.4 0.8 46.7
5th 59.5 7 0 6 .5 0.4 .6
Median 68 76 70 9 .6 4.5 5.5
75th 7 47 6 4 5. 8.4 6.0
Total 67 48 77.4 886.7
a Hospital outcomes include “Home” for patients who returned home and “CRN” for those who went to chronic nursing care centers. ICU
survivors go to less acute wards, denoted “Ward.” Mortalities are shaded. These data can also be compared to full SPRINT cohort data presented elsewhere.60
clinical needs. These adjustments are seen in less than 0.3% of the total hours. Some patients received parenteral nutrition with 12.5% dextrose for a short part of their stay for clinical reasons, which is listed separately in glucose infusion data. Additionally, there will be some hours without nutritional input, usually before or after surgery or due to other complications, during which
time SPRINT only utilizes the insulin wheel.26,59
Sensor and dosing errors can be problematic in glycemic control. In this case, there were no errors in dose or timing reported for the nutrition and insulin inputs given. All timings were rounded to the nearest hour given based on the format of the clinical data sheets used in Christchurch Hospital. Data for nutrition and insulin were thus obtained directly from what the clinical staff recorded in the patient records while using SPRINT and were assumed to occur on or near the hour recorded. Hence, no further error was assumed for these values when used in modeling. However, the glucose measurements were all made using bedside Glucocard™ test strip II glucose testing kits (Arkray, Inc., Kyoto, Japan), which have a reported error of 7–10% depending on glycemic level, and occasional much larger unexplained
errors.48 These sensor errors were thus embedded within
data provided.
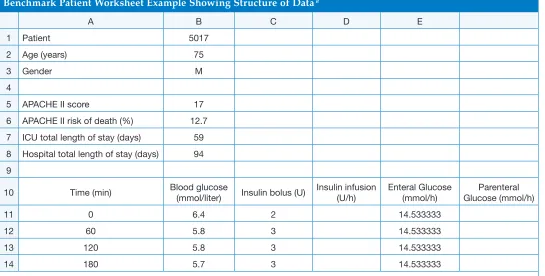
Data Files, Structure, and Units
Data are provided in Microsoft Excel worksheets in a single overall spreadsheet file. Each sheet has data for a single patient, including the basic patient number and data on length of stay. Data can be exported readily from this format to the computational environment of choice
(e.g., Matlab or C/C++). Table 2 shows the initial portion
of the first patient record (patient 5017) as an exemplar. The international system of units (SI) (mmol/liter) is given for all data, as well. Note that millimoles per liter and similar SI are used because they were the original units provided by the sensors, and there are thus no conversions or other manipulations placed on data. In the remainder of this article, where specific values are referenced in millimoles per liter, the equivalent milligrams per deciliter value is given in parentheses immediately following. The tables and figures utilize only millimoles per liter units to match data.
[image:4.612.37.582.440.716.2]Within the associated Excel spreadsheet for a given patient a series of color codes and notes are used. Pink delineates the start of SPRINT using both insulin and nutrition wheels. Green denotes periods where nutritional inputs were shut off for clinical reasons and only the insulin wheel portion of SPRINT is used. Some very evident periods of noncompliance to the
Table 2.
Benchmark Patient Worksheet Example Showing Structure of Data a
A B C D E
Patient 507
Age (years) 75
Gender M
4
5 APACHE II score 7
6 APACHE II risk of death (%) .7 7 ICU total length of stay (days) 59 8 Hospital total length of stay (days) 94 9
0 Time (min) Blood glucose (mmol/liter) Insulin bolus (U) Insulin infusion (U/h) Enteral Glucose (mmol/h) Glucose (mmol/h)Parenteral
0 6.4 4.5
60 5.8 4.5
0 5.8 4.5
4 80 5.7 4.5
SPRINT protocol by the attending clinical staff at that time are shaded blue, although these changes or deviations may have been clinically related but not specifi ed in the notes. Periods where SPRINT has been stopped are highlighted in yellow with an associated note if it is evident that it was stopped by protocol or for clinical reasons.
Performance Metrics and Statistics
Statistically, all data are presented using lognormal statistics or nonparametric counted values. Normal statistics for glycemic control are often in error because of the skew seen in the distributions with higher outliers and a lower central mode with few, or no, very low values. The main result is that normal distributions can overestimate the mean if applied to lognormal distributions, providing an approximately 64th percentile value, as well as resulting in a much larger standard
deviation.61 In this case, the mean and standard
deviation are provided in both formats for comparison and illustration, but lognormal statistics are encouraged for glucose data. Note that for the nutrition and insulin control input interventions given, normal statistics will suffi ce, as they do not possess the same skew in this case. Finally, nonparametric values, such as the median, interquartile range, and 90% confi dence intervals, can also be used to describe data without these issues.
Glycemic control performance is also represented in this article by percentage time in glycemic bands. The bands used here match those of the earlier SPRINT studies and overlap to provide a sense of the distribution shape. The percentage time in band is calculated by measurement value weighted by the time interval between measurements, where SPRINT measured 1–2
hourly based on glycemic stability.26,59 Further results,
outcomes, and glycemic bands for all SPRINT patients
are also available in the literature.60
Graphically, data are presented in terms of empirical S-shaped cumulative distribution functions derived directly from data. These functions provide the likelihood from 0.0 to 1.0 of glycemic level or occurrence for a given data set where 0.0 is the likelihood of the lowest possible measure and 1.0 is the likelihood of the highest. If lognormal distribution data (mean, standard deviation) derived from the same data were integrated and plotted, they would fi t these empirical cumulative distribution functions.
Finally, all data are presented in both overall and per-patient bases. These metrics thus provide both overall
cohort results, as well as showing per-patient differences or variability. This overall set of summaries should provide a complete description of data.
Ethics approval to audit, collect, and present these data was obtained from the South Island Regional Ethics Committee, New Zealand.
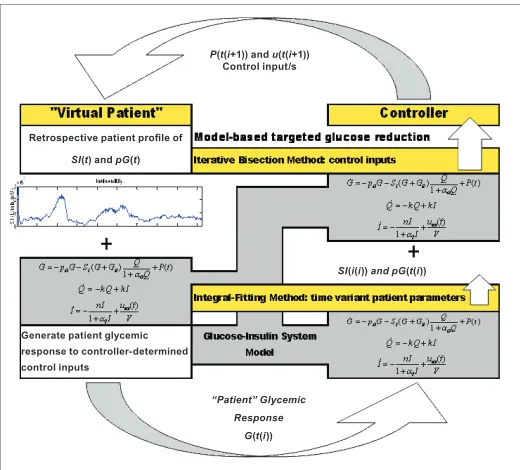
Virtual Trials and Applications
The goal of providing this data set is to encourage further research in the fi eld and enable comparisons in virtual trials to the clinical results. Virtual trials can be readily run by the following fundamental steps.
1. Fit glucose, insulin, and nutrition data to a model obtaining the model parameters as desired.
2. Resimulate the fi tted model with different insulin and/or nutritional inputs based on the control protocol designed to obtain a “virtual trial” blood glucose trajectory.
3. Compare with original data and assess performance for individual patients or the entire cohort as desired.
This broad process is outlined in Figure 1. In addition,
this fundamental process has been employed and
validated in other studies26,46–48,52 and provides a useful
means of obtaining an estimate of outcome before clinical testing.
Figure 1. Virtual trial outline as utilized in prior work26,48,57,62 showing the overall approach and elements for a virtual trial. Note that the model used does not have to be the one shown, as the fi gure is used to show only the basic steps of the approach.
P(t(i+1)) and u(t(i+1)) Control input/s
SI(i(i)) and pG(t(i))
“Patient” Glycemic Response
G(t(i)) Generate patient glycemic
response to controller-determined control inputs
Retrospective patient profi le of
[image:5.612.315.575.452.687.2]The data may also be used for model validation. Simply, model parameters may be fit to data using any number of methods to determine if a given model can capture the clinical dynamics seen. Additional validation can be obtained via testing forward prediction of blood glucose values for a given intervention in data to ensure that a given model can provide proper trend dynamics in treatment uses for a set of patient or model-specific parameters.
Results
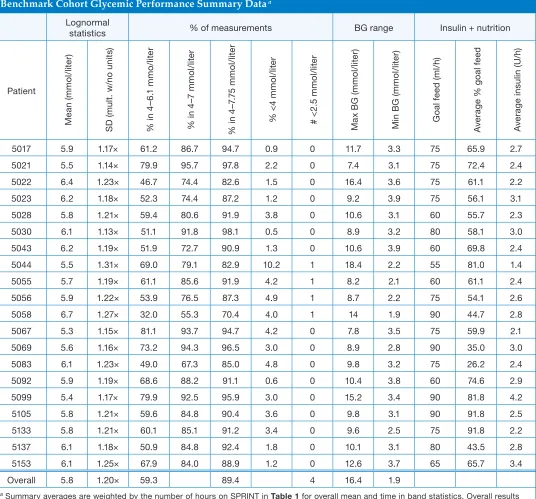
Table 3 outlines glycemic control performance for the
[image:6.612.40.576.216.715.2]benchmark cohort for individual patients and selected overall statistics. The results are provided in lognormal statistics with multiplicative (unitless) standard deviations. The overall averages reported for glycemic levels, time in band, insulin, and nutrition are weighted by the patient time for each record. The maximum and minimum
Table 3.
Benchmark Cohort Glycemic Performance Summary Data a
Lognormal
statistics % of measurements BG range Insulin + nutrition
Patient M ea n ( m m o l/ lit er ) S D ( m ul t. w /n o u ni ts ) % i n 4 –6 . m m o/ lit er % i n 4 –7 m m o l/ lit er % i n 4 –7 .7 5 m m o l/ lit er % < 4 m m o l/ lit er # < . 5 m m o l/ lit er M ax B G ( m m o l/ lit er ) M in B G ( m m o l/ lit er ) G oa l f ee d ( m l/ h) A ve ra g
e % g
oa l fe ed A ve ra g e i ns ul in ( U /h )
507 5.9 .7× 6. 86.7 94.7 0.9 0 .7 . 75 65.9 .7
50 5.5 .4× 79.9 95.7 97.8 . 0 7.4 . 75 7.4 .4
50 6.4 .× 46.7 74.4 8.6 .5 0 6.4 .6 75 6. .
50 6. .8× 5. 74.4 87. . 0 9. .9 75 56. .
508 5.8 .× 59.4 80.6 9.9 .8 0 0.6 . 60 55.7 .
500 6. .× 5. 9.8 98. 0.5 0 8.9 . 80 58. .0
504 6. .9× 5.9 7.7 90.9 . 0 0.6 .9 60 69.8 .4
5044 5.5 .× 69.0 79. 8.9 0. 8.4 . 55 8.0 .4
5055 5.7 .9× 6. 85.6 9.9 4. 8. . 60 6. .4
5056 5.9 .× 5.9 76.5 87. 4.9 8.7 . 75 54. .6
5058 6.7 .7× .0 55. 70.4 4.0 4 .9 90 44.7 .8
5067 5. .5× 8. 9.7 94.7 4. 0 7.8 .5 75 59.9 .
5069 5.6 .6× 7. 94. 96.5 .0 0 8.9 .8 90 5.0 .0
508 6. .× 49.0 67. 85.0 4.8 0 9.8 . 75 6. .4
509 5.9 .9× 68.6 88. 9. 0.6 0 0.4 .8 60 74.6 .9
5099 5.4 .7× 79.9 9.5 95.9 .0 0 5. .4 90 8.8 4.
505 5.8 .× 59.6 84.8 90.4 .6 0 9.8 . 90 9.8 .5
5 5.8 .× 60. 85. 9. .4 0 9.6 .5 75 9.8 .
57 6. .8× 50.9 84.8 9.4 .8 0 0. . 80 4.5 .8
55 6. .5× 67.9 84.0 88.9 . 0 .6 .7 65 65.7 .4
Overall 5.8 .0× 59. 89.4 4 6.4 .9
a Summary averages are weighted by the number of hours on SPRINT in Table 1 for overall mean and time in band statistics. Overall results
summary values are the overall maximum and minimum for the cohort. The goal feed is in milliliters per hour or feed rate and thus represents the maximum patient-specific rate for that individual, while the average percentage of goal feed shows the average level given.
Specific data show that the average time in band ranges from 59.3 to 89.4% as the band widens from 4.0–6.1 mmol/liter (72–110 mg/dl) to 4.0–7.75 mmol/liter (72–140 mg/dl). Note that the ranges provided by these bands match the upper/goal limits of van den Berghe
et al.2,17 and Krinsley15 where the 4.0- to 7.0-mmol/liter
(72–126 mg/dl) band is provided in between to give a better overall description of the distribution.
The overall weighted glycemic averages using appropriate lognormal statistics are 5.8 mmol/liter (105 mg/dl) with a first multiplicative standard deviation of 1.2×, yielding a 66% one standard deviation range of 4.8–7.0 mmol/liter (86–126 mg/dl). The 95% two standard deviation interval is thus ~4.0–8.4 mmol/liter (72–151 mg/dl), where the lognormal skew in data is now more evident.
Figure 2 shows the overall cumulative distribution
function for all glycemic measurements, where the x axis
tick marks are modified to show the different bands in
Table 3 and the 95% range noted previously. Matching
glucose ranges or values from Table 3 on Figure 2 reveal
the same results for time in band or 95% confidence
intervals. Hence, Figure 2 summarizes overall glycemic
data of the cohort.
Figure 3 shows same data on a per-patient basis. In this
case, each individual curve is that of a single patient. The darker dashed lines show the calculated median patient at each cumulative probability level and the related 90% confidence interval range. The interquartile range lines are not shown for clarity in this smaller cohort. As a check, it is worth noting that the 0.50 or 50th percentile value for the median patient is approximately the same 5.8-mmol/liter (105 mg/dl) value it is for the overall cohort, as expected.
Overall, Figures 2 and 3 show the relatively tight glycemic
performance. Comparing the two plots indicates that while individual patients are different, they are primarily shifted rather than crossing by large amounts. Hence, the control is similarly tight per patient versus the entire cohort, as seen in the lognormal standard deviations in
Table 3, where the average is 1.1 mmol/liter (20 mg/dl)
and only 20% (4 patients) exceed 1.2 mmol/liter (22 mg/dl) with a maximum of 1.8 mmol/liter (32 mg/dl). Thus,
the longer-staying patients in this cohort are, overall, relatively stable in their control.
Discussion
This benchmark problem cohort has been created to mimic the longer-staying general or medical ICU patient
cohort seen with SPRINT.60 These longer-staying patients
are the cohort that, in most studies, sees some of the greatest benefit from tight glycemic control in terms of mortality and other outcomes. However, this specific Figure 3. Empirical cumulative distribution functions per patient of measured blood glucose. Heavy dashed lines show the (calculated) median and 90% confidence interval “patients” at each 0.05 of cumulative probability. The nonsymmetric tick marks for blood glucose indicate the bounds for the major bands reported in Table 3 and the calculated 95% two sigma lognormal range.
BG (mmol/liter)
Cumulative Probability Distribution
Figure 2. Empirical cumulative distribution function of measured blood glucose for the entire benchmark cohort. The nonsymmetric tick marks for blood glucose indicate the bounds for the major bands reported in
Table 3 and the calculated 95% two sigma lognormal range.
Blood Glucose (mmol/liter)
medical ICU cohort may not fully reflect a less critically ill cohort, such as a cardiovascular surgery-focused cohort. Similarly, the distribution is such that it may not represent the more critically ill cohorts found in studies focused strictly on sepsis, for example.
The overall approach of using virtual trials is a data-driven approach based on real patient data. However, it is thus no better or representative than those data. In particular, it would take very large numbers, beyond that of a simple(r) benchmark problem, to show the true range or variability. Hence, this cohort has been limited in size, while still attempting to maximize its ability to represent a major segment of the SPRINT cohort and overall SPRINT cohort behavior. The overall mean, standard deviations, and 90% confidence interval spreads over this cohort are thus well matched to the 384 patient SPRINT cohort’s overall results to within 0.1–0.2 mmol/liter (1.3–3.6 mg/dl) in all overall metrics and have a similar distribution as well. Alternatively, it is possible to use emerging stochastic modeling techniques
to create equally well-correlated virtual cohorts.56,57
In terms of usefulness for designing or analyzing protocols, the virtual patient approach hinges on how well its predicted outcomes match eventual clinical results. With SPRINT, the initial Monte Carlo simulation of approximately 16,000 patient hours on a 19 patient virtual cohort was performed prior to implementing
SPRINT clinically.26 After the first approximately 16,000
clinical measurements (over ~160 patients), results of the virtual and actual trials were compared, with the resulting cumulative distribution functions shown in
Figure 4, which shows that the original simulations and
clinical raw data match very well, providing validation of the overall approach in this case. The fitted lognormal distribution to clinical data provides the same result and reinforces the need to use this distribution to represent these data.
Figure 4 also contains the SPRINT clinical percentiles
for different glycemic bands, which closely match data
in Table 3 for this limited benchmark cohort. Finally,
Figure 5 shows benchmark raw cumulative distribution
versus raw clinical data from Figure 4. The close match
of these two curves graphically indicates the level to which the benchmark cohort matches the total cohort response.
Overall, Figures 4 and 5 provide further reinforcement
for two main results. First, the overall virtual trials approach can, in this case at least, provide a good
indicator of how a protocol will perform in practice. Second, the benchmark cohort presented, while a very limited subset of all SPRINT patients, closely matches the overall glycemic performance of the larger SPRINT cohort.
Virtual trials also offer the opportunity to test other technologies or approaches. In this case, bolus insulin delivery and measurement were made using glucometers. However, given a fitted patient-specific modeling approach based on benchmark data, there is no limitation to utilize the same measurement or delivery technologies, or timing in subsequent simulation. Thus, enteral versus parenteral
feeding could be evaluated in silico in terms of glycemic
control, as could technologies such as continuous sensing or different insulin delivery approaches.
A tertiary outcome of presenting this cohort is the different approach to performance metrics. In particular, the use of cumulative distributions and/or overlapping times in glycemic bands provides a clear picture and Figure 4. Empirical versus virtual cumulative distributions for the first approximately 16,000 glucose measurements in SPRINT. The tight similarity helps validate the accuracy of the initially run virtual trials.
Blood Glucose (mmol/liter)
Cumulative Probability
Percentiles for Raw ICU data - SPRINT
< 2.5 mmol/liter = 0.004% < 3 mmol/liter = 0.1% < 4 mmol/liter = 4% 4-6.1 mmol/liter = 59% 4-7 mmol/liter = 81% 4-7.75 mmol/liter = 92%
SPRINT ICU raw data ICU data - SPRINT Model Simulation - SPRINT
Figure 5. Empirical cumulative distributions for the first approximately 16,000 glucose measurements in SPRINT and the benchmark cohort.
Blood Glucose (mmol/liter)
[image:8.612.317.576.54.219.2] [image:8.612.316.576.260.428.2]allows easy comparison across studies. The cumulative distributions can be especially useful in this regard, as time or percentage in any band can be obtained directly from the plot. These metrics thus provide clear illustration of the underlying distribution and performance that mean/median values and standard deviations cannot, particularly if the statistics used do not fully represent the distribution.
Finally, there are limitations to this approach, and there is no replacement for clinical validation. However, virtual trials can offer a great deal of insight into glycemic performance before a protocol is implemented, thus potentially reducing the development time and increasing the likelihood of success. This outcome is significant given the growing number of studies that have had
difficulty repeating the earliest results in this field.23
Limitations and Comments on Clinical Data
One potential limitation would be whether 20 patients are enough for creating a realistic virtual cohort that would provide good results. Benchmark data consist of 6372 total patient hours with 4182 blood glucose measurements. Thus, there is, on average, approximately 1 measurement every 1.5 hours or 16 per day. Averaged over the 20 patients, it results in 339.4 hours and 224.3 measurements per patient. This data set is far denser than the 19 patient and 1780 patient hour data set
used in developing SPRINT via virtual trials.26 Hence,
given the good correlation in Figure 3 with data from
SPRINT and the subset used in this benchmark cohort, it is reasonable to conclude that the data set presented has the data density and size to be suitable for effective virtual trials.
With respect to clinical data itself, there are some limitations. As noted in the data set there are periods of noncompliance to the protocol, periods where clinical imperatives have overridden the protocol. There are also periods where the protocol was stopped. All of these can have a variety of clinical causes based on patient condition at the time and the resulting clinical staff decision making.
More specifically, some patients are off SPRINT for short periods for trips to surgery or other interventions/ therapies outside the unit, including patient movement for magnetic resonance imaging scans. Longer periods off SPRINT are due, in this cohort, to the protocol-stopping criterion when the patient is stabilized. Thus, for example, patient 5105 has a 92-hour period off SPRINT. This patient also has an extended period
at maximum feed rates that is noncompliant to SPRINT, which is assumed because of specific clinical choices or reasons. Similarly, patient 5069 has five periods off SPRINT ranging from 2 to 24 hours, as this patient had several surgical interventions resulting from their admission because of trauma. These examples, and the others in the set, are typical of ICU data in general and reveal the wide range of potential difficulties and peculiarities faced by any protocol.
However, these issues do not affect data itself nor does it preclude virtual patient cohort development. All data presented include any periods of noncompliance for clinical or other reasons. Thus, the patients chosen are also broadly representative of the best and worst cases in terms of interruptions and compliance to provide a good picture of the clinical problem within data provided.
Conclusions
A benchmark data cohort was presented for glycemic control in critical care, based on clinical results from the ongoing SPRINT protocol trials in Christchurch, New Zealand. Data and its potential applications in model development, model validation, and virtual trial protocol development are provided. The overall performance is summarized using a variety of information-dense metrics that provide a full and clear picture of the overall performance achieved. Finally, this benchmark cohort presented is offered as a means of enabling comparison of model-based protocols on the same cohort, as well as providing data for model development and dynamic and predictive model validation to those research groups with less access.
References:
1. Capes SE, Hunt D, Malmberg K, Gerstein HC. Stress hyperglycaemia and increased risk of death after myocardial infarction in patients with and without diabetes: a systematic overview. Lancet. 2000;355(9206):773-8.
2. Van den Berghe G, Wouters P, Weekers F, Verwaest C, Bruyninckx F, Schetz M, Vlasselaers D, Ferdinande P, Lauwers P, Bouillon R. Intensive insulin therapy in the critically ill patients. N Engl J Med. 2001;345(19):1359-67.
4. McCowen KC, Malhotra A, Bistrian BR. Stress-induced hyperglycemia. Crit Care Clin. 2001;17(1):107-24.
5. Patino JF, de Pimiento SE, Vergara A, Savino P, Rodriguez M, Escallon J. Hypocaloric support in the critically ill. World J Surg. 1999;23(6):553-9.
6. Weissman C. Nutrition in the intensive care unit. Crit Care. 1999;3(5):R67-75.
7. Woolfson AM. Control of blood glucose during nutritional support in ill patients. Intensive Care Med. 1980;7(1):11-14.
8. Ahrens CL, Barletta JF, Kanji S, Tyburski JG, Wilson RF, Janisse JJ, Devlin JW. Effect of low-calorie parenteral nutrition on the incidence and severity of hyperglycemia in surgical patients: a randomized, controlled trial. Crit Care Med. 2005;33(11):2507-12. 9. Kim H, Son E, Kim J, Choi K, Kim C, Shin W, Suh O. Association
of hyperglycemia and markers of hepatic dysfunction with dextrose infusion rates in Korean patients receiving total parenteral nutrition. Am J Health Syst Pharm. 2003;60(17):1760-6.
10. Krishnan JA, Parce PB, Martinez A, Diette GB, Brower RG. Caloric intake in medical ICU patients: consistency of care with guidelines and relationship to clinical outcomes. Chest. 2003;124(1):297-305. 11. Bistrian BR. Hyperglycemia and infection: which is the chicken and
which is the egg? JPEN J Parenter Enteral Nutr. 2001;25(4):180-1. 12. Marik PE, Raghavan M. Stress-hyperglycemia, insulin
and immunomodulation in sepsis. Intensive Care Med. 2004;30(5):748-56.
13. Diringer MN. Improved outcome with aggressive treatment of hyperglycemia: hype or hope? Neurology. 2005;64(8):1330-1. 14. Krinsley JS. Decreased mortality of critically ill patients with the
use of an intensive glycemic management protocol. Crit Care Med. 2003;31:A19.
15. Krinsley JS. Effect of an intensive glucose management protocol on the mortality of critically ill adult patients. Mayo Clin Proc. 2004;79(8):992-1000.
16. Van den Berghe G, Wouters PJ, Bouillon R, Weekers F, Verwaest C, Schetz M, Vlasselaers D, Ferdinande P, Lauwers P. Outcome benefit of intensive insulin therapy in the critically ill: insulin dose versus glycemic control. Crit Care Med. 2003;31(2):359-66.
17. Van den Berghe G, Wilmer A, Hermans G, Meersseman W, Wouters PJ, Milants I, Van Wijngaerden E, Bobbaers H, Bouillon R. Intensive insulin therapy in the medical ICU. N Engl J Med. 2006;354(5):449-61.
18. Krinsley JS, Jones RL. Cost analysis of intensive glycemic control in critically ill adult patients. Chest. 2006;129(3):644-50.
19. Van den Berghe G, Wouters PJ, Kesteloot K, Hilleman DE. Analysis of healthcare resource utilization with intensive insulin therapy in critically ill patients. Crit Care Med. 2006;34(3):612-616.
20. Goldberg PA, Siegel MD, Sherwin RS, Halickman JI, Lee M, Bailey VA, Lee SL, Dziura JD, Inzucchi SE. Implementation of a safe and effective insulin infusion protocol in a medical intensive care unit. Diabetes Care. 2004;27(2):461-7.
21. Laver S, Preston S, Turner D, McKinstry C, Padkin A. Implementing intensive insulin therapy: development and audit of the Bath insulin protocol. Anaesth Intensive Care. 2004;32(3):311-6.
22. Thomas AN, Marchant AE, Ogden MC, Collin S. Implementation of a tight glycaemic control protocol using a web-based insulin dose calculator. Anaesthesia. 2005;60(11):1093-1100.
23. Meijering S, Corstjens AM, Tulleken JE, Meertens JH, Zijlstra JG, Ligtenberg JJ. Towards a feasible algorithm for tight glycaemic control in critically ill patients: a systematic review of the literature. Crit Care. 2006;10(1):R19.
24. Goldberg PA, Sakharova OV, Barrett PW, Falko LN, Roussel mg, Bak L, Blake-Holmes D, Marieb NJ, Inzucchi SE. Improving glycemic control in the cardiothoracic intensive care unit: clinical experience in two hospital settings. J Cardiothorac Vasc Anesth. 2004;18(6):690-697.
25. Shulman R, Finney SJ, O’Sullivan C, Glynne PA, Greene R. Tight glycaemic control: a prospective observational study of a computerised decision-supported intensive insulin therapy protocol. Criti Care. 2007;11(4):R75.
26. Lonergan T, LeCompte A, Willacy M, Chase JG, Shaw GM, Wong XW, Lotz T, Lin J, Hann CE. A simple insulin-nutrition protocol for tight glycemic control in critical illness: development and protocol comparison. Diabetes Technol Ther. 2006;8(2):191-206. 27. Wong XW, Chase JG, Shaw GM, Hann CE, Lin J, Lotz T.
Comparison of adaptive and sliding-scale glycaemic control in critical care and the impact of nutritional inputs. Proc of the 12th International Conf on Biomedical Engineering (ICBME 2005); 2005 Dec. 7-10; Singapore; 2005.
28. Chee F, Fernando T, van Heerden PV. Closed-loop control of blood glucose levels in critically ill patients. Anaesth Intensive Care. 2002;30(3):295-307.
29. Chase JG, Lonergan T, LeCompte A, Willacy M, Shaw GM, Wong XW, Lin J, Lotz T, Hann CE. Tight glucose control in critically ill patients using a specialized insulin-nutrition table. Proc of the 12th International Conf on Biomedical Engineering (ICBME 2005); 2005 Dec. 7-10; Singapore; 2005.
30. Queale WS, Seidler AJ, Brancati FL. Glycemic control and sliding scale insulin use in medical inpatients with diabetes mellitus. Arch Intern Med. 1997;157(5):545-52.
31. Kletter GG. Sliding scale fallacy. Arch Intern Med. 1998;158(13):1472.
32. Radack HB. Sliding scale insulin use. Arch Intern Med. 1997;157(15):1776.
33. Sawin CT. Action without benefit. The sliding scale of insulin use. Arch Intern Med. 1997;157(5):489.
34. Gale SC, Gracias VH. Glycemic control needs a standard reference point. Crit Care Med. 2006;34(6):1856-7.
35. Mackenzie I, Ingle S, Zaidi S, Buczaski S. Tight glycaemic control: a survey of intensive care practice in large English hospitals. Intensive Care Med. 2005;31(8):1136.
36. Schultz MJ, Spronk PE, Moeniralam HS. Tight glycaemic control: a survey of intensive care practice in the Netherlands. Intensive Care Med. 2006;32(4):618-9.
37. Chase JG, Hann CE, Shaw GM, Wong XW, Lin J, Lotz T, Le Compte AJ, Lonergan T. An overview of glycemic control in critical care: relating performance and clinical results. J Diabetes Sci Technol. 2007;1(1):82-91.
38. Egi M, Bellomo R, Stachowski E, French CJ, Hart G. Variability of blood glucose concentration and short-term mortality in critically ill patients. Anesthesiology. 2006;105(2):244-52.
39. Chase JG, Shaw GM, Lin J, Doran CV, Hann C, Lotz T, Wake GC, Broughton B. Targeted glycemic reduction in critical care using closed-loop control. Diabetes Technol Ther. 2005;7(2):274-82. 40. Chee F, Fernando TL, Savkin AV, van Heeden V. Expert PID
control system for blood glucose control in critically ill patients. IEEE Trans Inf Technol Biomed. 2003;7(4):419-25.
42. Plank J, Blaha J, Cordingley J, Wilinska ME, Chassin LJ, Morgan C, Squire S, Haluzik M, Kremen J, Svacina S, Toller W, Plasnik A, Ellmerer M, Hovorka R, Pieber TR. Multicentric, randomized, controlled trial to evaluate blood glucose control by the model predictive control algorithm versus routine glucose management protocols in intensive care unit patients. Diabetes Care. 2006;29(2):271-6.
43. Doran CV. Modelling and control of hyperglycemia in critical care patients. Masters of Engineering (ME). Christchurch, New Zealand: University of Canterbury; 2004.
44. Wong XW, Singh-Levett I, Hollingsworth LJ, Shaw GM, Hann CE, Lotz T, Lin J, Wong OS, Chase JG. A novel, model-based insulin and nutrition delivery controller for glycemic regulation in critically ill patients. Diabetes Technol Ther. 2006; 8(2):174-90. 45. Chase J, Shaw GM, Wong XW, Lotz T, Lin J, Hann CE.
Model-based glycaemic control in critical care: a review of the state of the possible. Biomed Signal Processing Control. 2006;1(1):3-21.
46. Hovorka R, Wilinska ME, Chassin LJ. In Silico simulation environment and glucose control in critically ill subjects: strategic considerations. Third European Medical & Biological Engineering Conference; 2005 Nov 20-25. Prague, Czech Republic: IFMBE; 2005. 47. Wilinska ME, Chassin LJ, Hovorka R. Automated glucose control
in the ICU: effect of nutritional protocol and measurement error. Conf Proc IEEE Eng Med Biol Soc. 2006;1:67-70.
48. Chase JG, Shaw GM, Lotz T, LeCompte A, Wong J, Lin J, Lonergan T, Willacy M, Hann CE. Model-based insulin and nutrition administration for tight glycaemic control in critical care. Curr Drug Deliv. 2007;4(4):283-96.
49. Wilinska ME, Chassin L, Hovorka R. In silico testing—impact on the progress of the closed loop insulin infusion for critically ill patients project. J Diabetes Sci Technol. 2008;2(3):417-23.
50. Hovorka R, Chassin LJ, Wilinska ME. Virtual type 1 diabetic treated by CSII: model description. WC2003: 2003 Aug 24-29; Sydney, Australia; 2003.
51. Luzio S, Dunseath G, Peter R, Pauvaday V, Owens DR. Comparison of the pharmacokinetics and pharmacodynamics of biphasic insulin aspart and insulin glargine in people with type 2 diabetes. Diabetologia. 2006;49(6):1163-8.
52. Chassin LJ, Wilinska ME, Hovorka R. Evaluation of glucose controllers in virtual environment: methodology and sample application. Artif Intell Med. 2004;32(3):171-81.
53. Lehmann ED. AIDA--A computer-based interactive educational diabetes simulator. Diabetes Educ. 1998;24(3):341-6, 348.
54. Wong J, Chase JG, Hann CE, Lotz TF, Lin J, Le Compte A, Shaw GM. Development of a clinical type 1 diabetes metabolic system model and in silico simulation tool. J Diabetes Sci Technol. 2008;2(3):425-35.
55. Wong J, Chase JG, Hann CE, Lotz TF, Lin J, Le Compte A, Shaw GM. In silico simulation of long-term type 1 diabetes glycemic control treatment outcomes. J Diabetes Sci Technol. 2008;2(3):436-49.
56. Lin J, Lee DS, Chase JG, Hann CE, Lotz T, Wong XW. Stochastic modelling of insulin sensitivity variability in critical care. Biomed Signal Processing Control. 2006;1:229-42.
57. Lin J, Lee D, Chase JG, Shaw GM, Le Compte A, Lotz T, Wong J, Lonergan T, Hann CE. Stochastic modelling of insulin sensitivity and adaptive glycemic control for critical care. Comput Methods Programs Biomed. 2008;89(2):141-52.
58. Shaw GM, Chase JG, Wong J, Lin J, Lotz T, Le Compte AJ, Lonergan TR, Willacy MB, Hann CE. Rethinking glycaemic control in critical illness--from concept to clinical practice change. Crit Care Resusc. 2006;8(2):90-9.
59. Lonergan T, Compte AL, Willacy M, Chase JG, Shaw GM, Hann CE, Lotz T, Lin J, Wong XW. A pilot study of the SPRINT protocol for tight glycemic control in critically ill patients. Diabetes Technol Ther. 2006;8(4):449-62.
60. Chase JG, Shaw G, Le Compte A, Lonergan T, Willacy M, Wong XW, Lin J, Lotz T, Lee D, Hann C. Implementation and evaluation of the SPRINT protocol for tight glycaemic control in critically ill patients: a clinical practice change. Crit Care. 2008;12(2):R49. 61. Limpert E, Stahel WA, Abbt M. Log-normal distributions across
the sciences: keys and clues. Bioscience. 2001;51(5):341-52.