http://www.scirp.org/journal/jwarp ISSN Online: 1945-3108
ISSN Print: 1945-3094
DOI: 10.4236/jwarp.2017.912086 Nov. 16, 2017 1347 Journal of Water Resource and Protection
Performance of Twelve Mass Transfer Based
Reference Evapotranspiration Models under
Humid Climate
Koffi Djaman
1*, Komlan Koudahe
2, Mamadou Sall
3, Isa Kabenge
4, Daran Rudnick
5, Suat Irmak
51Department of Plant and Environmental Sciences, New Mexico State University, Agricultural Science Center, Farmington,
USA
2ADA Consulting Africa, Lomé, Togo
3Research Scientist, Institut Senegalais de Recherches Agricoles, Centre de Saint Louis, Saint Louis, Sénégal 4Department of Agricultural and Biosystems Engineering, Makerere University, Kampala, Uganda 5Department of Biological Systems Engineering, University of Nebraska-Lincoln, Chase Hall, Lincoln, USA
Abstract
Reference evapotranspiration is very important parameter in the hydrological, agricultural and environmental studies and is accurately estimated by the FAO Penman-Monteith equation (FAO-PM) under different climatic condi-tions. However, due to data requirement of the FAO-PM equation, there is a need to investigate the applicability of alternative ETo equations under limited data. The objectives of this study were to evaluate twelve mass transfer based reference evapotranspiration equations and determine the impact of ETo eq-uation on long term water management sustainability in Tanzania and Kenya. The results showed that the Albrecht, Brockamp-Wenner, Dalto, Meyer, Rohwer and Oudin ETo equations systematically overestimated the daily ETo at all weather stations with relative errors that varied from 34% to 94% rela-tive to the FAO-PM ETo estimates. The Penman, Mahringer, Trabert, and the Romanenko equations performed best across Tanzania and the South West-ern Kenya with root mean squared errors ranging from 0.98 to 1.48 mm/day, which are relatively high and mean bias error (MBE) varying from −0.33 to 0.02 mm/day and the absolute mean error (AME) from 0.79 to 1.16 mm/day. For sustainable water management, the Trabert equation could be adopted at Songea, the Mahringer equation at Tabora, the Dalton and/or the Rohwer eq-uations at Eldoret, the Romanenko equation at Dodoma, Songea and Eldoret. However, regional calibration of the most performing equation could improve water management at regional level.
Keywords
Reference Evapotranspiration, Mass Transfer, Eastern Africa, Water
How to cite this paper: Djaman, K., Kou-dahe, K., Sall, M., Kabenge, I., Rudnick, D. and Irmak, S. (2017) Performance of Twelve Mass Transfer Based Reference Evapotranspiration Models under Humid Climate. Journal of Water Resource and Protection, 9, 1347-1363.
https://doi.org/10.4236/jwarp.2017.912086
Received: September 3, 2017 Accepted: November 13, 2017 Published: November 16, 2017
Copyright © 2017 by authors and Scientific Research Publishing Inc. This work is licensed under the Creative Commons Attribution International License (CC BY 4.0).
DOI: 10.4236/jwarp.2017.912086 1348 Journal of Water Resource and Protection Management
1. Introduction
Evapotranspiration is an important parameter for climatological and hydrologi-cal studies as well as for agricultural water resources management [1] [2]. The accuracy of reference evapotranspiration (ETo) estimates directly feeds into the decision making process for regional water resources planning and, especially under semi-arid and arid conditions. Different methods of ETo estimation have been developed ranging from direct measurements from a reference crop [3] to computation from weather data such as temperature based models [3][4], radia-tion based models [3][5], and combination-based energy balance models [6][7]. Numerous worldwide studies have shown that the FAO-56 Penman-Monteith (FAO-PM) model is the most accurate one under different climatic conditions across the world [6]-[13] and had been adopted and recommended for ETo es-timation [6] [7]. However, FAO-PM model requires maximum and minimum temperature, minimum and maximum relative humidity, solar radiation, and wind speed data to be run and these weather datasets are usually incomplete and/or not available in most developing countries. This data demand is the main constraint of use of the FAO-PM in locations where climate data is limited [14]-[17]. Therefore, the application of ETo equations with fewer meteorological parameters requirements is necessary under situations where more complete weather data are lacking. However, the evaluation of the suitability for each of the alternative ETo equations to determine the most suitable for particular loca-tions using FAO-PM model as reference is required for the East Africa Region prior to their application.
DOI: 10.4236/jwarp.2017.912086 1349 Journal of Water Resource and Protection Schendel and Mahringer equations were the promising equations that could be used for ETo estimation under the Sahelian conditions in the Senegal River Val-ley. [13] reported that Hargreaves’ method was the most accurate among five equations for estimating ETo under a semi-arid climate in Spain. Hargreaves equation was also the best model to estimate ETo in eastern arid and semiarid regions of Iran [31]. [32] indicated that the Turc equation was the best in the Western Balkans in Europe. [22] reported that Hansen and Turc equations were the most useful for ETo estimation in Greece. [33] evaluated 24 ETo equation in Greece under a Mediterranean forest environmental conditions and indicated that the adaptability of some empirical equations and the best performing ones were the Copais, original Hargreaves, and one of the Valiantzas’ equations with very high equation efficiency and agreement indexes. [34] reported that Berti ETo equation was the best alternative of the FAO Penman-Monteith ETo equa-tion under limited data condiequa-tion in China. Three mass transfer ETo equaequa-tions of Trabert, Mahringer, and Albrecht had shown good performance as they were calibrated to the local semiarid climatic conditions in the Senegal River Valley [35]. The mass transfer based Penman ETo equation performed as the best ETo equation among several equations in Malaysia [36]. Similar results were reported by [37] using data from eight weather stations across Burkina Faso for the 1998-2012 period. Different sets of equations have been tested in different re-gions and sub-rere-gions under different climatic conditions including Canada [38], Iran [28][39][40], China [41], Poland [42], Southeast Australia [43], Se-negal [2], and in Burkina Faso [44].
While the aforementioned studies have been conducted at different parts of the world, extremely limited data and information is available on this very im-portant topic in Eastern Africa, particularly in Tanzania and Kenya. Therefore, it is critical to assess the applicability of ETo models for sustainable water man-agement. Thus, the objectives of this study were to: 1) evaluate twelve mass transfer based ETo equations with comparison to the FAO-PM method, and 2) determine the impact of ETo equation on long term water management sustai-nability in Tanzania and Kenya.
2. Materials and Methods
2.1. Data Source and Type
DOI: 10.4236/jwarp.2017.912086 1350 Journal of Water Resource and Protection Table 1. Geographic coordinates of the nine weather observatories.
Country Weather station (Degree North) Latitude (Degree East) Longitude Altitude(m)
Tanzania
Dodoma −6.17 35.77 1120
Morogoro −6.83 37.65 526
Songea −10.67 36 1036
Kilimanjaro −3.43 37.07 896
Tabora −5.08 33 1182
Kenya
Nakuru −0.16 36.6 1901
Jomo Kenyatta −1.32 36.92 1624
Kisumu −0.09 34.73 1146
Eldoret 0.48 35.3 2120
northwestern highlands. The northern and eastern areas of Tanzania experience two distinct rain seasons; the short occurring during October to December and the long rains from March to May. However, the southern, western, and central parts of the country experience one wet season that continues from October through to April or May. The central plateau in Tanzania tends to be dry and arid throughout the year. Kenya’s spatial extent lies astride the equator and thus characterized by a tropical climate. Similar to Tanzania, Kenya’scoastal zone is hot and humid, has a temperate inland, very dry in the north and northeastern areas and the western area is hot and wet throughout the year [45][46]. Most of Kenya has a bimodal rainfall pattern, with the longer season occurring during March to May (MAM) and the shorter season during October to December (OND). Some areas in the western and central parts of the Kenyan Rift Valley experience a tri-modal rainfall pattern. The climate is influenced by systems such as the migration of Inter-Tropical Convergence Zone (ITCZ) from south to north and vice versa, Sub Tropical High Pressure systems (STHP), El Niño/Southern Oscillation(ENSO), Monsoon winds, tropical cyclones, the In-dian Ocean, Lake Victoria circulation and the topography [46][47][48].
2.2. Reference Evapotranspiration Models
1) Penman-Monteith model (FAO-PM)
Daily reference evapotranspiration was computed using the Penman-Monteith (FAO-PM) equation (ETo-Ref) [6]. The Penman-Monteith ETo equation with fixed stomatal resistance values for grass surface is:
(
)
(
(
)
)
(
)
(
)
0.408 2 273
ETo
1 2
Rn G Cnu T es ea
Cdu
γ γ
∆ − + + −
=
∆ + + (1)
DOI: 10.4236/jwarp.2017.912086 1351 Journal of Water Resource and Protection mean daily wind speed at 2 m height (m·s−1), es = the saturation vapor pressure at 1.5 - 2.5 m height (kPa), ea = the actual vapor pressure at 1.5 - 2.5 m height (kPa), es − ea = saturation vapor pressure deficit (kPa), γ = psychrometric con-stant (kPa·˚C−1), Cn = 900˚C·mm·s3·Mg−1·d−1, Cd = 0.34 s·m−1 for grass, γ is the psychrometric constant (kPa·˚C−1). All parameters necessary for computing ETo were computed according the procedure developed in FAO-56 by [6].
Twelve mass transfer ETo equations were selected based on their applicability to regions with similar characteristics and compared with the FAO-PM equation for their accuracy in estimating daily ETo and to determine the best performing equations at each weather station.
2) [49]
(
)(
)
ETo= 3.648 0.7223+ u es ea− (2)
3) [50]
(
)
ETo=3.075 u es−ea (3)
4) [51]
(
)(
)
ETo= 0.375 0.05026+ u es ea− (4)
5) [52]
(
)(
)
ETo= 3.3 0.891+ u es ea− (5)
6) [53]
(
)(
)
ETo=0.35 1 0.98 100+ u es ea− (6)
7) [54]
(
)(
)
ETo= 0.1005 0.297+ u es ea− (7)
8) [55]
(
) (
2)
ETo=0.0018 Ta+25 100−RH (8)
9) [56]
(
)
0.456
ETo=0.543u es−ea (9)
10) [57]
(
)(
)
ETo= 1.298 0.934+ u es ea− (10)
11) [58]
(
)
ETo=2.5 ems ea− (11)
12) [59]
(
)
ETo=0.15072∗ 3.6u∗ es−ea (12)
13) [60]
2
ETo 4.5 1 1
25
Tmean ea
es
= ∗ + ∗ −
(13)
DOI: 10.4236/jwarp.2017.912086 1352 Journal of Water Resource and Protection temperature in (˚C), RH is daily mean relative humidity in %.
2.3. ETo Method Evaluation Criteria
Comparisons were developed using graphics and simple linear regression. For further comparison, root mean squared error (RMSE), relative error (RE), mean bias error (MBE) and the absolute mean error (AME) were used to evaluate the simplified reference evapotranspiration models [61][62]:
(
)
20
RMSE in Pi Oi
n
= −
=
∑
(14)RMSE
RE 100
ETomean
= × (15)
1 1
MBE=n−
∑
n(Pi Oi− ) (16)1 1
AME=n−
∑
n Pi Oi− (17)where, Pi is the estimated ETo with the radiation based ETo models; and Oi is ETo estimated with FAO-PM model with full dataset, at the ith data point and n is the total number of data points.
3. Results and Discussion
3.1. Evaluation of the ETo Equations with Comparison to the
FAO-PM Model
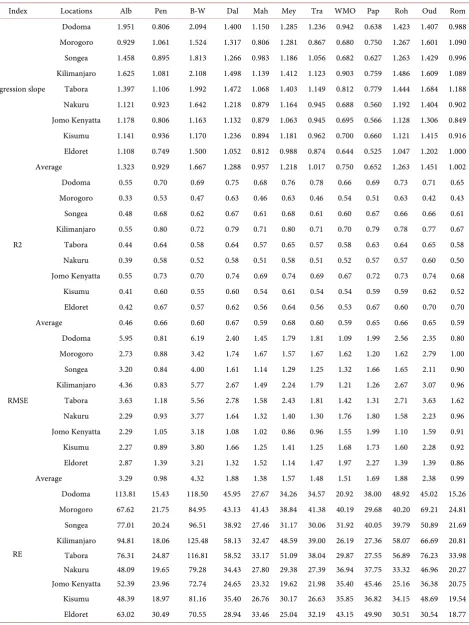
DOI: 10.4236/jwarp.2017.912086 1353 Journal of Water Resource and Protection Table 2. Comparison between the ETo estimates by different mass transfer equation with FAO-PM ETo estimates at all nine weather stations for the 1998-2012 period.
Index Locations Alb Pen B-W Dal Mah Mey Tra WMO Pap Roh Oud Rom
Regression slope
Dodoma 1.951 0.806 2.094 1.400 1.150 1.285 1.236 0.942 0.638 1.423 1.407 0.988 Morogoro 0.929 1.061 1.524 1.317 0.806 1.281 0.867 0.680 0.750 1.267 1.601 1.090 Songea 1.458 0.895 1.813 1.266 0.983 1.186 1.056 0.682 0.627 1.263 1.429 0.996 Kilimanjaro 1.625 1.081 2.108 1.498 1.139 1.412 1.123 0.903 0.759 1.486 1.609 1.089 Tabora 1.397 1.106 1.992 1.472 1.068 1.403 1.149 0.812 0.779 1.444 1.684 1.188 Nakuru 1.121 0.923 1.642 1.218 0.879 1.164 0.945 0.688 0.560 1.192 1.404 0.902 Jomo Kenyatta 1.178 0.806 1.163 1.132 0.879 1.063 0.945 0.695 0.566 1.128 1.306 0.849 Kisumu 1.141 0.936 1.170 1.236 0.894 1.181 0.962 0.700 0.660 1.121 1.415 0.916 Eldoret 1.108 0.749 1.500 1.052 0.812 0.988 0.874 0.644 0.525 1.047 1.202 1.000 Average 1.323 0.929 1.667 1.288 0.957 1.218 1.017 0.750 0.652 1.263 1.451 1.002
R2
Dodoma 0.55 0.70 0.69 0.75 0.68 0.76 0.78 0.66 0.69 0.73 0.71 0.65 Morogoro 0.33 0.53 0.47 0.63 0.46 0.63 0.46 0.54 0.51 0.63 0.42 0.43 Songea 0.48 0.68 0.62 0.67 0.61 0.68 0.61 0.60 0.67 0.66 0.66 0.61 Kilimanjaro 0.55 0.80 0.72 0.79 0.71 0.80 0.71 0.70 0.79 0.78 0.77 0.67 Tabora 0.44 0.64 0.58 0.64 0.57 0.65 0.57 0.58 0.63 0.64 0.65 0.58 Nakuru 0.39 0.58 0.52 0.58 0.51 0.58 0.51 0.52 0.57 0.57 0.60 0.50 Jomo Kenyatta 0.55 0.73 0.70 0.74 0.69 0.74 0.69 0.67 0.72 0.73 0.74 0.68 Kisumu 0.41 0.60 0.55 0.60 0.54 0.61 0.54 0.54 0.59 0.59 0.62 0.52 Eldoret 0.42 0.67 0.57 0.62 0.56 0.64 0.56 0.53 0.67 0.60 0.70 0.70 Average 0.46 0.66 0.60 0.67 0.59 0.68 0.60 0.59 0.65 0.66 0.65 0.59
RMSE
Dodoma 5.95 0.81 6.19 2.40 1.45 1.79 1.81 1.09 1.99 2.56 2.35 0.80 Morogoro 2.73 0.88 3.42 1.74 1.67 1.57 1.67 1.62 1.20 1.62 2.79 1.00 Songea 3.20 0.84 4.00 1.61 1.14 1.29 1.25 1.32 1.66 1.65 2.11 0.90 Kilimanjaro 4.36 0.83 5.77 2.67 1.49 2.24 1.79 1.21 1.26 2.67 3.07 0.96 Tabora 3.63 1.18 5.56 2.78 1.58 2.43 1.81 1.42 1.31 2.71 3.63 1.62 Nakuru 2.29 0.93 3.77 1.64 1.32 1.40 1.30 1.76 1.80 1.58 2.23 0.96 Jomo Kenyatta 2.29 1.05 3.18 1.08 1.02 0.86 0.96 1.55 1.99 1.10 1.59 0.91 Kisumu 2.27 0.89 3.80 1.66 1.25 1.41 1.25 1.68 1.73 1.60 2.28 0.92 Eldoret 2.87 1.39 3.21 1.32 1.52 1.14 1.47 1.97 2.27 1.39 1.39 0.86 Average 3.29 0.98 4.32 1.88 1.38 1.57 1.48 1.51 1.69 1.88 2.38 0.99
RE
DOI: 10.4236/jwarp.2017.912086 1354 Journal of Water Resource and Protection
Continued
Average 71.27 21.49 94.00 40.90 30.40 34.24 32.36 33.38 36.95 40.78 52.29 21.76
MBE
Dodoma 4.57 −0.47 5.47 1.98 0.64 1.40 1.08 −0.44 −1.91 2.08 2.13 -0.08 Morogoro −0.67 0.27 1.78 1.22 −0.97 1.10 −0.74 −1.40 −0.98 0.99 2.52 0.41
Songea 1.56 −0.48 3.12 0.98 −0.21 0.67 0.08 −1.03 −1.58 0.95 1.75 -0.06 Kilimanjaro 2.28 0.33 4.69 2.11 0.40 1.76 0.78 −0.65 −1.13 2.03 2.84 0.43 Tabora 1.47 0.43 4.36 2.07 0.12 1.77 0.49 −0.91 −1.10 1.92 3.18 0.80 Nakuru 0.36 −0.41 2.86 0.94 −0.68 0.70 −0.38 −1.56 −1.69 0.81 1.90 -0.48 Jomo Kenyatta 0.94 −0.90 2.51 0.47 −0.65 0.18 −0.37 −1.44 −1.93 0.43 1.31 -0.68 Kisumu 0.44 −0.34 2.94 1.01 −0.61 0.77 −0.30 −1.49 −1.63 0.88 1.97 -0.41 Eldoret 0.46 −1.23 1.95 0.06 −1.04 −0.21 −0.77 −1.77 −2.22 0.02 0.82 -0.08 Average 1.27 −0.31 3.30 1.20 −0.33 0.91 −0.02 −1.19 −1.58 1.12 2.04 −0.02
MBE
Dodoma 4.98 0.67 5.57 2.04 1.15 1.49 1.48 0.86 1.91 2.17 2.14 0.63 Morogoro 2.03 0.69 2.70 1.38 1.34 1.26 1.30 1.47 1.03 1.24 2.55 0.77 Songea 2.18 0.68 3.22 1.21 0.88 0.98 0.95 1.16 1.58 1.22 1.79 0.74 Kilimanjaro 2.91 0.63 4.76 2.18 1.10 1.83 1.30 1.02 1.15 2.11 2.85 0.74 Tabora 2.46 0.95 4.52 2.19 1.23 1.91 1.40 1.21 1.16 2.09 3.19 1.29 Nakuru 1.55 0.77 2.97 1.12 1.08 0.94 1.00 1.63 1.70 1.06 1.91 0.81 Jomo Kenyatta 1.61 0.93 2.56 0.80 0.88 0.65 0.80 1.46 1.93 0.81 1.35 0.78 Kisumu 1.52 0.72 3.03 1.15 1.02 0.96 0.95 1.56 1.63 1.08 1.97 0.76 Eldoret 1.84 1.29 2.19 0.90 1.36 0.85 1.26 1.85 2.22 0.96 0.96 0.62 Average 2.34 0.82 3.50 1.44 1.11 1.21 1.16 1.36 1.59 1.42 2.08 0.79
and 0.99 mm/day (Table 2), however, they had low corresponding magnitude of RE, MBE and AME compared to the Brockamp-Wenner, Albrecht, Dalton, Meyer, Rohwer, and Oudin equations.
DOI: 10.4236/jwarp.2017.912086 1355 Journal of Water Resource and Protection 0.03 mm/day as the Papadakis equation [30] [40]. [2] reported that the Roma-nenko equation showed better performance under dry and semiarid condition than under the humid semiarid conditions in the Senegal River Valley. Roma-nenko equation produced a 6% ETo underestimation and obtained a mean ratio of 1.0 and a regression slope of 0.92 [2]. Similarly in Iran, the Romanenko equa-tion was reported as the best mass transfer equaequa-tion [19]. The Trabert and Ma-hringer equations performed relatively well under the sahelian climatic condi-tions as reported by [2]. [19] reported that Trabert and Mahringer equations underestimated ETo with average error of 26% and 31%, respectively in Iran while [2] reported average ETo underestimation of 16% and 31% at Ndiaye (coastal area) and at Fanaye (inland area) in the Senegal River Valley and Delta, respectively. [64] reported the FAO24-Radiation method to be the best among twenty ETo equations evaluated in the sub-humid Udham Singh Nagar district of Uttarakhand (India). Adversely, poor performance of the Mahringer equation was reported in Poland [42]. [38] indicated reasonable performance of the Mey-er, Dalton, and Rohwer equation for free water evaporation estimation from four weather stations in north-western Ontario, Canada. The results of this study showed the specificity of each ETo equation and this might have been due to the sensitivity of the models to the climatic variables used in each model [30].
3.2. ETo Equation Adoption for Sustainable Water Management
across the Study Area
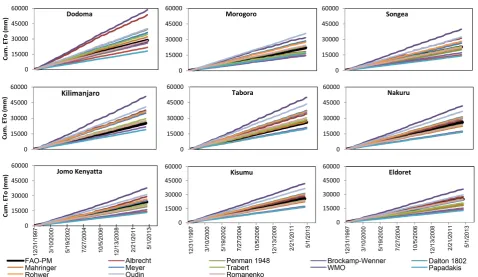
DOI: 10.4236/jwarp.2017.912086 1356 Journal of Water Resource and Protection Figure 1. Long-term cumulative daily ETo estimated from the mass transfer equations with comparison to the FAO-PM equation.
Table 3. The 1998-2012 period average total annual ETo difference between the mass transfer ETo equations and the FAO-PM equation at all nine weather stations.
Locations Alb Pen B-W Dal Mah Mey Tra WMO Pap Roh Oud Rom Dodoma 1671 −171 1997 722 233 512 394 −159 −697 759 777 −29 Morogoro −245 99 649 444 −355 403 −271 −511 −360 362 919 151 Songea 569 −176 1141 357 −78 245 31 −375 −576 346 639 −24 Kilimanjaro 833 121 1712 772 147 642 284 −236 −414 741 1037 158 Tabora 536 156 1593 755 44 647 178 −334 −404 701 1160 291 Nakuru 132 −150 1046 344 −249 255 −137 −571 −619 297 693 −174 Jomo Kenyatta 345 −327 917 171 −238 67 −136 −527 −706 159 478 −247 Kisumu 160 −125 1075 369 −222 281 −110 −546 −594 322 718 −150 Eldoret 170 −450 714 21 −379 −77 −282 −648 −812 8 298 −29
[image:10.595.59.541.408.575.2]DOI: 10.4236/jwarp.2017.912086 1357 Journal of Water Resource and Protection Songea, the Marhinger, Penman at Kilimanjaro, the Mahringer equations at Ta-bora, the Meyer equation at Jomo Kenyatta and the Rohwer, Dalton and/or Ro-mananko equations at Eldoret could be adopted at the respective locations with non-significant overestimation or underestimation of the annual ETo that could be detrimental to water resources management sustainability across Tanzania and the South Western Kenya. The least annual absolute ETo difference was 130 mm at Nakuru and 110 mm at Kisumu which represented 1300 and 1100 m3/ha. Site specific calibration of the best performing ETo equation (Trabert equation) should be performed to improve the performance of the equation under the Ki-sumu and Nakuru climate conditions. Moreover, other ETo estimation models should be investigated for accurate ETo estimation at Kisumu and Nakuru. Al-ternatively, the FAO-PM equation or the Valiantzas equation with complete data could be used in place even under limited data conditions as proposed by [44] for the study area.
In cases of ETo overestimation, estimated irrigation water requirement be-comes tremendously high and which will still increase when taking the low effi-ciency of the irrigation system into account. The Albrecht, Brockamp-Wenner, Dalton, Meyer, Rohwer and Oudin equation should be carefully investigated and adjusted through proper calibration across Tanzania and Kenya for sustainable water management since considerable discrepancies are revealed under long term water management as presented in Figure 1. At an irrigation scheme level and basin level, water losses become considerable and the implications in terms of pumping cost, labor and time requirements result in economically unviable products due to high pricing level that is unaffordable for the majority of small household farmers. In the case of ETo underestimation, there is a risk to put crops under water stress that will impact the yield and the quality of the har-vested products and environmental pollution particularly soil pollution by ni-trates [67]. The best performing ETo equation that could be adopted at a site is as the Mahringer equation at Tabora, the Trabert equation at Songea, the Rohw-er equation at Eldoret and the Romanenko ETo equation at Dodoma, Songea and Eldoret (Table 3).
4. Conclusion
Tan-DOI: 10.4236/jwarp.2017.912086 1358 Journal of Water Resource and Protection zania and the South Western Kenya however, the root mean squared errors were within the range from 0.98 to 1.48 mm/day, which are relatively high and MBE varying from −0.33 to 0.02 mm/day and the AME from 0.79 to 1.16 mm/day. For sustainable water management, The Trabert equation could be adopted at Songea, the Mahringer equation at Tabora, the Dalton and/or the Rohwer equa-tions at Eldoret, the Romanenko equation at Dodoma, Songea and Eldoret. The 15-year absolute cumulative daily ETo differences compared to the FAO-PM ETo estimates were only 99 mm with the Penman equation at Morogogo, 21 mm with the Dalton equation at Eldoret, 44 mm with the Mahringer equation at Ta-bora, 67 mm with the Meyer equation at Jomo Kenyatta, 31 mm with the Travert equation at Songea, 8 mm with the Rohwer equation at Eldoret, and 29, 24 and 20 mm with the Romanenko equation at Dodoma, Songea and Eldoret, respec-tively. However, regional or sub-regional calibration of the best performing Penman, Mahringer, Trabert and the Romanenko equation could improve water management in Tanzania and Kenya under the conservative and sustainable agriculture. This study provides a pragmatic solution for the region that can be used as a guide to choose which method(s) would be a reasonable alternative to estimate ETo when all climatic data are not available at particular locations. However, other reference evapotranspiration equations including the radiation based and the combination equations should tested to determine the best alter-native ETo equation to the Penman-Monteith equation for sustainable water management in Tanzania and Kenya. Given the current status of weather station networks in the region, the results of this study can enhance crop water use es-timation and thus feeds into the decision making process for regional water re-sources planning by irrigators, water managers and other agricultural profes-sionals.
References
[1] Allen, R.G., Pereira, L.S., Howell, T.A. and Jensen, M.E. (2011) Evapotranspiration Information Reporting: II. Recommended Documentation. Agricultural Water Management, 98, 921-929. https://doi.org/10.1016/j.agwat.2010.12.016
[2] Djaman, K., Balde, A.B., Sow, A., Muller, B., Irmak, S., Ndiaye, M.K., Manneh, B., Moukoumbi, Y.D., Futakuchi, K. and Saito, K. (2015) Evaluation of Sixteen Refer-ence Evapotranspiration Methods under Sahelian Conditions in the Senegal River Valley. Journal of Hydrology: Regional Studies, 3, 139-159.
[3] Doorenbos, J. and Pruitt, W.O. (1977) Guidelines for Predicting Crop Water Re-quirements. FAO Irrigation and Drainage Paper 24, FAO, Rome.
[4] Thornthwaite, C.W. (1948) An Approach towards a Rational Classification of Cli-mate. Geographical Review, 38, 55-94.https://doi.org/10.2307/210739
[5] Hargreaves, G.H. and Samani, Z.A. (1985) Reference Crop Evapotranspiration from Temperature. Applied Engineering in Agriculture, 1, 96-99.
https://doi.org/10.13031/2013.26773
DOI: 10.4236/jwarp.2017.912086 1359 Journal of Water Resource and Protection
[7] ASCE-EWRI (2005) The ASCE Standardized Reference Evapotranspiration Equa-tion. In: Allen, R.G., Walter, I.A., Elliot, R.L., et al., Eds., Standardization of Refer-ence Evapotranspiration Task Committee Final Report, Environmental and Water Resources Institute (EWRI) of the American Society of Civil Engineers, American Society of Civil Engineers (ASCE), Reston, 213 p.
[8] Irmak, S., Irmak, A., Allen, R.G. and Jones, J.W. (2003) Solar and Net Radia-tion-Based Equations to Estimate Reference Evapotranspiration in Humid Climates.
Journal of Irrigation and Drainage Engineering, 129, 336-347.
https://doi.org/10.1061/(ASCE)0733-9437(2003)129:5(336)
[9] Hargreaves, G.H. and Allen, R.G. (2003) History and Evaluation of Hargreaves Evapotranspiration Equation. Journal of Irrigation and Drainage Engineering, 129, 53-63. https://doi.org/10.1061/(ASCE)0733-9437(2003)129:1(53)
[10] Mendonça, J.C., Sousa, E.F., de Bernardo, S., Dias, G.P. and Grippa, S. (2003) Comparison of Estimation Methods of Reference Crop Evapotranspiration (ETo) for Northeren Region of Rio de Janeiro State, Brazil. Revista Brasileira de Engenha-ria Agrícola e Ambiental,7, 275-279.
https://doi.org/10.1590/S1415-43662003000200015
[11] Garcia, M., Raes, D., Allen, R. and Herbas, C. (2004) Dynamics of Reference Evapo-transpiration in the Bolivian Highlands (Altiplano). Agricultural Forest and Mete-orology, 125, 67-82.https://doi.org/10.1016/j.agrformet.2004.03.005
[12] Utset, A., Farre, I., Martinez-Cob, A. and Cavero, J. (2004) Comparing Pen-man-Monteith and Priestley-Taylor Approaches as Reference Evapotranspiration Inputs for Modeling Maize Water Use under Mediterranean Conditions. Agricul-tural Water Management,66, 205-219.https://doi.org/10.1016/j.agwat.2003.12.003
[13] López-Urrea, R., Martín de Santa Olalla, F., Fabeiro, C. and Moratalla, A. (2006) Testing Evapotranspiration Equations Using Lysimeter Observations in a Semiarid Climate. Agricultural Water Management, 85, 15-26.
https://doi.org/10.1016/j.agwat.2006.03.014
[14] Stockle, C.O., Kjelgaard, J. and Bellocchi, G. (2004) Evaluation of Estimated Weather Data for Calculating Penman-Monteith Reference Crop Evapotranspira-tion. Irrigation Science,23, 39-46.https://doi.org/10.1007/s00271-004-0091-0
[15] Todorovic, M., Karic, B. and Pereira, L.S. (2013) Reference Evapotranspiration Es-timate with Limited Weather Data across a Range of Mediterranean Climates.
Journal of Hydrology, 481, 166-176. https://doi.org/10.1016/j.jhydrol.2012.12.034
[16] Li, Z., Zheng, F.L and Liu, W.Z. (2012) Spatiotemporal Characteristics of Reference Evapotranspiration during 1961-2009 and Its Projected Changes during 2011-2099 on the Loess Plateau of China. Agricultural and Forest Meteorology, 154-155, 147-155.https://doi.org/10.1016/j.agrformet.2011.10.019
[17] Rahimikhoob, A., Behbahani, M.R. and Fakheri, J. (2012) An Evaluation of Four Reference Evapotranspiration Models in a Subtropical Climate. Water Resources Management, 26, 2867-2881. https://doi.org/10.1007/s11269-012-0054-9
[18] Martinez, C.J. and Thepadia, M. (2010) Estimating Reference Evapotranspiration with Minimum Data in Florida, USA. Journal of Irrigation and Drainage Engineer-ing, 136, 494-501. https://doi.org/10.1061/(ASCE)IR.1943-4774.0000214
[19] Tabari, H., Grismer, M. and Trajkovic, S. (2011a) Comparative Analysis of 31 Ref-erence Evapotranspiration Methods under Humid Conditions. Irrigation Science, 31, 107-117. https://doi.org/10.1007/s00271-011-0295-z
Agri-DOI: 10.4236/jwarp.2017.912086 1360 Journal of Water Resource and Protection
culture, Beltsville.
[21] Snyder, R.L. (1992) Equation for Evaporation Pan to Evapotranspiration Conver-sions. Journal of Irrigation and Drainage Engineering, 118, 977-980.
https://doi.org/10.1061/(ASCE)0733-9437(1992)118:6(977)
[22] Xystrakis, F. and Matzarakis, A. (2011) Evaluation of 13 Empirical Reference Poten-tial Evapotranspiration Equations on the Island of Crete in Southern Greece. Jour-nal of Irrigation and Drainage Engineering,137, 211-222.
https://doi.org/10.1061/(ASCE)IR.1943-4774.0000283
[23] Valiantzas, J.D. (2013a) Simplified Forms for the Standardized FAO-56 Pen-man-Monteith Reference Evapotranspiration Using Limited Data. Journal of Hy-drology, 505, 13-23.https://doi.org/10.1016/j.jhydrol.2013.09.005
[24] Valiantzas, J.D. (2013b) Simplified Reference Evapotranspiration Formula Using an Empirical Impact Factor for Penman’s Aerodynamic Term. Journal of Irrigation and Drainage Engineering, 18, 108-114.
https://doi.org/10.1061/(ASCE)HE.1943-5584.0000590
[25] Droogers, P. and Allen, R.G. (2002) Estimating Reference Evapotranspiration under Inaccurate Data Conditions. Irrigation Drainage System, 16, 33-45.
https://doi.org/10.1023/A:1015508322413
[26] Yoder, R.E., Odhiambo, L.O. and Wright, W.C. (2005) Evaluation of Methods for Estimating Daily Reference Crop Evapotranspiration at a Site in the Humid South-east United States. Applied Engineering in Agriculture, 21, 197-202.
https://doi.org/10.13031/2013.18153
[27] Xing, Z., Chow, L., Meng, F., Rees, H.W., Monteith, J. and Lionel, S. (2008) Testing Reference Evapotranspiration Estimation Methods Using Evaporation Pan and Modeling in Maritime Region of Canada. Journal of Irrigation and Drainage Engi-neering, 134, 417-424.https://doi.org/10.1061/(ASCE)0733-9437(2008)134:4(417)
[28] Tabari, H. and Hosseinzadeh-Talaee, P. (2011b) Temporal Variability of Precipita-tion over Iran: 1966-2005. Journal of Hydrology, 396, 313-320.
https://doi.org/10.1016/j.jhydrol.2010.11.034
[29] Liou, Y.-A. and Kar, S.K. (2014) Evapotranspiration Estimation with Remote Sens-ing and Various Surface Energy Balance Algorithms. A Review. Energies, 7, 2821-2849.
https://doi.org/10.3390/en7052821
[30] Valipour, M. (2014) Investigation of Valiantzas’ Evapotranspiration Equation in Iran. Theoretical and Applied Climatology,121, 1-2.
[31] Sabziparvar, A.A. and Tabari H. (2010) Regional Estimation of Reference Evapo-transpiration in Arid and Semi-Arid Regions. Journal of Irrigation and Drainage Engineering, 136, 724-731.https://doi.org/10.1061/(ASCE)IR.1943-4774.0000242
[32] Trajkovic, S. and Kolakovic, S. (2009) Evaluation of Reference Evapotranspiration Equations under Humid Conditions. Water Resource Management, 23, 3057-3067.
https://doi.org/10.1007/s11269-009-9423-4
[33] Bourletsikas, A., Argyrokastritis, I. and Proutsos, N. (2017) Comparative Evaluation of 24 Reference Evapotranspiration Equations Applied on an Evergreen-Broadleaved Forest. Hydrology Research, Online.
[34] Peng, L., Yi, L. and Hao, F. (2017) The Best Alternative for Estimating Reference Crop Evapotranspiration in Different Sub-Regions of Mainland China. Scientific Reports, 7, 5458. https://doi.org/10.1038/s41598-017-05660-y
DOI: 10.4236/jwarp.2017.912086 1361 Journal of Water Resource and Protection
reference Evapotranspiration in the Senegal River Delta. Journal of Hydrology: Re-gional Studies, 8, 82-94. https://doi.org/10.1016/j.ejrh.2016.06.003
[36] Muniandy, J., Zulkifli, Y. and Muhamad, A. (2016) Evaluation of Reference Evapo-transpiration Models and Determination of Crop Coefficient for Momordica cha-rantia and Capsicum annuum. Agricultural Water Management, 169, 77-89.
https://doi.org/10.1016/j.agwat.2016.02.019
[37] Ndiaye, P.M., Bodian, A., Diop, L. and Djaman, K. (2017) Evaluation de vingt méthodes d’estimation de l’évapotranspiration journalière de référence au Burkina Faso. [Evaluation of Twenty Daily Reference Evapotranspiration Methods in Bur-kina Faso.] Physio-Geo, 11-1, 129-146.
https://doi.org/10.4000/physio-geo.5369
[38] Singh, V.P. and Xu, C.Y. (1997) Evaluation and Generalization of 13 Mass Transfer Equations for Determining Free Water Evaporation. Hydrological Processes, 11, 311-323.
https://doi.org/10.1002/(SICI)1099-1085(19970315)11:3<311::AID-HYP446>3.0.CO ;2-Y
[39] Heydari, M.M. and Heydari, M. (2014) Evaluation of Pan Coefficient Equations for Estimating Reference Crop Evapotranspiration in the Arid Region. Archives of Agronomy and Soil Science, 60, 715-731.
https://doi.org/10.1080/03650340.2013.830286
[40] Valipour, M. (2015) Importance of Solar Radiation, Temperature, Relative Humid-ity, and Wind Speed for Calculation of Reference. Archives of Agronomy and Soil Science,6, 239-255.
[41] Zhai, L., Feng, Q., Li, Q. and Xu, C. (2010) Comparison and Modification of Equa-tions for Calculating Evapotranspiration (ET) with Data from Gansu Province, Northwest China. Irrigation and Drainage, 59, 477-490.
https://doi.org/10.1002/ird.502
[42] Bogawski, P. and Bednorz, E. (2014) Comparison and Validation of Selected Eva-potranspiration Models for Conditions in Poland (Central Europe). Water Re-sources Management, 28, 5021-5038.https://doi.org/10.1007/s11269-014-0787-8
[43] Azhar, A.H. and Perera, B.J.C. (2011) Evaluation of Reference Evapotranspiration Estimation Methods under Southeast Australian Conditions. Journal of Irrigation and Drainage Engineering,137, 268-279.
https://doi.org/10.1061/(ASCE)IR.1943-4774.0000297
[44] Djaman, K., Irmak, S., Kabenge, I. and Futakuchi, K. (2016) Evaluation of the FAO-56 Penman-Monteith Model with Limited Data and the Valiantzas Models for Estimating Reference Evapotranspiration in the Sahelian Conditions. Journal of Ir-rigation and Drainage Engineering, 142, Article ID: 04016044.
https://doi.org/10.1061/(ASCE)IR.1943-4774.0001070
[45] McSweeney, C., New, M. and Lizcano, G. (2010a) UNDP Climate Change Country Profiles: Kenya. https://digital.library.unt.edu/ark:/67531/metadc226624/
[46] McSweeney, C., New, M., Lizcano, G. and Lu, X. (2010b) The UNDP Climate Change Country Profiles Improving the Accessibility of Observed and Projected Climate Information for Studies of Climate Change in Developing Countries. Bulle-tin of the American Meteorological Society, 91, 157-166.
https://doi.org/10.1175/2009BAMS2826.1
DOI: 10.4236/jwarp.2017.912086 1362 Journal of Water Resource and Protection
Profiles: Tanzania.
http://www.geog.ox.ac.uk/research/climate/projects/undp-cp/UNDP_reports/Tanza nia/Tanzania.lowres.report.pdf
[49] Dalton, J. (1802) Experimental Essays on the Constitution of Mixed Gases: On the Force of Steam or Vapour from Water or Other Liquids in Different Temperatures, Both in a Torricelli Vacuum and in Air; on Evaporation; and on Expansion of Gases by Heat. Memoirs of the Literary and Philosophical Society of Manchester, 5, 536-602.
[50] Trabert, W. (1896) Neue Beobachtungenûber Verdampfungsgeschwindigkeiten. [New Observations on Evaporation Rates.] Meteorologische Zeitschrift, 13, 261-263 [51] Meyer, A. (1926) Uber einige Zusammenha ngezwischen Klima und Boden in Eu-ropa. [Some Interrelations between Climate and Soil in Europe.] Chemie der Erde, 2, 209-347.
[52] Rohwer, C. (1931) Evaporation from Free Water Surfaces. Technical Bulletin 271, US Department of Agriculture, Washington DC.
[53] Penman, H.L. (1948) Natural Evaporation from Open Water, Bare Soil and Grass.
Proceedings of the Royal Society of London, 193, 120-145.
https://doi.org/10.1098/rspa.1948.0037
[54] Albrecht, F. (1950) Die Methodenzur Bestimmung der Verdunstungdernaturlichen Erdoberflache. [Evaporation Estimation Methods for Natural Earth’s Surface.] Arch Meteor Geoph. BioklSer, B,2,1-38.
[55] Romanenko, V.A. (1961) `Computation of the Autumn Soil Moisture Using a Uni-versal Relationship for a Large Area. Ukrainian Hydrometeorological Research In-stitute, Kiev, No. 3.
[56] Brockamp, B. and Wenner, H. (1963) Verdunstungsmessungen auf den Steiner See bei Munster. [Evaporation Measurements on the Steiner Lake at Munster.]
Deutsche gewässerkundliche Mitteilungen,7, 149-154.
[57] World Meteorological Organization (WMO) (1966) Measurement and Estimation of Evaporation and Evapotranspiration. Tech Pap (CIMO-Rep) 83, WMO, Genf. [58] Papadakis, J. (1966) Climates of the World and Their Agricultural Potentialities.
Eigenverl. d. Verf., Buenos Aires.
[59] Mahringer, W. (1970) Verdunstungsstudien am Neusiedler See. [Evaporation Stu-dies at Lake Neusiedl.] Arch Met GeophBioklSer, B, 18, 1-20.
[60] Oudin, L., Hervieu, F., Michel, C., Perrin, C., Andreassian, V., Anctil, F. and Lou-magne, C. (2005) Which Potential Evapotranspiration in Put for a Lumped Rain-fall-Runoff Model? Part 2—Towards a Simple and Efficient Potential Evapotranspi-ration Model for Rainfall-Runoff Modelling. Journal of Hydrology, 303, 290-306.
https://doi.org/10.1016/j.jhydrol.2004.08.026
[61] Makridakis, S., Wheelwright, S.C. and Megee, V.E. (1986) Forecasting: Methods and Application. 2nd Edition, Wiley, New York.
[62] Helsel, D.R. and Hirsch, R.M. (1991) Statistical Methods in Water Resources. Book 4, US Geological Survey, 522 p.
[63] Winter, T.C., Rosenberry, D.O. and Sturrock, A.M. (1995) Evaluation of 11 Equa-tions for Determining Evaporation for a Small Lake in the North Central United States. Water Resources Research, 31, 983-993.
https://doi.org/10.1029/94WR02537
DOI: 10.4236/jwarp.2017.912086 1363 Journal of Water Resource and Protection Agricultural Research,10, 65-73.https://doi.org/10.3923/ijar.2015.65.73
[65] Irmak, S. and Mutiibwa, D. (2010) On the Dynamics of Canopy Resistance: Genera-lized-Linear Estimation and Relationships with Primary Micrometeorological Va-riables. Water Resources Research,46, 1-20, W08526.
[66] Djaman, K. and Irmak, S. (2013) Actual Crop Evapotranspiration and Alfalfa- and Grass-Reference Crop Coefficients of Maize under Full and Limited Irrigation and Rainfed Conditions.Journal of Irrigation and Drainage Engineering, 139, 433-446.
https://doi.org/10.1061/(ASCE)IR.1943-4774.0000559