Study on Correlation of Angstrom Turbidity Coefficient (β)
with Aerosol Optical Depth (τ) over a Period of Two Years
(2004-2006) for the Special Mangrove Ecosystem of
Sundarbans
Indranil Mukherjee1*, Niladri Chakraborty2
1Department of Civil Engineering, Hooghly Engineering & Technology College, Hooghly, India 2Department of Power Engineering, Jadavpur University (Salt Lake Campus), Kolkata, India
Email: *[email protected], [email protected]
Received July 10, 2012; revised August 28, 2012; accepted September 15, 2012
ABSTRACT
A study on the correlation of the angstrom turbidity coefficient (β) with aerosol optical depth (τ) have been studied on
the basis of field measurements carried out at Kaikhali (22.022˚N & 88.614˚E) lying in the east coast of India inside the Sundarbans. The angstrom turbidity coefficients have been calculated with respect to the filter channels at 340 nm, 500 nm, 870 nm, 936 nm and 1020 nm of a Sunphotometer. Assessment of the possible influx of the fine particulate con- centrations to the total aerosol loading in the area have been made with respect to the calculated angstrom turbidity va- lues for the summer and winter seasons over a period of two years from 2004 to 2006. Substantially high angstrom tur- bidity coefficient values exceeding 0.2 and indicative of a relatively hazy atmosphere for both the summer and winter periods over these two years from 2004-2006 have been observed. Considering the importance of this fragile man- grove ecosystem of the Sundarbans and also the vulnerability of the area to severe impacts of climate changes, this is indeed a thought provoking issue as far as the policy makers of the country are concerned. In fact, the study has con-firmed positive correlation of β with τ.
Keywords: Angstrom Turbidity Coefficient (β); Aerosol Optical Depth (τ); PM10; PM2.5; Biodiversity
1. Introduction
Lying to the south of West Bengal, India, the Sundarbans coastal belt truly represents a complex and unique eco- system encompassing tiger inhabited terrain of mangrove forest and saltwater swamp as part of the lower Gangetic delta. The vast richness in the biodiversity of the area is quite clearly reflected in the wide variety of species pre- valent in the area and also variation in the species com- position. As a matter of fact UNESCO has truly given recognition to the core area inhabited by these Royal Bengal tigers as an World Heritage Site as early as in 1987 [1] and also as a Biosphere Reserve under UNE- SCO’s Man and Environment programme in the year
2001.The importance of the Sundarbans is well empha-
sized by the fact that the Sundarban forests also buffer
Kolkata (lying about 100 kms from the Sundarbans) from the cyclones generating from the Bay of Bengal [2] which otherwise could have been highly detrimental for the metropolis Kolkata. However the dearth of proper
conventional sources of energy in the Sundarbans is a major factor responsible for a host of incomplete com- bustion activities being practiced in the area. Moreover, there has been a considerable rise in population over the last decade coupled with a host of unplanned economic activities in the area. All of these, particularly the consi- derable amount of incomplete combustion activities pre- vailing in the area which give birth to pollutants are bound to affect the rich biodiversity of the area. The pollutants under consideration fall under the classifica- tion of the well defined criteria air pollutants as desig- nated by the United States Environmental Protection Agency (USEPA) [3]. Among these criteria air pollu- tants, considering the adverseness posed by the finer fra- ction of the particulates, concentration have been provi-
ded on these finer fractions of particulates (PM10 and
PM2.5). The undesirable effects of the particulates on
areas rich in biodiversity as well as on health have been confirmed from the outcomes of various researches car- ried out by different research groups globally. In this context studies carried out by researchers and scientists [4-22] may be considered interesting and thought provo-
king. The concentration of the high finer fractions in the area contribute substantially to the overall aerosol loa- ding of the area. In fact, aerosols interact with both the incoming solar shortwave (SW) and the outgoing terre- strial longwave (LW) radiations as they either scatter or absorb or both scatter and absorb short and longwave radiation. This results in exertion of a more complex
effect on climate [23](Charlson et al. 1999).Studies car-
ried out by different research groups and scientists,
[24-30]have established the adverse effects of aerosol on
areas of rich and unique biodiversity [31]. Considering the adverse implication of the aerosols on the surroun- ding environment, it has become even more so important to assess the aerosol loadings in order to understand their adverse impact on an area of rich and unique biodiversity
such as Sundarbans.As a measure to describe the extent
of aerosol loading,reports on the Aerosol Optical Depth
(AOD) measured at the site for the five filter channels (340 nm, 500 nm, 870 nm, 936 nm and 1020 nm respec- tively) during the winter and summer periods over the years from 2004-2006 have been made. To ascertain the
presence of high levels of fine particulate matter (PM2.5
and PM10) in the area, the aerosol optical depth (τ) values
for the above mentioned wavelengths have been corre- lated with the corresponding angstrom turbidity coeffi-
cient (β) values. This has got importance from many ang-
les, mostly to reflect the high occurrence and its asso- ciated effects of the fine particulate fractions on the bio- diversity and surrounding environment of the Sundar- bans.
2. Location and Measurements
Angstrom Turbidity Coefficient
Angstrom turbidity coefficient (β) is a measure of the
degree of haziness in the atmosphere. The degree of ha-
ziness undoubtedly depends on the absorption and sca- ttering of the light rays by the aerosols present in the atmosphere. As a matter of fact, smaller the size of the particulate fractions greater is its ability to scatter or ab- sorb the light rays. This implies that with decrease in the size of the particulate fractions, the angstrom turbidity coefficient value increases, thereby implying a corres- ponding increase in the haze problem. Haze is a very im- portant problem related to particularly reduction in at- mospheric visibility and also obstruction to free passage to sunlight. The latter effect is of particular concern to areas such as our sampling site, where cultivation is the primary mode of living.
3. Sampling Site Details
Out of the 54 inhabited islands that constitute Sundar- ban, one of them is Kaikhali, where the measurements
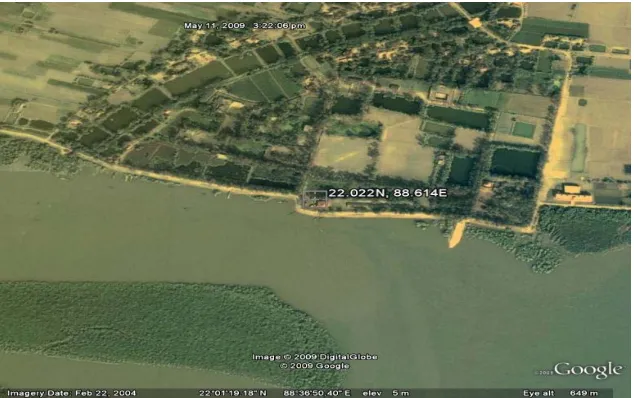
were carried out. The sampling site at Kaikhali (22.022˚N
and 88.614˚E) (refer Figure 1) in Sundarban is at an
[image:2.595.140.457.521.720.2]aerial distance of approximately 100 km from the nearest metropolis Kolkata and lies at the southernmost tip of Indo-Gangetic flow. The site lies at land and sea inter- face (hence can be also termed as a transboundary area), at the convergence of river Nabipukur with river Matla which eventually drains into the Bay of Bengal. In addi- tion to this, Bay of Bengal also provides the unique op- portunity of mixing of marine and sub-continental air masses. One of the basic reasons for choosing this samp- ling site was that it represents an open area with no obs- truction, thereby offering free passage to wind move- ment and also to dispersion of air pollutants. At the same time, it is under the strong influence of land and sea bre- ezes, which invariably result in the temperature fluc- tuations in the area.
4. Measurement Methodology
The PM10 was monitored using the Respirable Dust Sam-
pler (Respirable Dust Sampler, Model APM 460 by En-
virotech Pvt. Ltd., India)[32]. During sampling, the flow
rate was maintained between (0.9 - 1.2) m3/min as men-
tioned in the Measurement of Criteria Pollutants in Am- bient Air, Laboratory Analytical Techniques Series, 1990- 1991, Central Pollution Control Board Guidelines [33]. The flow rate was measured at site with the help of a pre- calibrated orificemeter which is attached to the ins- trument. The orificemeter was calibrated by varying the discharge through it and measuring the corresponding pressure drop across the orificemeter. The basic mecha- nism of this Respirable Dust Sampler is based on the pri- nciple of cyclone separator (centrifugal action). The RPM
(PM10) were retained in the EPM 2000 Glass Mic-
rofibre and in the Quartz (QMA) filter papers made by
Whatman Asia Pacific Pte Ltd. and the PM10 concentra-
tion was determined gravimetrically. PM2.5 was monito-
red with the help of Fine Particulate Sampler (Fine Par- ticulate Sampler, Model APM 550 by Envirotech Pvt. Ltd., India) [34]. The FRPM basically comprises of the particulate fractions having aerodynamic diameter less than equals to 2.5 microns. The APM 550 Fine Particu- late Sampler employs a set of impactors standardized and documented by United States Environmental Protection Agency (USEPA) to separate the coarse particulates and retain the finer fractions from the air stream. The system consists of a unidirectional air inlet, impactor for par-
ticles larger than 10 microns and a PM2.5 impactor se-
parated by a length of tube. To ensure that the air entry is unaffected by the wind direction, the air inlet is pro- vided with a circular symmetry and is also designed in such a way so as to keep out rain, insects and very large particles. The inlet section immediately leads to an im- pactor stage designed to retain particles with an aero- dynamic diameter larger than 10 microns. Thus the air stream passing in the down tube comprises only of me- dium and fine particulates having aerodynamic diameter less than 10 microns. The streamlined air flow of the down tube is enhanced through the nozzle of the well shaped (WINS) impactor. The WINS impactor is design- ed to trap medium size particulates with an aerodynamic diameter between 2.5 and 10 microns and thereby al- lowing the particulate fractions less than 2.5 microns to pass through. These fine particulates are retained on a special Teflon (PTFE) membrane filter of 47 mm dia- meter. The impactor system of the instrument has been
designed to operate at an air flow rate of 1 m3hr−1 or
16.7 ltmin−1. The mass concentration of the PM
2.5 frac-
tions in the ambient air is calculated as the total mass of particles collected in the Teflon (PTFE) filter paper divided by the volume of air sampled and is expressed in
microgram per cubic meter (μgm−3) as recorded in the
dry gas meter. Aerosol optical depth was measured using a hand held Microtops-II Sunphotometer (Solar Light Co., USA) [35] at the recommended wavelengths of 340 nm, 500 nm, 870 nm, 936 nm and 1020 nm respectively by the World Meteorological Organization respectively. All the measurements employing the sunphotometer and processing the data was carried out in accordance to a standard protocol [36]. The sunphotometer used for the measurement purpose was calibrated both at factory and on land. The long-term stability of the instrument was found to be appreciably good and the degradation of the filter or the drifts in the calibration values were found to be marginal. On land calibrations were carried out with measurements at a high mountain (Tiger Hill, 2555 Mt altitude) in Darjeeling, West Bengal, India above mean sea level using the standard Langley-Bouger technique as per the protocol given for the validation of ocean color satellite [37]. Factory calibrations were carried out in the year 2002. The calibration constants obtained from the data collected at Darjeeling did not show any large varia- tions from the values obtained from the calibrations at factory. In addition, the meteorological parameters (wind velocity and temperature) were also recorded at the sampling site simultaneously for the proper interpretation of the data gathered.
5. Results and Discussions
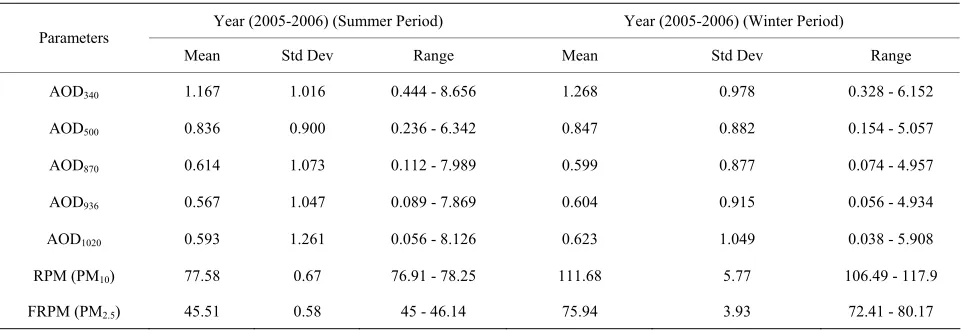
Data on measurement of the finer fraction of the parti- culates and aerosol optical depths for the five filter chan-
nels have been reported for the summer in Table 1 and
for winter in Table 2.
The angstrom turbidity coefficient has been calculated employing the following equation
(www.sti.nasa.gov/Pubs/star/star0809.pdf).
where, β = angstom turbidity coefficient,
τ = aerosol optical depth for the respective filter chan-
nel under observation,
λ = wavelength of the respective filter channel in mi-
crons,
α = corresponding angstrom exponent value [24] (Muk-
herjee et al., 2011).
The values of the angstrom turbidity coefficients have
been reported in Tables3 and 4 respectively. The mete-
orological parameters measured during the period 2004 -
2006 have been reported in Table 5.
From Tables1 and 2 it is observed that the upper ran-
ge of the fine particulate concentrations are substantially high enough to have serious implication on the biodiver-
sity of the Sundarbans. The ranges of PM10 concentration
for the periods (2004-2005) and (2005-2006) are (103.86 - 115.01) µgm−3 and (106.49 - 117.9) µgm−3
Table 1. Statistics of parameters for the year 2004-2005.
Year (2004-2005) (Summer Period) Year (2004-2005) (Winter Period) Parameters
Mean Std Dev Range Mean Std Dev Range
AOD340 1.178 1.133 0.448 - 8.488 1.517 0.81 0.99 - 5.27
AOD500 0.902 1.194 0.264 - 8.583 1.063 0.26 0.79 - 2.71
AOD870 0.591 1.038 0.124 - 8.101 0.530 0.20 0.38 - 2.03
AOD936 0.561 1.046 0.098 - 8.113 0.467 0.19 0.32 - 1.96
AOD1020 0.597 1.281 0.065 - 8.901 0.404 0.18 0.26 - 1.89
RPM (PM10) 76.75 0.17 76.57 - 76.9 108.53 5.79 103.86 - 115.01
FRPM (PM2.5) 46.05 0.10 45.94 - 46.14 71.63 3.82 68.55 - 75.91
[image:4.595.58.539.294.459.2]Note: All concentrations and range of fine particulate fractions are in µgm−3.
Table 2. Statistics of parameters for the year 2005-2006.
Year (2005-2006) (Summer Period) Year (2005-2006) (Winter Period) Parameters
Mean Std Dev Range Mean Std Dev Range
AOD340 1.167 1.016 0.444 - 8.656 1.268 0.978 0.328 - 6.152
AOD500 0.836 0.900 0.236 - 6.342 0.847 0.882 0.154 - 5.057
AOD870 0.614 1.073 0.112 - 7.989 0.599 0.877 0.074 - 4.957
AOD936 0.567 1.047 0.089 - 7.869 0.604 0.915 0.056 - 4.934
AOD1020 0.593 1.261 0.056 - 8.126 0.623 1.049 0.038 - 5.908
RPM (PM10) 77.58 0.67 76.91 - 78.25 111.68 5.77 106.49 - 117.9
FRPM (PM2.5) 45.51 0.58 45 - 46.14 75.94 3.93 72.41 - 80.17
Note: All concentrations and range of fine particulate fractions are inµgm−3.
have been found to be (68.55 - 75.91)µgm–3 and (72.41
- 80.17) µgm–3 respectively over the same period of
study. As notified by theCentral Pollution Control Board,
Govt. of India [38]for an ecologically sensitive area, the
24 hour mean standard and the annual mean standard for
the PM2.5 fractions are 60 and 40 µgm–3 respectively
whereas that for the PM10 fractions, they are 100 and 60
µgm–3 respectively. Considering both the 24 hr as well
as the annual mean standards, it is observed from the study that the measured fine particulate concentrations have exceeded these standards appreciably. This is in- deed a thought of concern for the rich biodiversity of the Sundarbans. The aerosol optical depth values have been also found to be appreciably high during the winter pe- riod with the upper range for the AOD value for the filter channel 340 nm being reported as 6.152 for the period
2005-2006 (refer Table 2). From Tables3 and 4, it is
observed that the mean values of the angstrom turbidity coefficient for all the filter channels are greater than 0.2, which is an indicative of relatively hazy atomsphere [39] prevailing in the Sundarbans. In general the mean ang-
strom turbidity coefficient values for the filter channels having shorter wavelength have been found to be high compared to their corresponding values as reported for
the summer period (refer Tables3 and 4). The prevalence
of relatively hazy atmosphere during the winter period over the years 2004-2006 can indeed be correlated to the occurrence of relatively high fine particulate concentra- tions prevailing at the sampling site during the same pe- riod (refer Tables 1 and 2). From Table5 it is observed
that the range of wind speed and temperature is appre- ciably low during the winter period over the years 2004-2006. This invariably favours the phenolmenon of thermal inversion which is generally associated with high pollution burden. Moreover during this period the wind velocity is also low (refer Table5) thereby restricting the
dispersion of the particulate fractions by confining them
locally. The range of PM10 and PM2.5 concentrations ob-
tained for the summer period over these two years vary from (76.57 - 78.25) µgm–3 and (45 - 46.14) µgm–3 re-
spectively (refer Tables 1 and 2). This is low compared to
Table 3. Angstrom turbidity coefficient values for the pe- riod 2004-2005.
Summer (2004-2005) Winter (2004-2005) Angstrom
Turbidity
Values (β) Mean Max Min Mean Max Min
β340 0.362 2.608 0.138 0.380 1.320 0.248
β500 0.423 4.021 0.124 0.437 1.114 0.325
β870 0.507 6.956 0.106 0.443 1.698 0.318
β936 0.522 7.547 0.091 0.429 1.801 0.294
[image:5.595.57.286.275.395.2]β1020 0.610 9.096 0.066 0.414 1.939 0.267
Table 4. Angstrom turbidity coefficient values for the pe- riod 2005-2006.
Summer
(2005-2006) Winter (2005-2006) Angstrom
Turbidity
Values (β) Mean Max Min Mean Max Min
β340 0.331 2.458 0.126 0.432 2.094 0.112
β500 0.372 2.824 0.105 0.424 2.530 0.077
β870 0.522 6.791 0.095 0.521 4.313 0.064
β936 0.525 7.284 0.082 0.565 4.619 0.052
β1020 0.607 8.316 0.057 0.635 6.023 0.039
But in comparison to the annual mean standard for the
PM2.5 fractions as notified by the Central Pollution Con-
trol Board, the value exceeds 40 µgm–3. Considering the
PM10 fractions it is seen that the range for the summer
period over these two years also exceeds the annual mean
standard of 60 µgm–3. Combining the two fine particu-
late fractions and considering their adverse implications on an environment of rich biodiversity it can be only said that their sources indeed need to be properly identified to reduce their concentrations and thereby curtail their ad- verse impact on the rich biodiversity of the Sundarbans. Regarding the AOD values it has been observed from
Tables 1 and 2 that the range of AOD for the filter
channels 340 nm, 500 nm, 870 nm, 936 nm and 1020 nm over a period of two years from 2004-2006 vary between 0.065 to 8.901 with the maximum average values being obtained for the smaller filter channels of 340 nm and
500 nm. This is an indicative of occurrence of finer frac- tions in substantial proportion to the coarser fractions
[39]. From Tables 3 and 4 it is observed that the ang-
strom turbidity coefficient values for all the filter chan- nels are greater than 0.2 over these two years from 2004- 2006. This again indicates the existence of relatively hazy atmospheric conditions in the Sundarbans. This atom- spheric condition can be indeed accounted for the pres- ence of finer fractions in the atmosphere.
6. Correlation of Angstrom Turbidity
Coefficient with Aerosol Optical Depth
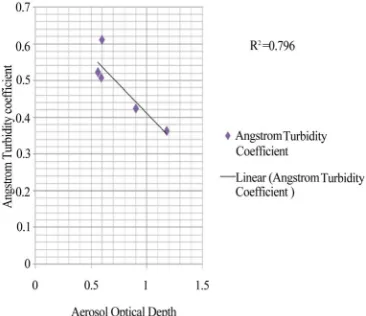
The correlation of the angstrom turbidity coefficient with AOD has been done for the summer and winter periods of 2004-2005 and 2005-2006. The correlation plots have been shown in Figures2-5 respectively.From Figures 2-5 it is seen that there is a positive
correlation between the β values and the τ values with
high correlation coefficient being obtained for the sum- mer periods. This can be possibly due to the relative closeness in the occurrences of the two values, justified well by the closeness in the dataset for the particulate fra- ctions recorded during the summer periods over the two
years of study (refer Tables 1 and 2). The correlation
coefficient values for the winter periods over the two years from 2004-2006 have been found to be close to each other. The positive correlation between the two pa- rameters synchronizes well with the occurrence of high fine particulate concentrations recorded in the area (refer
Tables1 and 2). Moreover, higher the particulate con-
centration, higher is the AOD value and hence indirectly the fine particulate concentrations are thus well correla- ted to the high angstrom turbidity values.
7. Probable Sources
[image:5.595.58.538.640.734.2]To reiterate, the absence of proper conventional energy sources in the Sundarbans is one of the basic reasons be- hind the huge combustion of biomass (mostly incom- plete) practiced in the area. This intense biomasss com- bustion can be treated as one of the most important sour- ces contributing to the aerosol loading in the area (both finer particulate fractions as well as the AOD values).
Table 5. Meteorological parameters.
Year Period Range of Wind Speed (km·hr−1) Predominant Wind Direction Range of Temperature (˚C)
Winter (5 - 10) N-E 10 - 20
Year (2004-2005)
Summer (6 - 15) S-E to S-W 25 - 35
Winter (4 - 10) N-W 12 - 19
Year (2005-2006)
Summer (6 - 14) S-E to S-W 21 - 32
Figure 2. Correlation of angstrom turbidity coefficient (β) with aerosol optical depth (τ) for the winter period of 2004-2005.
Figure 3. Correlation of angstrom turbidity coefficient (β) with aerosol optical depth (τ) for the winter period of 2005-2006.
[image:6.595.79.264.302.477.2]Figure 4. Correlation of angstrom turbidity coefficient (β) with aerosol optical depth (τ) for the summer period of 2004-2005.
Figure 5. Correlation of angstrom turbidity coefficient (β) with aerosol optical depth (τ) for the summer period of 2005-2006.
Further most of the local anthropogenic activities at the site are dependent on oil fed generators. Due to inferior quality of fuels and incomplete combustion in most cases, these result in the emissions of toxic green house gases in the area which further result into coagulation thereby forming aerosol. This fossil fuel combustion can be held accountable for having a substantial contribution to the aerosol loading over the area. Beside this there are large numbers of diesel driven boats plying in and around the area which can be treated as another probable source
contributing to the aerosol loading of the area.To sum up
fossil fuel combustion and intense biomass burning may be considered as the most common sources behind the occurrences of these appreciable aerosol loading values reported at the sampling site which has been truly reflect- ed in the corresponding angstrom turbidity coefficient values (refer Tables 3 and 4).
8. Conclusion
The angstrom turbidity coefficient values have been found significant enough to suggest the possible influx of fine particulate concentration in the aerosol loading of Sundarbnas. The finer fraction concentrations have been also obtained to be high enough making it serious point of concern to the precious biodiversity of the Sundarbans. All of these suggest the need of adopting stringent mea- sures to protect the fragile ecosystem of the Sundarbans.
REFERENCES
[1] http://www.unep-wcmc.org/index.html
[2] http:// www.iisc.ernet.in/currsci/feb102004/399.pdf [3] http://www.epa.gov/air/urbanair
[image:6.595.81.264.539.697.2]of 3 Years at Kaikhali (22.022˚N, 88.614˚E) inside a Special Mangrove Ecosystem: Sundarbans,” Journal of
Environmental Engineering, Vol. 136, No. 1, 2011, pp.
119-126. doi:10.1061/(ASCE)EE.1943-7870.0000120 [5] R. D. Brook, “Cardiovascular Effects of Air Pollution,”
Clinical Science, Vol. 115, 2008, pp. 175-187.
doi:10.1042/CS20070444
[6] K. A. Miller, D. S. Siscovick, L. Sheppard, K. Shepherd, J. H. Sullivan, G. L. Anderson and J. D. Kaufman, “Long Term Exposure to Air Pollution and Incidence of Car- diovascular Events in Women,” The New England Jour-
nal of Medicine, Vol. 356, No. 5, 2007, pp. 447-458.
doi:10.1056/NEJMoa054409
[7] O. J. Chakre, “Choice of Eco-Friendly Trees in Urban
ee, A. P. Mitra, C. Sharma, T. K. Mandal, P. K.
ett, G. M. Williams, J. Schwartz, A. H. Neller, Environment to Mitigate Airborne Particulate Pollution,”
Journal of Human Ecology, Vol. 20, No. 2, 2006, pp.
135-138. [8] I. Mukherj
Gupta, A. Singn and N. Chakraborty, “Measurement of Particulates at a Transboundary Location, Kaikhali in Sundarban,” Indian Journal for Air Pollution Control
(IJAPC), New Delhi Chapter, Vol. V, No. 2, 2005, pp.
114-118. [9] A. G. Barn
T. L. Best, A. L. Petroeschevsky and R. W. Simpson, “Air Pollution and Child Respiratory Health: A Case- Crossover Study in Australia and New Zealand,” Ameri-
can Journal of Respiratory and Critical Care Medicine,
Vol. 171, 2005, pp. 1272-1278. doi:10.1164/rccm.200411-1586OC
ealth Effects of
Air-n, [10] R. Mohanraj and P. A. Azeez, “H
borne Particulate Matter and the Indian Scenario,”
Cur-rent Science, Vol. 87, No. 6, 2004, pp. 741-747.
[11] D. A. Grantz, J. H. B. Garner and D. W. Johnso “Eco- logical Effects of Particulate Matter,” Environment In-
ternational, Vol. 29, No. 2, pp. 213-239.
doi:10.1016/S0160-4120(02)00181-2
[12] J. J. Cao, S. C. Lee, K. F. Ho, X. Y. Zhang, S. C. Zou, K. Fung, J. C. Chaw and J. G. Watson, “Characteristics of Carbonaceous Aerosol in Pearl Delta Region, China during 2001 Winter Period,” Atmospheric Environment, Vol. 37, No. 11, 2003, pp. 1451-1460.
doi:10.1016/S1352-2310(02)01002-6
[13] M. Krzyzanowski, A. Cohen and R. Anderson, “Quanti- fication of Health Effects of Exposure to Air Pollution,”
Occupational Environmental Medicine, Vol. 59, No. 12,
2002, pp. 791-793. doi:10.1136/oem.59.12.791
[14] J. N. B. Bell and M. Treshow, “Air Pollution and Plant
71-4
Life,” 2nd Edition, John Wiley & Sons,Hoboken, 2002. [15] S. B. Lee, G. N. Bae, K. C. Moon and Y. P. Kim,
“Char-acteristics of TSP and PM2.5 Measured at Tokchok Island
in the Yellow Sea,” Atmospheric Environment, Vol. 36, No. 35, 2002, pp. 5427-5435.
doi:10.1016/S1352-2310(02)006
nd, J. S. Hall, R.
nge,” In: K. J.
-
[16] D. Wagenbach, F. Ducroz, M. Legra
Mulvaney and E. W. Wolff, “Sea Salt Aerosol in Coastal Antarctic Regions,” Journal of Geophysical Research, Vol. 103, No. D9, 1998, pp. 10961-10974.
[17] R. Leemans, “Biodiversity and Global Cha
Gaston, Ed., Biodiversity, a Biology of Numbers and Dif-
ference, Blackwell Science, Oxford, 1996, pp. 367-387.
[18] D. W. Dockery and C. A. Pope, “Acute Respiratory Ef fects of Particulate Air Pollution,” Annual Review of
Public Health, Vol. 15, 1994, pp. 107-132.
doi:10.1146/annurev.pu.15.050194.000543
[19] C. A. Pope, J. Schwartz and M. R. Ransomi, “Daily Mor- tality and PM10 Pollution in Utah Valley,” Archives En-
vironmental Health, Vol. 47, 1992, pp. 211-217.
doi:10.1080/00039896.1992.9938351
[20] F. K. Anderson and M. Threshow, “Plant Stress from Air
ic Ef-
, M. L. Bollinger, S. C. Liu, P.
. Rodhe, “Direct
Chakraborty and T. K. Mondal, “Obser-
a, “Indian Aerosol: Present Sta- Pollution,” John Wiley and sons, New York, 1991. [21] F. Scholz, H. R. Gregorious and D. Rudin, “Genet
fects of Air Pollution in Forest Tree Populations,” Springer- Verlag, New York, 1987.
[22] D. D. Parrish, R. B. Norton
C. Murphy, D. L. Albritton and F. C. Fehsenfeld, “Meas- urements of HNO3 and NO3-Particulate at a Rural Site in
the Colorado Mountains,” Journal of Geophysical Re-
search, Vol. 91, 1986, pp. 5379-5393.
[23] R. J. Charlson, T. L. Anderson and H
Climate Forcing by Anthropogenic Aerosols: Quantifying the Link between Atmospheric Sulfate and Radiation,”
Contributions to Atmospheric Physics, Vol. 72, No. 1,
1999, pp. 79-94. [24] I. Mukherjee, N.
vations on Aerosol Optical Depth over a Period of 3 Years at Kaikhali (22.022˚N, 88.614˚E) inside a Special Mangrove Ecosystem—The Sundarbans,” International
Journal of Water, Air & Soil Pollution, Springer, Vol.
215, 2011, pp. 477-486. [25] A. P. Mitra and C. Sharm
tus,” Chemosphere, Vol. 49, 2002, pp. 1175-1190. doi:10.1016/S0045-6535(02)00247-3
[26] R. Gabriel, O. L. Mayol-Bracero and M. O. Andrea, “Che-
. S. Devara,
M. Moya, A. Marti-
2005.03.015
mical Characterization of Submicron Aerosol Particles Collected over the Indian Ocean,” Journal of Geophysi-
cal Research, Vol. 107, 2002, p. 8005.
[27] K. K. Dani, R. S. Maheshkumar and P. C
“Study of Total Column Atmospheric Aerosol Optical Depth, Ozone and Precipitable Water Content over Bay of Bengal during BOBMEX-99,” Proceedings of the
In-dian Academy of Sciences (Earth and Planetary Science),
Vol. 112, No. 2, 2003, pp. 205-221. [28] C. Marquez, T. Castro, A. Mahlia,
nez-Arroyo and A. Baez, “Measurement of Aerosol Par-ticles, Gases and Flux Radiationin the Pico de Orizaba National Park, and Its Relationship to Air Pollution Transport,” Atmospheric Environment, Vol. 39, No. 21, 2005, pp. 3877-3890.
doi:10.1016/j.atmosenv.
eleti, N. Kouremeti,
ical-papers/climate-changes-biodi [29] S. Kazadis, A. A. Bais, D. Balis, C. M
C. S. Zerefos, S. Rapsomanikis, M. Petrakakis, A. Kelesis, P. Tzoumaka and K. Kelektsoglou, “Nine Years of UV Aerosol Optical Depth Measurements at Thessaloniki, Greece,” Atmospheric Chemistry and Physics, Vol. 7, 2007, pp. 2091-2101.
ov.in/annual_report-2.pdf
of Respirable
surement of Criteria Pollutants in Ambient Air,”
tion Manual of Fine
Light Co. Inc., “Operation Manual of Microtops II
tras, K. D. Kirk versity-en.pdf
[31] www.iirs nrsa.g
[32] Envirotech, Pvt. Ltd., “Operation Manual
S. F
Dust Sampler,” Model No APM 460, Envirotech, Pvt. Ltd.
[33] “Mea
Laboratory Analytical Techniques Series, 1990-91, Cen-tral Pollution Control Board, Parivesh Bhavan, East Ar-jun Nagar, New Delhi, 1990.
[34] Envirotech, Pvt. Ltd., “Opera
ticulate Sampler,” Model No APM 550, Envirotech Pvt Ltd.
[35] Solar
[37]
Sunphotometer,” Solar Light Co. Inc.
[36] R. Frouin, B. Holben, M. Miller, C. Pie , G. [39] www.sti.nasa.gov/Pubs/star/star0809.pdf
argion, J. Porter and K. Voss, “Sun and Sky Radiance Measurements and Data Analysis Protocols,” In: J. L. Mueller, G. S. Fargion and C. R. MacClain, Eds., Ocean Optical Protocols for Satellite Ocean Color Sensor Vali-
dation, Revision 4, Radiometric Measurements and Data
Analysis Protocols, NASA, Goddard Space Flight Center,
Greenbelt, 2003, pp. 60-69.
C. Pietras, M. Miller, K. D. Kirk, R. Frouin, B. Holben and K. Voss, “Calibration of Sunphotometer and Sky Ra- diance Sensors,” In: J. L. Mueller, G. S. Fargion and C. R. Mac-Clain, Eds., Ocean Optical Protocols for Satellite
Ocean Color Sensor Validation, Revision 4, Instrument
Specifications, Characterization and Calibration, NASA,