ISSN Online: 2327-4344 ISSN Print: 2327-4336
DOI: 10.4236/gep.2017.510001 Oct. 11, 2017 1 Journal of Geoscience and Environment Protection
Vulnerability Studies of Sensitive Watershed
Areas of Owerri South East Nigeria Using Digital
Elevation Models
Ngozi AC-Chukwuocha1*, Sabastine Amauche Ngah2, Akajiaku C. Chukwuocha3
1Department of Environmental Technology, Federal University of Technology, Owerri, Nigeria
2Institute of Geoscience and Space Technology, Rivers State University of Science and Technology, Port Harcourt, Nigeria 3Department of Surveying and Geoinformatics, Federal University of Technology, Owerri, Nigeria
Abstract
The impact of human activities on sensitive watershed terrains is a critical consideration in the management of urban ecosystems. Degradation of sensi-tive ecosystem features such as watershed land areas is often irreversible due to the extent and intensity. The vulnerability of 150 m watershed management zone of Otamiri river Owerri Imo State, Nigeria was studied by topographic analysis using 1977 digital elevation model (DEM), 1977 aerial photos, Shuttle Radar Topographic Mission DEM of 2000, 2012 satellite imagery and the 2016 Master Plan of the study area. The impact of human activities in elevation change was observed in the parts of substantial human activities while topo-graphical stability was recorded for areas of very low human activities.
Keywords
Vulnerability, Watershed, Ecosystem, Impacts
1. Introduction
Urban ecosystem is a dynamic complex ecosystem with physical, biological and social components that interact and behave as a functional unit in any environ-ment. Like natural ecosystem, urban ecosystems are important because they provide services such as provisioning, regulating, supporting and cultural at various scales and forms. These services are easily recognized in any given wa-tershed area. The services such as water supply, ground water recharge, natural flood control, biodiversity conservation and micro climate regulation make wa-tershed an environmental “sensitive area” that demands close monitoring for How to cite this paper: AC-Chukwuocha,
N., Ngah, S.A. and Chukwuocha, A.C. (2017) Vulnerability Studies of Sensitive Watershed Areas of Owerri South East Nigeria Using Digital Elevation Models. Journal of Geoscience and Environment Protection, 5, 1-10.
https://doi.org/10.4236/gep.2017.510001
Received: August 17, 2017 Accepted: October 8, 2017 Published: October 11, 2017
Copyright © 2017 by authors and Scientific Research Publishing Inc. This work is licensed under the Creative Commons Attribution International License (CC BY 4.0).
DOI: 10.4236/gep.2017.510001 2 Journal of Geoscience and Environment Protection sustainable use [1].
The increasing population growth in urban ecosystem entails increase in de-mand for and consumption of biological and physical resources, thus causing escalating impacts on ecosystems and the services they provide. The problem posed by the growing demand for ecosystem services is compounded by the in-creasingly serious degradation in the capability of ecosystems to provide these services. Some of these impacts of these degradations may be irreversible as the case of biodiversity loss and soil degradation [2]. This ever-growing demands being placed on increasingly degraded ecosystems seriously diminishes the prospects for sustainable development.
Urban ecosystem management is important because of the increasing popula-tion growth and its attendant resource deplepopula-tion and degradapopula-tion [3]. The de-gradation of the ecosystem is critical if it is in the watershed land area.
The study area, Otamiri watershed is an urban watershed situated in a high density area, Owerri in Imo state, southeastern Nigeria. Imo state is one of the densely populated states in Nigeria; with Owerri having a high population den-sity of 813.54 persons per square kilometer in the study area [4]. Otamiri River is significant because it serves as the only surface water for domestic and agricul-tural purposes. The watershed resources such as coarse red sands in form of la-terites are used for construction purposes.
In seeking to protect the surface water in the state from ecological hazards, the 1995 Imo State Government watershed Management Regulation provides a clause that states that 150 m wide on both sides of the river bank, termed wa-tershed management area should be protected and not encroached upon. Analy-sis on the changes in the pattern and distribution of land uses and land covers in the study area, showed that the designated 150 m wide watershed management zone is disturbed. Sand excavation and builtup land classes occupied 13.95% and 9.07% of the buffer zone. And 16.59% of the riparian vegetation that make up the buffer zone was converted to sand excavation site between 1977 and 2012
[5]. The high dynamicity index values of 25.78% and 11.51%, (in 2006) from
sand excavation sites and builtup classes respectively have implications for changes in the topography of the protected zone [6].
These inappropriate activities such as infrastructural developments, farming and sand excavation activities practiced within and around the protected wa-tershed area, make the fragile ecosystem vulnerable to stream bank erosion, gully erosion sites at the downstream of the study area, siltation of Otamiri tributary and at the head source upstream. This paper attempts to measure changes in elevation due to human activities within the watershed management zone and along the water courses.
2. The Study Area
an-DOI: 10.4236/gep.2017.510001 3 Journal of Geoscience and Environment Protection nual total mean of 2190mm (Imo State Govt. Ministry of Works & Transport, 1984). The mean monthly temperature for dry season is 34˚C and 30˚C for rainy season. The river has average flow of 10.7 m3/s in the rainy season (September-
October) and a minimum average flow of about 3.4 m3/s in the dry season
(No-vember to February). The total annual discharge of the Otamiri is about 1.7 × 10⁸ m3, and 22 percent of this (3.4 × 10⁷ m3) comes from direct runoff from
rainwater and constitutes the safe yield of the river [7].
According to [8], Owerri was originally an agricultural settlement of five vil-lages with a central market linking the vilvil-lages. The story of the modern Owerri may begin with the year 1901 when the British administration reached Owerri and by 1918 Owerri had become the headquarters of the Eastern Protectorate. In 1953 the Shell D’Arcy Exploration Company began to build up its headquarters known as “Shell Camp”, bringing some economic growth resulting in residential expansion, market reconstruction, and a new motor park. The early plan of the town was prepared in 1948 by Tetlow, a British town planning adviser to West Africa.
On February 3, 1976, Imo State was carved out of the old East Central State, and Owerri was made the capital of the new State. Owerri has since then ex-panded into neighbouring towns and villages of Orji, Egbu, Mbieri, Uratta, Amakohia, Irete, Egbeada, Avu, Obinze, Nekede, Ihiagwa, Naze etc. Many layouts have been planned and developed.
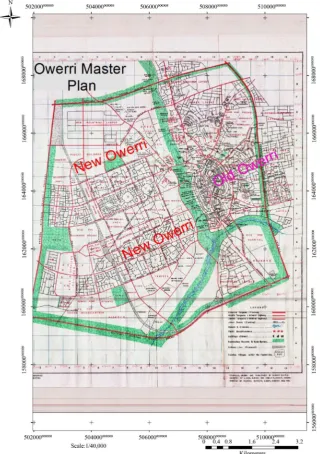
From the creation of Imo State, the philosophy of the development of modern Owerri is built on the principle of a twin city. The two water bodies that trans-verse the present day Owerri formed the boundaries of the Old Owerri city. Otamiri River, the major water body runs approximately East-West from its source at Egbu until its confluence with the Nwaorie stream, a tributary of Ota-miri River. Nwaorie runs approximately North-South down to the confluence with Otamiri River. After the Confluence, Otamiri River continues southwards to Nekede. In those early days people inhabited Owerri North of Otamiri River and East of Nwaorie Stream. There was a natural safe distance between the set-tlements and the water bodies. However, with the creation of Imo State came a very fast expansion of the town and human activities along the riparian forest area on the sides where humans inhabited increased tremendously also. Figure 1 shows the Owerri Master Plan, comprising of the Old Owerri and the New Owerri Twin City.
3. Materials and Methods
Data Source and Acquisition Process
DOI: 10.4236/gep.2017.510001 4 Journal of Geoscience and Environment Protection Figure 1. Owerri Master Plan showing the Old and New Owerri Twin City.
create the Digital Elevation Model of the study area. The DEM of 1977 topo-graphic map sheets was overlaid with 2000 SRTM DEM. The result was a Digital Elevation Change Model, which was sampled at fourteen points at 1km interval to determine an average value of change in parts of the water courses. In order to delineate the designated watershed management area, the Master plan of Owerri was overlaid on the change DEM of the study area.
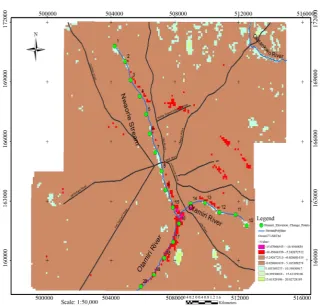
Figure 2 shows the points along the water bodies at which elevation change
DOI: 10.4236/gep.2017.510001 5 Journal of Geoscience and Environment Protection Figure 2. Sample Elevation Change Data Points along Nwaorie Stream and Otamiri.
−7.028 respectively, between 1977 and 2000. The average change values of +5.159 m, +3.616m imply raised elevations along the courses of Nworie stream and eastern Otamiri river. These positive values are indicative of the sedimenta-tion and siltasedimenta-tion taking place along the water courses of Nwaorie stream and certain sections of Otamiri River, as may be observed physically.
−7.028 m average change value of Otamiri south of the confluence implies a deeper elevation in year 2000 than in year 1977. The reduction in elevation is suggestive of erosive action taking place along Otamiri water courses south of the confluence. These areas are found within the Nekede community where gul-ly and stream bank erosion has ravaged the land. Intensive and extensive sand and gravel excavation take place in this area. Arable farmlands were cleared and access roads built for the commercial sand excavation activities.
4. Results and Discussion
Measures of Elevation Changes along the Water Courses
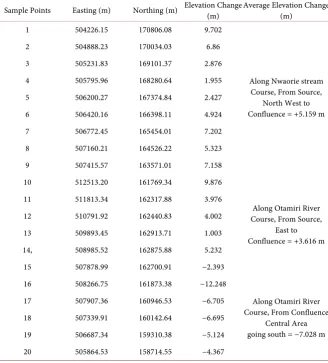
Table 1 presents the result of average measure in the change of elevation along
DOI: 10.4236/gep.2017.510001 6 Journal of Geoscience and Environment Protection
Table 1. Sample Points of Elevation Changes along Otamiri Water Courses.
Sample Points Easting (m) Northing (m) Elevation Change (m) Average Elevation Change (m)
1 504226.15 170806.08 9.702
Along Nwaorie stream Course, From Source,
North West to Confluence = +5.159 m
2 504888.23 170034.03 6.86
3 505231.83 169101.37 2.876
4 505795.96 168280.64 1.955
5 506200.27 167374.84 2.427
6 506420.16 166398.11 4.924
7 506772.45 165454.01 7.202
8 507160.21 164526.22 5.323
9 507415.57 163571.01 7.158
10 512513.20 161769.34 9.876
Along Otamiri River Course, From Source,
East to Confluence = +3.616 m
11 511813.34 162317.88 3.976
12 510791.92 162440.83 4.002
13 509893.45 162913.71 1.003
14, 508985.52 162875.88 5.232
15 507878.99 162700.91 −2.393
16 508266.75 161873.38 −12.248
Along Otamiri River Course, From Confluence
Central Area going south = −7.028 m
17 507907.36 160946.53 −6.705
18 507339.91 160142.64 −6.695
19 506687.34 159310.38 −5.124
20 505864.53 158714.55 −4.367
5. Results and Discussion
5.1. Measures of Elevation Changes along the Water Courses
Table 1 presents the result of average measure in the change of elevation along
the water courses at average interval of 1 km. Sample points 1 to 9 depict values of elevation changes along the courses of Nwaorie stream while sample points 10 to 14 are the values of elevation changes along the eastern Otamiri River before the confluence. Sample points 15 to 20 are values of the elevation changes south of the confluence.
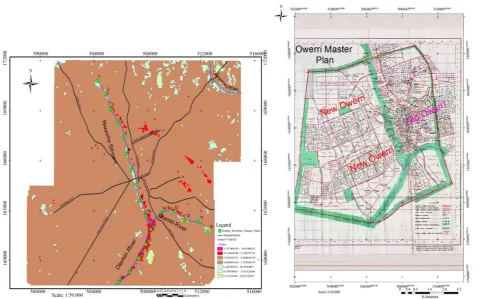
DOI: 10.4236/gep.2017.510001 7 Journal of Geoscience and Environment Protection Figure 3. Otamiri Watershed Elevation Change Map compared with the Master Plan of Owerri.
washing away. These point to the harsh impact of anthropogenic activities with-in the sensitive watershed area.
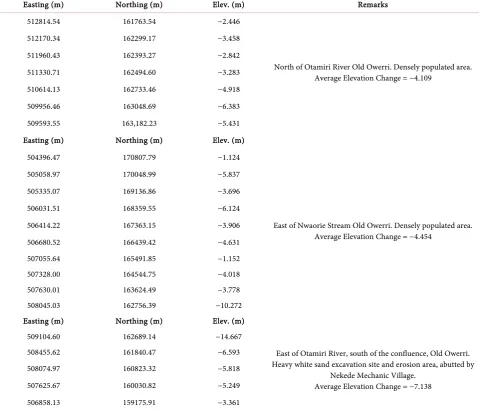
5.2. Elevation Changes in the Watershed Management Area The analyses of the elevation changes as in Table 2 for Old Owerri and Table 3 for New Owerri show marked erosion of the banks of the water bodies in the old Owerri areas which have been heavily populated over the years. The water courses along those areas, specifically along the Nwaorie Stream from the source at the North of the project area going south towards the confluence showed marked siltation up between 1977 and 2000 the border dates of the elevation da-ta. The same is the case for Otamiri River running from East side of the project area to the confluence which has recorded remarked erosion of the bank north of the river in the old Owerri side and a marked elevation of the water bed, sug-gesting siltation.
DOI: 10.4236/gep.2017.510001 8 Journal of Geoscience and Environment Protection Table 2. Elevation Changes at Sample Points in the Watershed Management Area of Old Owerri with High Human Habitation Density.
Easting (m) Northing (m) Elev. (m) Remarks
512814.54 161763.54 −2.446
North of Otamiri River Old Owerri. Densely populated area. Average Elevation Change = −4.109
512170.34 162299.17 −3.458
511960.43 162393.27 −2.842
511330.71 162494.60 −3.283
510614.13 162733.46 −4.918
509956.46 163048.69 −6.383
509593.55 163,182.23 −5.431
Easting (m) Northing (m) Elev. (m)
504396.47 170807.79 −1.124
East of Nwaorie Stream Old Owerri. Densely populated area. Average Elevation Change = −4.454
505058.97 170048.99 −5.837
505335.07 169136.86 −3.696
506031.51 168359.55 −6.124
506414.22 167363.15 −3.906
506680.52 166439.42 −4.631
507055.64 165491.85 −1.152
507328.00 164544.75 −4.018
507630.01 163624.49 −3.778
508045.03 162756.39 −10.272
Easting (m) Northing (m) Elev. (m)
509104.60 162689.14 −14.667
East of Otamiri River, south of the confluence, Old Owerri. Heavy white sand excavation site and erosion area, abutted by
Nekede Mechanic Village. Average Elevation Change = −7.138
508455.62 161840.47 −6.593
508074.97 160823.32 −5.818
507625.67 160030.82 −5.249
506858.13 159175.91 −3.361
to reduction in elevation of the river banks by an average 4.454 m for east of Nworie and 4.108 m for North of Otamiri.
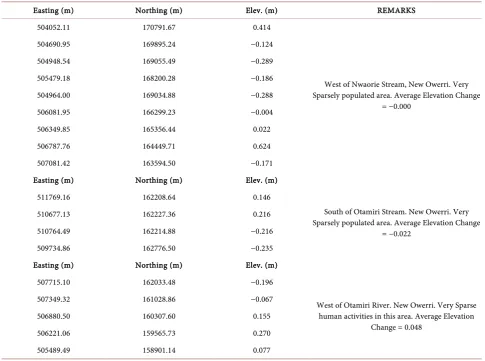
The southern bank of Otamiri from its source to the confluence has been largely uninhabited and untampered. The water bank west of Nworie stream down to the confluence and further down south along the western bank of Ota-miri river from the confluence going towards Nekede, a village close to the capi-tal city fall in the New Owerri Capicapi-tal Territory, an area largely uninhabited over the years. These water banks were observed not to have been eroded, in some cases recording average elevation change ranging from 0.000 m to 0.048 m indi-cating no change in elevation.
DOI: 10.4236/gep.2017.510001 9 Journal of Geoscience and Environment Protection Table 3. Elevation Changes at Sample Points in the Watershed Management Area of New Owerri with Low Density Human Ac-tivities.
Easting (m) Northing (m) Elev. (m) REMARKS
504052.11 170791.67 0.414
West of Nwaorie Stream, New Owerri. Very Sparsely populated area. Average Elevation Change
= −0.000
504690.95 169895.24 −0.124
504948.54 169055.49 −0.289
505479.18 168200.28 −0.186
504964.00 169034.88 −0.288
506081.95 166299.23 −0.004
506349.85 165356.44 0.022
506787.76 164449.71 0.624
507081.42 163594.50 −0.171
Easting (m) Northing (m) Elev. (m)
511769.16 162208.64 0.146
South of Otamiri Stream. New Owerri. Very Sparsely populated area. Average Elevation Change
= −0.022
510677.13 162227.36 0.216
510764.49 162214.88 −0.216
509734.86 162776.50 −0.235
Easting (m) Northing (m) Elev. (m)
507715.10 162033.48 −0.196
West of Otamiri River. New Owerri. Very Sparse human activities in this area. Average Elevation
Change = 0.048
507349.32 161028.86 −0.067
506880.50 160307.60 0.155
506221.06 159565.73 0.270
505489.49 158901.14 0.077
along the riparian vegetation corridors of the river banks. And with the current spate of city development, encroaching into the buffer zone, there may be a near loss of biodiversity from the watershed ecosystem. Loss of biodiversity has been noted as one of irreversible human impact on the ecosystem [2]. The ecosystem is prone to greater risk of climate change, because of their weak capacity for resi-lience.
6. Conclusions and Recommendations
6.1. Conclusions
This study has effectively demonstrated the feasibility of the “Vulnerability Stu-dies of Sensitive Watershed Areas by human activities in Owerri South East Ni-geria Using Digital Elevation Models (DEM)”. Digital Elevation Models (DEM) of 1977 and 2000 epochs were processed on a Geographic Information Systems (GSI) platform to create the digital elevation change matrix which is a Raster data type showing recorded changes in elevation over the period of study.
DOI: 10.4236/gep.2017.510001 10 Journal of Geoscience and Environment Protection activities on the sensitive parts of the watershed. Based on the above findings, the study concludes that the 150 m wide on both sides of the river banks desig-nated as watershed management zone is threatened with degradation due to in-tensive human impacts. The loss in ecosystem services is loss of biodiversity and arable land, increase in impervious surfaces with its attendant overland flow, loss of properties and human settlements and increase in the treatment of the water for domestic and industrial needs.
6.2. Recommendations
Based on the findings it is recommended that these digital elevation change ma-trix method be employed in the scaled studies of the vulnerability of the sensitive watershed areas. These studies can actually lead to the determination of what volume of sand that has been washed away and through that ultimately the pop-ulation of earth inhabiting faunas that have been washed away with the sand. A number of other impacts could be studied using this method.
By the conclusion of these vulnerability studies, it is obvious that the Otamiri River and the attendant ecosystem are threatened and may silt up. Government is called upon for immediate intervention to stop further constructions within the 150 m protected area and to also reduce human activities that would impact the Otamiri watershed and ecosystem negatively.
References
[1] Revenga, C., Murray, S., Abramovitz, J., and Hammond, A., (1998) Watersheds of the World: Ecological Value and Vulnerability. World Resource Institute, Wash-ington DC.
[2] Lambin, E.F. and Geist, H.J. (2010) Land Use and Land Cover Change: Local Processes and Global Impacts. IGBP Global Change, The IGBP Series, International Geosphere-Biosphere Program, Human Dimensions Global Environment Change Program. Berlin Heidelberg, Springer.
[3] Jing, S., Hongwei, L., Yang, Z. and Li, H. (2016) Vulnerability Assessment of Urban Ecosystems Driven by Water Resources, Human Health and Atmospheric Envi-ronment. Journal of Hydrology, 536, 456-470.
[4] Federal Republic of Nigeria (2009) Federal Republic of Nigeria Official Gazette: Supplement to the Gazette, Government Notice No.2. FGP 16122009/10,000(0L020) Federal Government Printer, Abuja, 96.
[5] Chukwuocha, A.C. and Igbokwe, J.I. (2014) Delineation and Characterization of Sub-Catchments of Owerri, South East Nigeria, Using GIS. American Journal of Geographic Information System, 3, 1-9.
[6] AC-Chukwuocha, N.B. (2015) Analysis of Structural Changes in Land Use and Land Cover of Otamiri Watershed in Owerri, South East Nigeria. Journal of Envi-ronment and Earth Science, 5, 51-59.
[7] Egboka, B.C., and Uma, K.O. (1985) Water Resources of Owerri and Its Environs, Imo State. Nigeria Journal of Mineral Geology, 22, 57-64.