Munich Personal RePEc Archive
Latent Factor Models for Credit Scoring
in P2P Systems
Ahelegbey, Daniel Felix and Giudici, Paolo and
Hadji-Misheva, Branka
Boston University - Department of Mathematics and Statistics,
University of Pavia Faculty of Economics, University of Pavia
-Department of Economics and Management
4 July 2018
Online at
https://mpra.ub.uni-muenchen.de/92636/
Latent Factor Models For Credit Scoring In P2P Systems
Daniel Felix Ahelegbeya, Paolo Giudicib, Branka Hadji-Mishevab,∗
a
Department of Mathematics and Statistics, Boston University, USA b
Department of Economics and Management Sciences, University of Pavia, Italy
Abstract
Peer-to-Peer (P2P) FinTech platforms allow cost reduction and service improvement in credit lending. However, these improvements may come at the price of a worse credit risk measure-ment, and this can hamper lenders and endanger the stability of a financial system. We approach the problem of credit risk for Peer-to-Peer (P2P) systems by presenting a latent factor-based classification technique to divide the population into major network communities in order to estimate a more efficient logistic model. Given a number of attributes that capture firm performances in a financial system, we adopt a latent position model which allow us to distinguish between communities of connected and not-connected firms based on the spatial position of the latent factors. We show through empirical illustration that incorporating the latent factor-based classification of firms is particularly suitable as it improves the predictive performance of P2P scoring models.
Keywords: Credit Risk, Factor models, Financial Technology, Peer-to-Peer, Scoring models, Spatial Clustering
1. Introduction
In the past ten years, the emergence of financial technology ventures (‘FinTechs’) in both the consumer and commercial credit space has introduced many opportunities for both lenders and investors, which has in turn redefined the role of traditional intermediaries. Since 2005, the growth of FinTech investments has been exponential, with their total funding jumping from around $5.5B in 2005 to more than $100.2B in 2017. A key development within the context of alternative financial service operators, is the emergence and fast growth of peer-to-peer lending platforms. The concept “peer-peer-to-peer” captures the interaction between units while eliminating the need for a central intermediary. The origins of the term can be found in the field of computer networking where it describes a network where any one computer can act as a client or a server to other computers connected within the network without the need of connecting to a centralized server (Milne and Parboteeah,2016).
In the context of finance, P2P platforms offer disintermediation by allowing borrowers and lenders to communicate directly. With the rapid growth of P2P lending activities, a key point of interest becomes assessing their risks, to protect investors and maintain financial stability. From a general viewpoint, despite the fact that P2P platforms offer many advantages
∗Corresponding author at: Via San Felice 7, 27100, Pavia, Italy.
Email addresses: [email protected](Daniel Felix Ahelegbey),[email protected](Paolo Giudici),
to borrowers and lenders, causes for concerns do exist. Namely, P2P platforms are less able to deal with asymmetric information, compared to traditional banks. This can lead to adverse selection, in which investors cannot distinguish between borrowers belonging to different levels of credit risk. This problem is made worse by the difference in risk ownership that exists between P2P and traditional banking models. Although both banks and P2P platforms rely on scoring models for the purpose of estimating the probability of default of a loan, the incentive for model accuracy may differ significantly, as in the context of P2P lending platforms, in most cases, the credit risk is not born by the platform but, rather, by the investors. Because of P2P platform’s inability to solve for asymmetric information as efficiently as traditional banks, and because of the differences in risk ownership, the scoring system of P2P lenders may not adequately reflect the “correct” probability of default of a loan.
A further issue associated with the nature of P2P platforms, not considered extensively within the literature, is that they are by construction globally-interconnected networks. This in turn suggests that the application of traditional scoring models may lead to bias and inaccurate classification of borrowers into different levels of credit risk. Specifically, classical banks have, over the years, segmented their reference markets into specific territorial areas, or into specific business activities, increasing the accuracy of their ratings but, on the other hand, increasing concentration risks. Differently, P2P platforms are based on a “universal” banking model, fully inclusive, without space and business type limitations, that benefits from diversification but which suffers from a difficult scoring mechanism.
We claim that the inclusion of network information can improve loan default predictions, as it captures information that reflects underlying common features, that cannot be other-wise observed. For related works seeWilson and Sharda(1994) and Letizia and Lillo(2018). Besides improving predictive accuracy, a network representation can also provide valuable “descriptive” insights on the interconnectedness between companies participating in the P2P platform, identifying participants which are central to the network and, therefore, most im-portant from a systemic risk perspective. In line with this, our main contributions are two: i) to analyze the predictive performance of scoring models employed by P2P platforms, specif-ically in SME lending; ii) to investigate whether network-based scoring model can improve loan default predictions, and, therefore, better protect investors, and better preserve financial stability.
In the context of peer to peer lending, we propose a network-based scoring models based on an alternative method of inferring links between P2P participants, based on uncovering community structures within them.
Most financial systems are characterized by the existence of structural modules that play significant roles and define the functional role of the system (Sarkar and Dong,2011). Com-munities in a network are the dense group of nodes which are tightly coupled to each other within the group and loosely coupled to the rest of the nodes in the network (Khan and Ni-azi,2017). Community detection within the context of P2P platforms will allow us to better understand the properties and functionalities of the network and also it will also help the process of developing and estimating a more efficient scoring model for these platforms which in turn will ensure higher-level protection for investors and overall financial stability.
By representing SMEs which have applied for a loan to a P2P lending platform as vectors in real space, expressed as linear combinations of orthogonal bases described by singular value decomposition (SVD), orthogonality becomes a metric for classifying the respective SMEs into communities. Specifically, the information contained in the eigenvectors and eigenvalues are at the center of all spectral graph partitioning approaches. In the context of this study, nodes are partitioned in two groups such that companies connected to each other belong to the same community. Once the adjacency matrix based on the SVD approach is inferred, we estimate and compare the predictive utility of traditional scoring models for connected and not-connected nodes independently. Note that, in applying this approach, we attempt to replicate the segmentation practices which are an imperative factor of bank’s service offering and main determinant of the accuracy of their scoring models.
To summarize, this paper contributes to the literature on credit scoring for P2P lending by: a) propose a new network-based scoring model, that leverages the structure of network communities, obtained using all available information; and b) demonstrate that such a model improves predictive accuracy and, therefore, reliability, of credit risk estimations provided by P2P platforms. By increasing the ability of P2P lenders to successfully discriminate between different risk classes, the proposed methodology indirectly helps stabilize the overall financial system. Namely, although regulators are greatly interested in managing credit risk exposure, they cannot apply such models as they are based on commercial data made available only to the P2P lending platform.
The paper is organized as follows. Section 2 contains the proposed methodology, Section 3 discuss application to a credit scoring database provided by a European rating agency that supplies credit risk information to P2P platforms and, Section 4 presents concluding remarks.
2. Methodology
2.1. Scoring Models
Generally, the main linear statistical tool used for developing credit scoring model is the logistic regression. In the context of P2P lending, logistic regression has been used in the studies of Andreeva et al.(2007); Barrios et al.(2014); Emekter et al. (2015);Serrano-Cinca and Gutiérrez-Nieto (2016). This approach aims to classify the dependent variable in two groups, characterized by a different loan status [1=default; 0=no default] in which borrowers are classified by logistic regression, specified by the following model:
ln( pi
1−pi) =α+
m
X
j=1
wherepi is the probability of default, for borrower i,xi = (xi1, . . . , xim) is an mdimensional
vector of borrower-specific explanatory variables, and the intercept parameter α, as well as the regression coefficientsβj, for j = 1, . . . , m, are to be estimated from the available data.
It follows that the probability of default can be obtained as:
pi = 1 + exp(α+ m
X
j=1
βjxij)−1 (2)
We remark that, in the case of low default frequencies, which can typically occur for highly “selective” P2P platforms, logistic regression could be replaced by other generalized linear models, such as the generalized extreme regression scoring model proposed byCalabrese and Giudici(2015). One approach for incorporating network information into the econometric specification is by extending the work ofChinazzi et al. (2013) by adding network summary measures to the logistic regression context. This leads to the proposal of a network-based scoring, which may take the following form:
ln( pi 1−pi
) =α+X
j
βjxij +γgi (3)
where pi is the probability of default, for borrower i, xi = (xi1, . . . , xij, . . . , xiJ) is a vector
of borrower-specific explanatory variables, gi is the network centrality measure for borrower
i and the intercept parameter α and the regression coefficients γ and βj, for j = 1, . . . , J,
are to be estimated from the available data. Specifically, what is suggested byGiudici and Hadji-Misheva (2017) is using correlation network models for deriving an adjacency matrix between the participants in the P2P platform. Once an adjacency matrix is derived, estimated centrality measures are incorporated into the predictive model.
However, the above specification suffer for one important limitation: it requires the pre-liminary choice of an explanatory variable, on which to derive the correlation matrix between the observed company times series. This may be fine when one variable is sufficient to discrim-inate credit behavior; when more variables, instead, are required, an alternative approach is necessary. To build correlation network models that simultaneously consider more variables, we propose a network-based scoring model that uncovers community structures within them. Communities in a network are the dense group of nodes which are tightly coupled to each other within the group and loosely coupled to the rest of the nodes in the network (Khan and Niazi,2017).
Our approach can be described by three consecutive steps. We first obtain the latent factors (positions) for each credit applicant (i); we then infer communities between connected and not-connected nodes (ii); last, we estimate and compare the predictive performance of logistic regression models, separately for connected and not-connected nodes (iii). In the next two subsections we describe steps (i) and (ii), while (iii) is the logistic regression model described in this section, applied separately to each of the found communities.
2.2. Latent Factor Model
Let Z be an arbitrary n×m matrix. The singular value decomposition (SVD) of any
n×m non-symmetric matrix Z can be expressed as
whereD = Λ1/2 is a diagonal matrix, with Λ interpreted as the diagonal matrix of nonzero
eigenvalues of Z′Z and ZZ′, U and V are matrices whose columns are the orthonormal
eigenvectors ofZZ′ andZ′Z respectively. More specifically, U is referred to as the matrix of
the left singular vectors that span the column space ofZ and the columns ofV span its row space and are referred to as the right singular vectors.
LetX = (x1, . . . , xn)′ be a stacked collection of the institutional features. FollowingHoff
(2007), we relate the observations inX to the following model
X=Z+E=U DV′+E (5)
whereZ is the expectation ofX andE is the errors assumed to be normally distributed with mean zero and covariance matrix Σ.
We assume the observed institutional attributes are driven by some unobserved underlying factors that signal the financial conditions of the institution. We consider a lower dimensional number of factors (i.e, k < m). Thus, following (5), we express eachxi as:
xi=uiDV′+εi =fiV′+εi (6)
where ui = (ui,1, . . . , ui,k)′ is a k dimensional vector representing the i-th row of U, D is a
k×kdiagonal matrix, V is them×kmatrix of factor loadings andfi=uiDis the vector of
factor scores.
2.3. Network inference
Following the literature on latent space models, we consider a class of network models commonly referred to as inner-product models (see Durante and Dunson,2014;Hoff,2008). In this framework, we project the latent factors onto a “social space” and nodes that are “close” to each other are more likely to be connected. Let A be an n×n binary adjacency matrix whereAij =Aji = 1 indicates a link between nodes i and j, and zero otherwise. We parameterize theij-th entry of A via a probit mapping function given by
P(Aij = 1|fi, fj, θ) = πij = Φ(θ+f′
ifj) (7)
where πij is the probability of a link between nodes i and j, Φ is the cumulative density
function of the standard normal distribution, and θ is a constant. In estimating a network for a large number of nodes, a common approach is to approximate the network by a sparse structure. Following the literature on sparse graphical models, we set θ = Φ−1( 2
n−1). From
(7), we define a link between nodes iand j by
Aij = (πij > π0) (8)
Thus, nodei is connected to node j if and only if the probability of a link between the two nodes exceeds π0. The choice of the threshold π0 may be put in correspondence with the
proportions of the event of interest within the total sample.
3. Application
3.1. Data
Figure 1: Histogram of missing data
on SME commercial lending. Specifically, the analysis relies on a dataset composed of official financial information (44 balance sheets and income statement variables) on 813 SMEs, mostly based in Southern Europe, for the year 2015. To make data consistent between different European countries, financial data has been reclassified to minimize the differences based on different fiscal legislations. The majority of the companies included in the sample are Italian based enterprises with less than 20 employees and strong focus on manufacturing. The proportion of observed defaults in the sample is equal to 13.8%, a large proportion, in line with the observed impact of the recent financial and debt crisis in Europe and, specifically, in Southern European countries.
3.1.1. Data Pre-Processing
As it is the case with most studies, when collecting balance sheet data on companies, the required count or value for some variables are not available. Although this is a problem that arise in most empirical research relying on financial and non-financial data about economic agents, very rarely do authors stray from the complete cases analysis. This approach can be problematic as it considered inefficient and possibly leading to bias conclusions (Briggs et al.,2003). In line with this, in this paper we adapt the imputation method for generating replacements values for missing data which in turn allows for the use of the full number of observations.
In the context of the dataset used in this paper, missing variables are present for four main variables indicating the leverage and profitability condition of the SMEs. Figure 1 provides the histogram of missing data. Looking at the histogram in Figure 1 we observe that the four variables for which most NAs are present are: (i) the leverage ratio, (ii) the return on investment ratio, (iii) the return on equity ratio and (iv) the return on sales ratio. These represent some of the most crucial financial ratios determining the companies’ overall financial health which in turn impacts the probability of loan default.
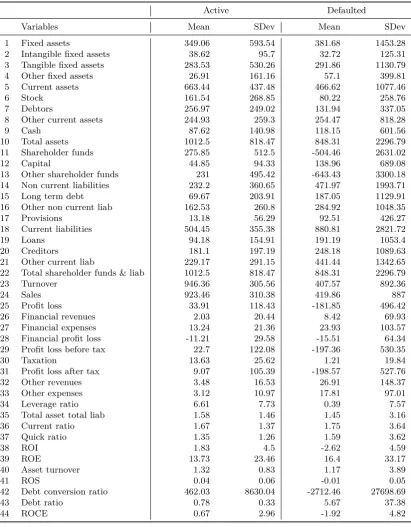
In the literature there has been an extensive discussion on when it is appropriate to use an imputation function rather than following the complete case approach. In most cases, the choice depends on two main elements: (i) whether the missing data mechanism is ignorable and (ii) whether the imputations contain information coming from outside the model used for predictions. In the context of this study, some negative implications from the use of the imputation function could arise. Specifically, the variance of the variables subjected to the imputation function may be reduced once the missing values are included which in turn could lead to bias estimates. However, we justify our choice by two main arguments. First, it is the view of the authors that the missing data mechanism is not ignorable as the variables with the highest NA count are crucial determinants of the probability of default hence the use of the complete case approach, could lead to bias estimates. Second, the imputations are based on information from outside the model which are relevant to the outcome and at the same time are not predicted by the other covariates. Table1 present a description and summary statistics of the variables in our sample.
3.2. Descriptive Modeling
The purpose of this subsection is to elaborate on the community formation identified in the context of SME-focused P2P lending platforms and investigate the systemic importance of SMEs and their potential influence on other companies within the network.
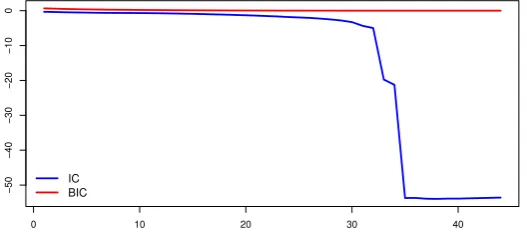
Following (Bai and Ng,2002), we estimate the number of factors,k, using the information criterion (IC) and the Bayesian information criterion (BIC). Specifically
IC(k) = ln(V(k,fˆk)) +k
m+n
mn
ln
mn
m+n
(9)
BIC(k) = V(k,fˆk) +kˆσ2
m+n−k
mn
ln(mn) (10)
where V(k,fˆk) = 1
m
m
X
i=1
ˆ
σi2, σˆi2= 1
nεˆ
′
iεˆi, σˆ2 =
1
mn
m
X
i=1
n
X
t=1
E(ˆεi)2
Given that our sample consists of 813 SME’s each with 44 variables, we set n = 813 and
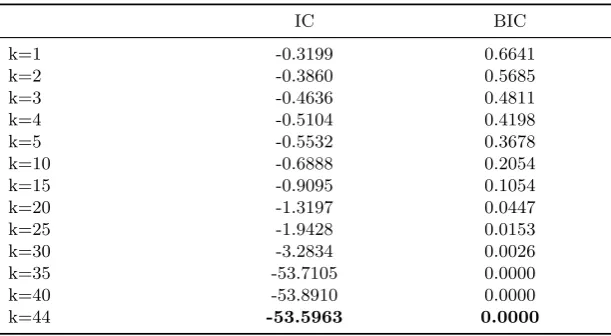
m = 44. Table 2 shows the IC and BIC for the different values of k ∈ {1,2, . . . ,44}. For convenience, only the results of a selected few is shown in the Table. Figure2presents the plot of the IC and the BIC, which clearly indicates that the both criteria favors higher dimensions ofk. Thus, k= 44 is selected based on the IC and BIC.
0 10 20 30 40
−50
−40
−30
−20
−10
0
[image:8.595.168.432.615.733.2]IC BIC
Figure 2: Plot of information criterion (IC) and the Bayesian information criterion (BIC) for the selection of
Active Defaulted
Variables Mean SDev Mean SDev
1 Fixed assets 349.06 593.54 381.68 1453.28
2 Intangible fixed assets 38.62 95.7 32.72 125.31
3 Tangible fixed assets 283.53 530.26 291.86 1130.79
4 Other fixed assets 26.91 161.16 57.1 399.81
5 Current assets 663.44 437.48 466.62 1077.46
6 Stock 161.54 268.85 80.22 258.76
7 Debtors 256.97 249.02 131.94 337.05
8 Other current assets 244.93 259.3 254.47 818.28
9 Cash 87.62 140.98 118.15 601.56
10 Total assets 1012.5 818.47 848.31 2296.79
11 Shareholder funds 275.85 512.5 -504.46 2631.02
12 Capital 44.85 94.33 138.96 689.08
13 Other shareholder funds 231 495.42 -643.43 3300.18
14 Non current liabilities 232.2 360.65 471.97 1993.71
15 Long term debt 69.67 203.91 187.05 1129.91
16 Other non current liab 162.53 260.8 284.92 1048.35
17 Provisions 13.18 56.29 92.51 426.27
18 Current liabilities 504.45 355.38 880.81 2821.72
19 Loans 94.18 154.91 191.19 1053.4
20 Creditors 181.1 197.19 248.18 1089.63
21 Other current liab 229.17 291.15 441.44 1342.65
22 Total shareholder funds & liab 1012.5 818.47 848.31 2296.79
23 Turnover 946.36 305.56 407.57 892.36
24 Sales 923.46 310.38 419.86 887
25 Profit loss 33.91 118.43 -181.85 496.42
26 Financial revenues 2.03 20.44 8.42 69.93
27 Financial expenses 13.24 21.36 23.93 103.57
28 Financial profit loss -11.21 29.58 -15.51 64.34
29 Profit loss before tax 22.7 122.08 -197.36 530.35
30 Taxation 13.63 25.62 1.21 19.84
31 Profit loss after tax 9.07 105.39 -198.57 527.76
32 Other revenues 3.48 16.53 26.91 148.37
33 Other expenses 3.12 10.97 17.81 97.01
34 Leverage ratio 6.61 7.73 0.39 7.57
35 Total asset total liab 1.58 1.46 1.45 3.16
36 Current ratio 1.67 1.37 1.75 3.64
37 Quick ratio 1.35 1.26 1.59 3.62
38 ROI 1.83 4.5 -2.62 4.59
39 ROE 13.73 23.46 16.4 33.17
40 Asset turnover 1.32 0.83 1.17 3.89
41 ROS 0.04 0.06 -0.01 0.05
42 Debt conversion ratio 462.03 8630.04 -2712.46 27698.69
43 Debt ratio 0.78 0.33 5.67 37.38
[image:9.595.98.510.179.707.2]44 ROCE 0.67 2.96 -1.92 4.82
IC BIC
k=1 -0.3199 0.6641
k=2 -0.3860 0.5685
k=3 -0.4636 0.4811
k=4 -0.5104 0.4198
k=5 -0.5532 0.3678
k=10 -0.6888 0.2054
k=15 -0.9095 0.1054
k=20 -1.3197 0.0447
k=25 -1.9428 0.0153
k=30 -3.2834 0.0026
k=35 -53.7105 0.0000
k=40 -53.8910 0.0000
[image:10.595.149.455.132.300.2]k=44 -53.5963 0.0000
Table 2: Comparing the information criterion (IC) and the Bayesian information criterion (BIC) for the
selection of the number of factors,k. Boldface values indicate the best choice for each metric.
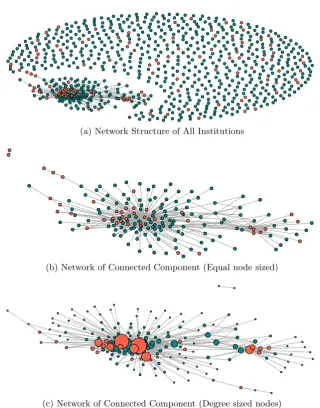
Using the SVD approach, we depict the network structure and the interconnections that emerge between companies participating in the P2P lending platform. In Figure 3, nodes are colored based on their status, with red indicating defaulted companies, and green active companies. The Figure contains two graphs: in Figure3b nodes are equal sized whereas in Figure 3c nodes are proportional to companies’ degree centrality. The choice of π0 is set
at 0.1 in correspondence with the proportions of defaulted companies in the overall sample. Although 0.1 is at a variance from 0.138 which is the precise proportion of defaulted companies in the sample, we use a round threshold as we found no significant difference between the number of links resulting from applying the two thresholds. Furthermore, we acknowledge that the proportion of defaulted companies within the sample is relatively high hence a more lenient approach to the process of link-inference could result in a more precise inference of the true network between the companies.
From the above graph the high interconnection that exists between active and defaulted SMEs is evident. The emergence of such linkages between companies provides evidence of the existence of joint unobservable forces linking P2P participants. From a credit risk viewpoint, if an active company is linked with a defaulted one, its credit scoring should decrease (contagion effect). Overall, network contagion seems to positively affect default, as the proportion of defaulted companies in Figure3is much larger than the observed proportion of defaults in the sample. Specifically, using the latent factor approach, in the community of connected nodes, 25% are companies which have defaulted which is significantly higher than the proportion of defaulted companies in the full sample which is 13.8%.
(a) Network Structure of All Institutions ● ● ● ● ● ● ● ● ● ● ● ● ● ● ● ● ● ● ● ● ● ● ● ● ● ● ● ● ● ● ● ● ● ● ● ● ● ● ● ● ● ● ● ● ● ● ● ● ● ● ● ● ● ● ● ● ● ● ● ● ● ● ● ● ● ● ● ● ● ● ● ● ● ● ● ● ● ● ● ● ● ● ● ● ● ● ● ● ● ● ● ● ● ● ● ● ● ● ● ● ● ● ● ● ● ● ● ● ● ● ● ● ● ● ● ● ● ● ● ● ● ● ● ● ● ● ● ● ● ● ● ● ● ● ● ● ● ● ● ● ● ● ● ● ● ● ● ● ● ● ● ● ● ● ● ● ● ● ● ● ● ● ● ● ● ● ● ● ● ● ● ● ●
(b) Network of Connected Component (Equal node sized)
● ● ● ● ● ● ● ● ● ● ● ● ● ● ● ● ● ● ● ● ● ● ● ● ● ● ● ● ● ● ● ● ● ● ● ● ● ● ● ● ● ● ● ● ● ● ● ● ● ● ● ● ● ● ● ● ● ● ● ● ● ● ● ● ● ● ● ● ● ● ● ● ● ● ● ● ● ● ● ● ● ● ● ● ● ● ● ● ● ● ● ● ● ● ● ● ● ● ● ● ● ● ● ● ●● ● ● ● ● ● ● ● ● ● ● ● ● ● ● ● ● ● ● ● ● ● ● ● ● ● ●
●
● ● ● ● ● ● ● ● ● ● ● ● ● ● ● ● ● ● ● ● ● ● ● ● ●●
● ● ● ● ● ● ● ● ● ● ●●
● [image:11.595.139.460.122.531.2](c) Network of Connected Component (Degree sized nodes)
Figure 3: Latent factor graph of participants in a P2P lending platform. (3a) shows both connected and
non-connected participants in a P2P system, (3b) shows the connected component with equal sized nodes, and
(3c) shows connected component where the size of nodes is proportional to their degrees. Nodes in green are
active whiles defaulted participants are represented in red.
3.3. Predictive modeling
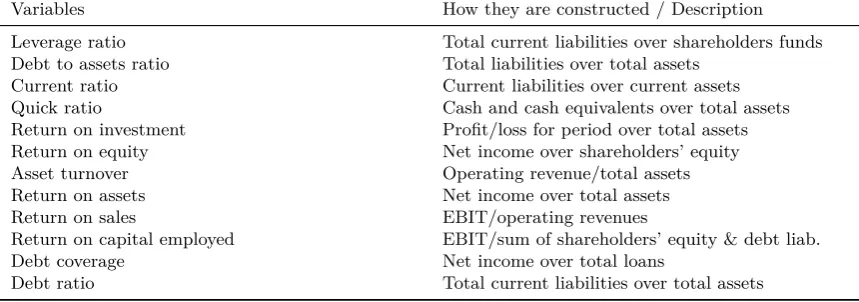
Variables How they are constructed / Description
Leverage ratio Total current liabilities over shareholders funds
Debt to assets ratio Total liabilities over total assets
Current ratio Current liabilities over current assets
Quick ratio Cash and cash equivalents over total assets
Return on investment Profit/loss for period over total assets
Return on equity Net income over shareholders’ equity
Asset turnover Operating revenue/total assets
Return on assets Net income over total assets
Return on sales EBIT/operating revenues
Return on capital employed EBIT/sum of shareholders’ equity & debt liab.
Debt coverage Net income over total loans
[image:12.595.86.516.138.289.2]Debt ratio Total current liabilities over total assets
Table 3: Explanatory variables included in the scoring models and how they are constructed.
Using the variables in Table3, we can specify and estimate the benchmark model employed in the credit scoring literature: the logistic regression model. Specifically, we estimate and compare three logit models: (i) full-sample scoring, (ii) scoring for connected nodes and (iii) scoring for not-connected nodes. We argue that because of P2P platforms’ universal and global banking model, higher predictive utility can be achieved by applying a latent factor-based classification technique which divides the population into major communities (connected vs. not-connected companies).
Table 4 presents the results from the full-sample model which does not control for the network structures that emerge on the bases of the latent variables. We remark that the model in Table 4 has been derived after a thorough activity of model selection, aimed at obtaining the best fit statistical model.
Variable Estimate P-value Significance
Intercept -2.61 0.000 ***
Leverage ratio -0.09 0.000 ***
Current ratio -1.96 0.005 **
Quick ratio 2.19 0.002 **
ROI -0.10 0.050
ROE 0.02 0.000 ***
ROS -6.68 0.146
Debt conversion ratio -0.04 0.054
Debt ratio 0.85 0.002 **
ROCE -0.23 0.004 **
AUROC 0.856
Table 4: Full-sample scoring – Sample size: 813 companies
[image:12.595.87.519.488.635.2]default. Potential explanation for the positive sign can be in the fact that worst-performing companies tend to have higher liquidity due to their inability to invest in profitable prospects. Moreover, in the context of ROE, the results suggest that increasing ability of companies to use equity for generating profits increase the probability of default. This may be due to the fact that the companies investigated within this analysis are small businesses which do not rely extensively on equity financing.
As the main purpose of the analysis is to investigate the predictive utility of scoring models, we fit the models on a training set to make predications on a data that was not trained, and we consider the classification errors resulting from the models, the corresponding ROC curve and, finally, the Area Under the ROC curve (AUROC), the most widely-used measure of predictive performance for credit scoring models. The AUROC, which theoretically ranges between 0 and 1, is equal to 0.856, for the considered full sample model. Although the value of AUROC equal to 0.856 can be considered sufficient, a need to increase the accuracy of the model is always encouraged. Even small increases in accuracy can lead to significant savings due to a superior predictive performance, as argued by West(2000).
As previously commented, to improve the credit scoring accuracy, we introduce a network-based scoring. Specifically, we use the logistic estimator for connected and not-connected communities separately. Table 5 summarizes the results obtained from the scoring model for connected nodes.
Variable Estimate P-value Significance
Intercept -2.26 0.002 **
Leverage ratio -0.05 0.187
Current ratio -3.29 0.024 *
Quick ratio 3.50 0.015 *
ROE 0.02 0.020 *
Debt ratio 0.86 0.059
ROCE -0.44 0.107
[image:13.595.85.518.400.513.2]AUROC 0.949
Table 5: Scoring for connected nodes – Sample size: 176 companies
Looking at the results for the connected nodes, similarly as it is the case with the full sample scoring, most of the variables are statistically significant and report the expected sign. ROCE remains insignificant potentially confirming the low-equity dependency of small businesses. Both the quick ratio and ROE keep the counterintuitive signs. We also note that in the context of connected companies, the liquidity ratios are among the main drivers which could be an indication of their exposure to contagion and systemic risk that in turn motivates them to keep higher liquidity.
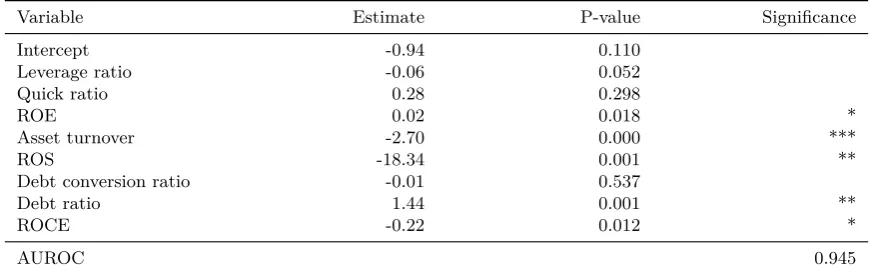
Variable Estimate P-value Significance
Intercept -0.94 0.110
Leverage ratio -0.06 0.052
Quick ratio 0.28 0.298
ROE 0.02 0.018 *
Asset turnover -2.70 0.000 ***
ROS -18.34 0.001 **
Debt conversion ratio -0.01 0.537
Debt ratio 1.44 0.001 **
ROCE -0.22 0.012 *
[image:14.595.83.519.134.271.2]AUROC 0.945
Table 6: Scoring for not-connected nodes – Sample size: 637 companies
Finally, we investigate the scoring model for not-connected companies. Table6summarizes the results. Looking at the results for the non-connected nodes, we see that most variables are found statistically significant except for the quick ratio and the debt conversion ratio. The AUROC reported is 0.945 which is like the predictive utility of the scoring model for the connected nodes. In the attempt to validate the results, robustness checking has been carrying out by changing theπ0 threshold. We have confirmed that the community detection approach
results in higher predictive utility relative to the full-sample scoring if the π0 threshold is
changed to 0.138, 0.2 and 0.3. Furthermore, another robustness check performed is that of random sub-sampling. Specifically, to confirm the validity of the results, we ran the same analysis considering many different random subsets. Specifically, we divided the sample of 813 companies on two random subsets (keeping the same proportion between connected and not-connected companies) and re-ran the analysis with several different seeds.
The average AUC for the random subsets with sample sizes equal to the connected and not connected communities are: 0.8618256 and 0.8555784, respectively. These predictive util-ities are significantly lower compared to those obtained by splitting the sample based on the SVD approach. We believe that these results are a clear indicator that a latent factor-based classification technique that divides the population into major communities based on the SVD approach does lead to the estimation of a more efficient logistic model, which in turn is crucial to improving credit risk measurement. The approach of identifying communities of connected and not-connected nodes, in a way, mimics the segmentation strategies em-ployed by traditional financial institutions which in turn allows P2P platforms to obtain high predictive accuracy of the scoring model without necessarily possessing all the financial and non-financial information about individual participants in the platform. Furthermore, the proposed methodology can also help traditional financial providers to improve their scoring by further "segmenting the segments".
4. Conclusions
This paper contributes to the recent development on P2P lending credit risk modeling in that it shows how scoring models can be improved, using the information that is auto-matically collected by P2P lenders, which typically connect borrowers, in a well-connected network of relationships and transactions. Such network structure extends beyond the clas-sical geographical and economic sectors. Information that can be embedded into financial network models, can capture non-linearities and endogenous factors that explain the spread of credit risk through the network.
The application of our proposed network-based scoring model demonstrates that the model is appealing, not only theoretically but also, from an operational point of view, as it increases predictive accuracy of the default, thereby better protecting lenders and improving financial stability. We believe that the main beneficiaries of our results may be regulators and super-visors, aimed at preserving financial stability, as well as investors of P2P platforms, whom should be protected against the negative sides of FinTech innovations (related with informa-tion asymmetries) while keeping their positive sides (related with the improvement of of data availability and processing).
Acknowledgments
Authors’ research is supported by funding from the European Union’s Horizon 2020 research and innovation programme under grant agreement No 825215 (Topic: ICT-35-2018 Type of action: CSA); and the US Air Force Office for Scientific Research (AFOSR), whose grant number is FA9550-12-1-0102.
References
Ahelegbey DF, Billio M, Casarin R. 2016a. Bayesian Graphical Models for Structural Vector Autoregressive
Processes. Journal of Applied Econometrics31: 357–386.
Ahelegbey DF, Billio M, Casarin R. 2016b. Sparse Graphical Vector Autoregression: A Bayesian Approach.
Annals of Economics and Statistics123/124: 333–361.
Andreeva G, Ansell J, Crook J. 2007. Modelling Profitability Using Survival Combination Scores. European
Journal of Operational Research183: 1537–1549.
Aste T, Di Matteo T, Hyde S. 2005. Complex Networks on Hyperbolic Surfaces. Physica A: Statistical
Mechanics and its Applications346: 20–26.
Aste T, Shaw W, Di Matteo T. 2010. Correlation Structure and Dynamics in Volatile Markets.New Journal
of Physics12: 085009.
Bai J, Ng S. 2002. Determining the Number of Factors in Approximate Factor Models. Econometrica 70:
191–221.
Barfuss W, Massara GP, Di Matteo T, Aste T. 2016. Parsimonious Modeling with Information Filtering
Networks. Physical Review E 94: 062306.
Barrios LJS, Andreeva G, Ansell J. 2014. Monetary and Relative Scorecards to Assess Profits in Consumer
Revolving Credit. Journal of the Operational Research Society65: 443–453.
Billio M, Getmansky M, Lo AW, Pelizzon L. 2012. Econometric Measures of Connectedness and Systemic Risk
in the Finance and Insurance Sectors. Journal of Financial Economics104: 535 – 559.
Briggs A, Clark T, Wolstenholme J, Clarke P. 2003. Missing.... Presumed at Random: Cost-analysis of
Incomplete Data. Health Economics12: 377–392.
Burton A, Billingham LJ, Bryan S. 2007. Cost-effectiveness in clinical trials: using multiple imputation to
deal with incomplete cost data. Clinical Trials4: 7.
Calabrese R, Giudici P. 2015. Estimating Bank Default with Generalized Extreme Value Regression Models.
Chinazzi M, Fagiolo G, Reyes JA, Schiavo S. 2013. Post-Mortem Examination of International Financial
Network. Journal of Economic Dynamics and Control37: 1692–1713.
Diebold F, Yilmaz K. 2014. On the Network Topology of Variance Decompositions: Measuring the
Connect-edness of Financial Firms. Journal of Econometrics 182: 119–134.
Durante D, Dunson DB. 2014. Nonparametric Bayes Dynamic Modelling of Relational Data.Biometrika101:
883–898.
Emekter R, Tu Y, Jirasakuldech B, Lu M. 2015. Evaluating Credit Risk and Loan Performance in Online
Peer-to-Peer (P2P) Lending. Applied Economics47: 54–70.
Giudici P, Hadji-Misheva B. 2017. Scoring Models for P2P Lending Platforms: A Network Approach. Working paper, University of Pavia.
Giudici P, Parisi L. 2017. Sovereign risk in the Euro area: a multivariate stochastic approach. Quantitative
Finance17: 1995–2018.
Giudici P, Parisi L. 2018. Credit risk contagion through correlation network models. Risks1.
Giudici P, Sarlin P, Spelta A. 2017. The interconnected nature of financial systems: direct and common
exposures. Journal of Banking and Finance.
Giudici P, Spelta A. 2016. Graphical Network Models for International Financial Flows.Journal of Business
& Economic Statistics34: 128–138.
Hoff PD. 2007. Model Averaging and Dimension Selection for the Singular Value Decomposition. Journal of
the American Statistical Association102: 674–685.
Hoff PD. 2008. Modeling Homophily and Stochastic Equivalence in Symmetric Relational Data. InAdvances
in Neural Information Processing Systems. 657–664.
Khan BS, Niazi MA. 2017. Network Community Detection: A Review and Visual Survey. Working paper, arXiv:1708.00977.
Letizia E, Lillo F. 2018. Corporate Payments Networks and Credit Risk Rating. Working paper,
https://arxiv.org/abs/1711.07677.
Mantegna RN. 1999. Hierarchical Structure in Financial Markets.The European Physical Journal B-Condensed
Matter and Complex Systems11: 193–197.
Massara GP, Di Matteo T, Aste T. 2016. Network Filtering for Big Data: Triangulated Maximally Filtered
Graph. Journal of complex Networks5: 161–178.
Milne A, Parboteeah P. 2016. The Business Models and Economics of Peer-to-Peer Lending. Technical report, Centre for European Policy Studies.
Minoiu C, Reyes JA. 2013. A Network Analysis of Global Banking: 1978–2010. Journal of Financial Stability
9: 168–184.
Musmeci N, Nicosia V, Aste T, Di Matteo T, Latora V. 2017. The Multiplex Dependency Structure of Financial
Markets. Complexity2017.
Pozzi F, Di Matteo T, Aste T. 2013. Spread of risk across financial markets: better to invest in the peripheries.
Scientific reports3: 1665.
Sarkar S, Dong A. 2011. Community Detection in Graphs using Singular Value Decomposition. Physical
Review E 83: 046114.
Serrano-Cinca C, Gutiérrez-Nieto B. 2016. The Use of Profit Scoring as an Alternative to Credit Scoring
Systems in Peer-to-Peer Lending. Decision Support Systems89: 113–122.
Tumminello M, Aste T, Di Matteo T, Mantegna RN. 2005. A Tool For Filtering Information In Complex
Systems. Proceedings of the National Academy of Sciences102: 10421–10426.
West D. 2000. Neural Network Credit Scoring Models.Computers & Operations Research27: 1131–1152.
Wilson RL, Sharda R. 1994. Bankruptcy Prediction Using Neural Networks. Decision Support Systems11: