Munich Personal RePEc Archive
Examining risk and return profiles of
renewable energy investment in
developing countries: The Case of the
Philippines
Saculsan, Phoebe and Kanamura, Takashi
December 2019
Online at
https://mpra.ub.uni-muenchen.de/97473/
Examining risk and return profiles of renewable energy investment in developing countries: The
Case of the Philippines
December 9, 2019
Phoebe Grace Saculsana,b*, Takashi Kanamura, PhD c
a Graduate School of Advanced Integrated Studies in Human Survivability (GSAIS), Kyoto University, Japan; b Graduate School of Global Environmental Studies (GSGES), Kyoto University, Japan
c Graduate School of Advanced Integrated Studies in Human Survivability (GSAIS), Kyoto University, Japan
Abstract
This paper examines the risk and return profiles of energy companies with renewable energy (RE) investment in developing countries taking the Philippines as our country case study. First, we analyze the impact of the global RE project specific risk and country risk on RE projects using a simple capital asset pricing model (CAPM) by benchmarking stock returns of these companies to either the global S&P (S&PGCE) index or to the local Philippine Stocks Exchange (PSE) index. Our findings show that on short- and mid- to long term investment interval, a “pure” RE company, the Energy Development Corporation (EDC), is affected by both these risks examined, while those with partial investment in renewables are affected only on the short-term. Next, we calculated these companies’ abnormal returns by using the Jensen’s alpha. Results show that EDC's alpha values are positive on all short- and medium-to-long term investments and on both indices, suggesting that Philippine RE companies are possibly underestimated on both the global RE market and the Philippine stock market. Lastly, we examined the latest Feed-in Tariff (FIT) level by using the beta results of EDC and the FIT structure of solar PV. Results show that the FIT rate generates profit to both the global and local RE companies’ risk and returns from the investors’
perspective, but is higher than the desired FIT rate from the policymakers’ perspective. This paper aids in investment
decision-making by showing that differences in investment timeframes and RE shares could impact investment outcomes in developing countries.
Keywords: renewable energy investment, capital asset pricing model (CAPM); developing countries, Philippines
1
1.
Introduction
Global consensus to tackle climate change to its roots is redirecting the countries to re-evaluate their economies to become more sustainable. As of September 2018, there are already 180 countries, comprising the 88.8% of the total GHG emissions, that ratified the Paris Agreement and pledged their own nationally determined contributions (NDCs)(IEA 2015). NDCs reflect a country’s national policy underlying the specific measures and targets the country pursues to reduce the global greenhouse gas (GHG) emissions (UNFCC website, accessed 16 July 2019). In this case, accelerating and scaling up the financing of clean energies will be among the main goals of a climate strategy given that the energy sector produces about 60% of these GHGs and at the same time taking note that total energy consumption is likely to increase by 48% in 2040 from 2012 (EIA 2016).
It therefore no surprise that the last decade has shown an increase in the number of countries that are developing their renewable energy potentials. More than 170 countries now have already set up their renewable energy targets and an estimated 150 countries have created policies that support renewables (KPMG 2016, 3). In terms of investments, developing countries like China, India and Brazil alone will have a 35% share of renewables globally (IRENA 2012, 15). This wont’t be surprising given that renewables are not only beneficial for the environmental but as well as a means to increase access to electricity to poor households and to complement the increasing demand for energy to these developing countries’s growing economy (KPMG 2016, 4).
But while developing countries can have a crucial role for the global transition towards clean energy like renewables in these countries are still challenged by the huge capital requirement to build renewables; the higher perceived risks associated with new ‘energy’ technologies; and the ‘unfamiliarity’ in assessing renewable energy projects (IRENA 2012). This is so since renewables remain to be immature and underdeveloped technologies in these countries. For instance, local investors and project developers are having hard time convincing communities even governments of accepting and of building renewable energy facilities into their lands mainly due to political reasons and lack of awareness about renewables (Saculsan & Mori 2018, 281; Marquardt 2017; Meller 2015). This lack of local acceptance could make or break a renewable energy project. Moreover, doing business in developing countries are made more difficult by the already weak infrastructure, the prevalent bureaucratic ‘red tape’ and corruption among others (IRENA 2012, 18). These limitations are drawbacks for renewables to fully maximize its potentiality as a clean energy alternative.
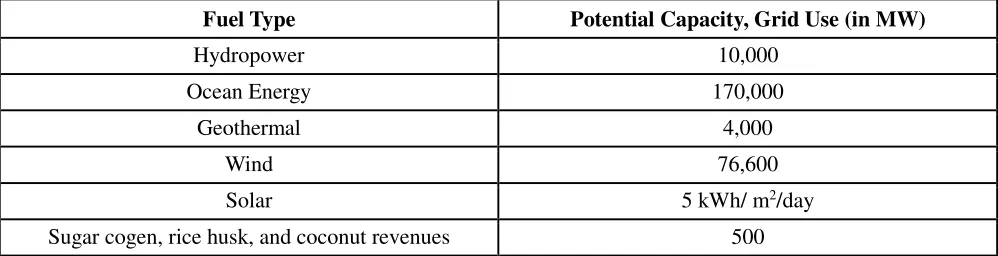
The above scenario reflects the current situation in the Philippines. As one of the fastest growing economies in Asia, the country is in a hurry to fill in its increasing demand for energy, which has pushed the government to approve the construction of new coal-fired power plants in the country, not renewable energies, since this assures a quick and stable energy supply compared (some intermittent) renewables. As a result, the last years have seen a decline of renewables to the energy mix, from 47% in 2000 to 24% in 2016 (DOE website, accessed 19 August 2019; SEPO 2014). Meanwhile, coal now accounts more than 50% share in the energy mix (Remo 2016). This is despite the relative abundance of renewable energy resources in the Philippines compared other countries.
Fuel Type Potential Capacity, Grid Use (in MW)
Hydropower 10,000
Ocean Energy 170,000
Geothermal 4,000
Wind 76,600
Solar 5 kWh/ m2/day
Sugar cogen, rice husk, and coconut revenues 500
[image:3.612.54.553.552.680.2]2
Given the challenges that could affect renewable energy investments in developing countries like the Philippines it is important in making investment decisions that the risks involved are properly evaluated and likewise compensated for. When undertaking investments, debtors and investors are keen into knowing an asset/project’s cost of capital or the asset/project’s risk and returns. Knowing the proper cost of capital also gives an effective tool to the policymakers so that they too can structure the incentive rates like the feed-in tariff (FIT) to ensure it bears the right balance between sufficient enough to attract investments but won’t be too high to burden taxpayers.
The cost of capital for small and medium-sized renewable energy companies in the Philippines mostly uses a higher percentage of own funding or equity finance given that banks are still unfamiliar with renewable energy projects and are reluctant to lend (Saculsan & Mori, 2018:280-281). With an immature capital market that cannot provide long-term finance and without a ‘ready and guaranteed’ power market for the output of renewables puts it at a disadvantage compared conventional energies like coal in the Philippines (KPMG 2013). In order to solve these issues, determining the risk and returns of equity finance for renewable energy projects in the Philippines will be the primary focus of this paper.
The paper is organized as follows: Section 2 provides the analytical framework to explain the significance and contribution of this paper to the literature of asset pricing, particularly renewable energy projects, in developing countries. Section 3 describes the data and methodology used for this paper zooming-in the profiles and characteristics of Philippine renewable energy companies. Section 4 presents the regression results and findings. Section 5 looks into the current FIT structure and comparing this with the new FIT structure using the generated betas as benchmarked to either the global renewable S&P GCE or the local PSE index. Section 6 concludes and summarizes the findings of this paper. Lastly, Section 7 discusses the limitations and possible future research regarding this topic.
2. Analytical Framework
In determining the cost of equity, the capital asset pricing model (or CAPM) is the basic and the most widely used finance methodology. CAPM is used for pricing stocks and gauging the extent to which markets are integrated (Treynor, 1961; Sharpe, 1964; Mossin, 1966). Central to CAPM is the calculation of an appropriate beta or systematic risk because this is the kind of risk that cannot be eliminated through diversifying the assets portfolio. This is also the reason why CAPM is also called the single-factor model for asset pricing because it purports that the return to an investment is a linear function of the beta. However, some empirical studies have challenged the validity and efficacy of CAPM given its underlying theoretical assumptions below:
i) investors are risk averse who are maximizing utility in the same time horizon; ii) investors are homogenous that no single investor can affect the price;
iii) investors can borrow or lend money at the risk-free rate of return; iv) assets are marketable and divisible;
v) there is information symmetry; and vi) no tax or transaction costs.
These assumptions beg the question if it can be applicable to the real world more so in developing countries’ conditions (Basu D & Chawla D, 2010: 210). May studies have already provided empirical studies showing that CAPM is not suitable and that beta alone is not sufficient to quantify the returns and risk variables of a still immature and volatile market that characterize most developing countries (Kolani & Vikpossi 2014, 18). These studies have also shown that developing countries are vastly different from those of developed markets in terms of risk, return, and liquidity patterns (Kolani & Vikpossi 2014, 18).
3
(1997) who founded no positive and significant relationship between risk and returns. When CAPM was tested in Taiwan in 1999 to evaluate eight different industries, Chiang and Doong (1999) see that risk-return relationship varies with the type of industry and that for the most part investors are penalized (not rewarded) for holding risky assets.
For our country reference, the Philippines, its literature are still sparse regarding asset pricing. Among those few like Bautista (2003) who conducted a study about the Philippine stock market concluded that the domestic market is not only sensitive to market volatility but also with the drastic changes in its domestic political and economic conditions. These findings is further validated by Ocampo (2003) who reported that the traditional CAPM approach proved a weak relationship between beta and return in the Philippine equity market by using monthly returns of stocks from 1992 to 2002. So far, CAPM has only been tested in the companies listed in the stocks exchange which are not necessarily renewable energy companies.
In general, Mobarek and Mollah (2005) concluded CAPM is not applicable a tool for the emerging Asian markets. There are many reasons why the model fails in developing countries, but a leading and logical candidate is the lack of market integration to the global market in some developing countries (Harvey 1995). Global market integration happens when a company’s stockholders hold globally diversified portfolios (Bodnar et. al, 2003), while its opposite – market segmentation – happens when a country’s stockholders investment is confined only to its own country. That is why according to Mishra and O’Brien (2005) the choice between the global and the market indexes makes a substantial difference in CAPM estimates in developing countries. In other words figuring the right cost of capital is also dependent on the choice of market portfolio whether it is a global or a local index.
Against this backdrop, the authors aim to fill in the gap in existing literatures where not so much are written to analyze the risk and return profiles of renewable energy companies/projects that are located in developing countries taking the Philippines as our country case study. The paper aims to provide empirical analysis on the impact of the global renewable energy project specific risk and country risk on renewable energy projects in the Philippines. CAPM is used to validate whether the beta is more closely aligned to global market index, S&P Global Clean Energy (S&PGCE) index, or to the local market, the Philippine Stocks Exchange (PSE) index. The generated beta is then tested for expected profitability through the Jensen’s alpha and is likewise substituted to the current Philippine Feed-in Tariff (FIT) structure of solar PV as a case. Doing so will aid both the renewable energy investors and policymakers in finding the appropriate cost of capital that could attract investments into the sector yet is fair to the consumers who will have to bear the additional cost.
3. Data and Methodology
3.1 Data samples
Th primary data for this paper is derived from the weekly and monthly average stock returns of companies listed in the Philippines Stocks Exchange (PSE) website (Accessed 01 August 2016). The selected companies are all classified under the group ‘Electricity, Energy, Power, and Water’. To be conservative and consistent in our research approach, the authors excluded on the list the companies that are not regularly traded and/or not listed in the above category even if they have or may have renewable energy investment. This is done because of the complexity and difficulty in fleshing out all the companies with renewables in their portfolio from the data at hand. For example, big conglomerates like San Miguel is categorized as a ‘Holdings Company’ in PSE but is actually the biggest energy company with some renewables in its energy portfolio. There are also renewable energy companies like Vivant that is not regularly traded in PSE. Overall, the authors came up with ten (10) companies that passed these 3 criteria: (i) classified as an energy company in he PSE listing; (ii) have a renewable energy investment; and (iii) are regularly traded.
4
business of ‘exploring, developing, operating, and utilizing geothermal and other indigenous renewable energy sources for electricity generation’ (EDC 2016). It is worth noting however that EDC is a subsidiary of the Lopez -group First Philippine Holdings (FPH) through its First Gen Group (FGEN) having an effective 50.6 percent economic interest and a 67.1 percent voting interest in EDC.
Company Code Brief Description RE Investment
Energy Development Corporation
EDC primarily renewables company with almost equal investment shares between PH and other countries
geothermal, wind, solar and hydropower *EDC is part of the First Gen Corporation (“First
Gen”) Group
First Gen Corporation FGEN natural gas but owns 40% indirect economic interest of EDC
the largest clean and RE IPP in the country; wind, solar , hydropower and geothermal First Philippine Holdings
Corporation
FPH major investments in power generation, real estate development, manufacturing, and construction and
other services.
about 1,459.6 MW of wind, solar, and hydropower, with shares on EDC and FGEN *mostly just partnerships or indirectly through its subsidiaries
Aboitiz Power Corporation AP power distribution and generation geothermal, large hydro and run-of-river hydro Alsons Consolidated Resources,
Inc.
ACR investment holding company, and oil and coal exploration
Hydropower *mostly in Mindanao
PetroEnergy Resources Corporation
PERC oil exploration and development and mining activities
solar and wind
Phinma Energy Corporation PHEN oil, gas wind and geothermal Basic Energy Corporation BSC primary an investment holding
company; oil and gas exploration; eco farms
geothermal and biofuels
Petron Corporation PCOR
refining of crude oil and the marketing and distribution of refined
petroleum products including gasoline, LPG, diesel, jet fuel,
kerosene, asphalts and petrochemicals.
Hydropower
*mostly engaged in refinery investments abroad
Manila Electric Company MER Coal hydroelectric through a joint venture
*mostly, if not all are coal
Table 2 Profile of Listed Energy Companies with Renewables in their Energy Portfolio. This is a brief profile of each of the selected companies in the Philippines highlighting renewables in their investment portfolio. The information is taken from these companies’ financial reports and their respective company websites. Renewable energy companies under study as listed and classified under the “Electricity, Energy, Power, and Water” category in the Philippine Stocks Exchange (PSE) website. Additional information about the company weregathered from company reports.
The monthly average data, which we pertain as the mid- to long-term investment interval, is from 01 August 2016 to 31 July 2017. The weekly average data or the short-term investment interval, on the other hand, is from 01 August 2016 to 11 August 2017. The difference in timeframe is due to the availability of S&P GCE data on renewable energy returns globally. Also, renewable energy (except large geothermal) is relatively at the early stage of development in the Philippines. The renewable energy law was only passed in 2008 while incentives to promote renewables like FIT was only accomplished 4 years after in 2012.
3.2 Methodology
The averages of the stock returns of these companies are benchmarked using either of these two index: (i) the S&P Global Clean Energy index (here referred to as S&P GCE) or the (ii) the local Philippine Stocks Exchange (here referred to as PSE) index.
[image:6.612.53.556.118.421.2]5
energy specifically in renewable energy projects1. Aside from this, the S&P GCE index was also chosen because of the ease of access and availability of data online. These renewable project specific risks (eg. grid risk, technological risks, policy risks, credit risk) are specifically identified to be the risks commonly faced by investors when investing in renewable energy projects worldwide (Lee 2014). On the other hand, the PSE is chosen to represent the country risk vis-à-vis Philippine local conditions because this is the national and the only stock exchange in the Philippines with about 261 listed companies as of September 2014 (pse.com.ph website, accessed 31 July 2017). These country risks (e.g. political risk, economic risk) refers to the risks associated when investing in a particular country, in this case, the Philippines (Investopedia. country risk, 5 August 2019).
For the calculation of beta, the authors made use of a simple linear regression in Excel, which indicates the relative risk of a renewable energy company versus a benchmark market (ie., global S&P GCE or local PSE index) over a period as shown in the formula:
Regress ri on rm (1)
= the slope of the regression estimate
r
i= one of the companies’ average weekly or monthly stock pricesr
m = market portfolio index (eg., S&P GCE or PSE index) average weekly or monthly stock returnsFurthermore, the companies’ Jensen’s Alpha (or simply ‘ɑ
’
) is included to measure the average return of a portfolio or investment above or below the predicted returns under the CAPM methodology (Investopedia. Jensen's Measure, accessed 05 August 2019). Simply put, this is the excess market returns of an investment. The value of the alpha is shown as the intercept of the regression estimate of the CAPM. It can also be computed manually using the equation below:ɑ = rs - [ rf + β ( rb– rf) ] (2)
ɑ
= Jensen’s alpha
rs= the average sum total of a company’s average weekly or monthly stock prices rf = risk free rate
= the computed beta based on either of the two indices mentioned;
rb = the average sum total (either S&P GCE or PSE index) average weekly or monthly returns
We also looked into the t-stat value and standard error to check for the statistical significance of the results. In this case, a greater than absolute value of 2 means the computed value is statistically significant.
Secondary and extensive literature review are also done to complement the primary data when analyzing and making the comparisons. Publicly available data on FIT regulations, for example, as issued by the Philippine Department of Energy (DOE) and Energy Regulatory Commission (ERC) are used.
At last take note that although many scholars have proposed alternative methodologies to fill in this weakness of CAPM to account for the risks that is not captured by the beta of the CAPM (eg., Arbitrage Pricing Theory (APT) of Ross (1976); the Multi-Factor Model of Fama and French (1996); the Downside or D-CAPM of Estrada (2002), and the Global CAPM of Damodaran (1999), among others, this paper does not intend to propose any alternatives to CAPM because of data limitation of the country reference study, the Philippines.
6
4. Empirical Study Results and Discussions
4.1 Examining the beta (risk) in terms of the global renewable S&P GCE and the local PSE over the short-term and mid-to-long short-term investment intervals
First, we analyzed the regression results of generated betas from the weekly average stock returns, which represent the short-term investment interval, given in Table 3. The results have adjusted R-square higher than 90% for all companies except AP and MER in cases when these companies are benchmarked to either the global S&PGCE index or the local PSE index. The adjusted R-square indicates the percentage by which the dependent variable (i.e., company’s stock returns) can be predicted or explained by the independent variable (i.e., index’s stock returns). In this case, 90% of the movement in the stock returns are predicted or explained by the movement in the benchmark index used.
In terms of beta results, whether benchmarked to the global renewables S&PGCE or the local PSE, all companies generated positive and statistically significant betas close to 1. This entail that all companies stock prices and thereby their risks can be predicted by the movement in both the global renewables market and the Philippine local market.
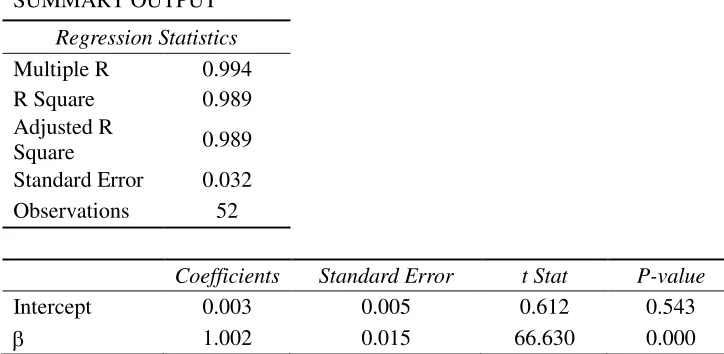
Now zooming in the regression results of our proxy to a ‘pure’ renewable energy company, EDC, as shown in Tables 4 & 5, EDC’s beta results are almost similar when benchmarked to both indices although a bit closer to 1 when data is benchmarked to the global renewables S&PGCE index. These beta results as well as the models itself are both statistically significant with less than 5% error of beta. Also, the two models’ adjusted R-square is around 98% indicating that the stock returns for short-term investment could be predicted by the movement in both of the two index used.
Thus, looking at a short-term investment interval, we see that energy companies with renewable energy investment are strongly affected by both global renewable energy project specific risk (represented by the S&P GCE index) and the country risk (represented by the PSE index).
Company -S&P
Standard Error of Beta
Adj. R2
Standard Error of the
Model
Company -PSE
Standard Error of Beta
Adj. R2
Standard Error of the
Model
EDC 1.002 0.015 0.989 0.032 EDC 1.003 0.015 0.989 0.032
FGEN 0.992 0.016 0.986 0.035 FGEN 0.994 0.016 0.987 0.033
FPH 1.000 0.028 0.961 0.060 FPH 0.999 0.029 0.958 0.062
AP 0.776 0.088 0.599 0.188 AP 0.774 0.089 0.595 0.189
ACR 0.993 0.036 0.938 0.076 ACR 0.993 0.036 0.937 0.077
PHEN 0.993 0.011 0.993 0.024 PHEN 0.994 0.011 0.994 0.023
PERC 1.013 0.029 0.960 0.062 PERC 1.012 0.030 0.957 0.064
BSC 0.999 0.032 0.952 0.067 BSC 1.000 0.032 0.951 0.067
MER 1.010 0.104 0.647 0.221 MER 1.015 0.103 0.651 0.220
[image:8.612.52.552.449.592.2]PCOR 0.995 0.016 0.986 0.035 PCOR 0.996 0.015 0.988 0.032
7
SUMMARY OUTPUTRegression Statistics Multiple R 0.994
R Square 0.989
Adjusted R
Square 0.989
Standard Error 0.032 Observations 52
Coefficients Standard Error t Stat P-value
Intercept 0.003 0.005 0.612 0.543
1.002 0.015 66.630 0.000
Table 4. Proxy Renewable Energy Company Regression Results (Global S&P-Weekly). When data is benchmarked to the global S&PGCE index on short-term investment interval, EDC’s beta results show a positive and statistically significant beta closest to 1. Also, the adjusted R-square is pegged at 99% indicating that EDC’s weekly stock returns are aligned and predicted by the market movement of renewables worldwide.
SUMMARY OUTPUT
Regression Statistics Multiple R 0.995
R Square 0.989
Adjusted R
Square 0.989
Standard Error 0.032 Observations 52
Coefficients Standard Error t Stat P-value
Intercept 0.004 0.005 0.778 0.440
1.003 0.015 67.417 0.000
Table 5. Proxy Renewable Energy Company Regression Results (Local PSE-Weekly). Identical with the
previous result, EDC’s beta results show a positive and statistically significant beta also close to 1 when stock returns on a short-term duration are benchmarked to the local PSE. Also, the adjusted R-square is pegged at 99% indicating that EDC’s weekly stock returns are aligned and predicted by the movement within the local Philippine market.
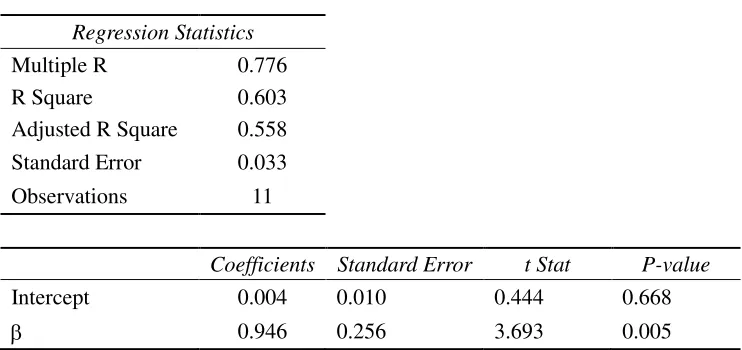
Next in Table 6, we analyzed each company’s monthly average stock returns to represent the mid- to long-term investment interval. When benchmarked to the global renewables S&P GCE index, beta results are more variable and have larger gaps from one company to another. Among these companies, only EDC and ACR have betas close to 1 although EDC alone is statistically significant. These results are also similar even when the stock returns were benchmarked to the local PSE index, only this time EDC and PERC have betas close to 1 and EDC alone is statistically significant.
[image:9.612.50.412.63.240.2]8
PSE respectively, as shown in Tables 7 and 8. This suggest that the variability in the stock returns could only be ‘partially’ explained by the movement in these benchmark markets on a mid- to long- term investment interval.
Overall, the results imply that on both short and mid- to long-term investment intervals, EDC is the only renewable energy company that is affected by both the global renewable energy project specific risk and country risk. Meanwhile, energy companies with partial investment in renewables tend to work as defensive assets to market portfolio, which are affected by these two risks for the short-term investment interval only but not for the mid- to long-term investment interval. This implies that when investing in the renewable energy projects in developing countries, it is important to examine in advance how much the renewable energy projects’ share in the prospect companies from the viewpoint of renewable energy project specific risk and country risk.
Table 6. Beta Result using Monthly Average Stock Returns. Data on monthly average or the mid- to long-term investment interval only has 11 observations covering one-year period from August 2016 to August 2017. The authors wish to expand the data timeframe in the future researches when data becomes available. When each company’s monthly average stock returns are benchmarked to the global S&PGCE index, beta results are shown to be more variable and have larger gaps from one company to another. Among these companies, only EDC and ACR have betas close to 1 although EDC alone is statistically significant. These results are also similar even when the stock returns were benchmarked to the local PSE index. This time EDC and PERC have betas close to 1 although EDC alone is statistically significant.
SUMMARY OUTPUT
Regression Statistics
Multiple R 0.776
R Square 0.603
Adjusted R Square 0.558
Standard Error 0.033
Observations 11
Coefficients Standard Error t Stat P-value
Intercept 0.004 0.010 0.444 0.668
[image:10.612.81.528.219.343.2] 0.946 0.256 3.693 0.005
Table 7. Proxy Renewable Energy Company Regression Results (Global S&P-Monthly). EDC’s adjusted R -squares is at 55% when benchmarked to the global S&PGCE, suggesting that on a mid- to long-term investment interval the variability in the stock returns could only be partially explained by the movement of renewable energy market worldwide. Beta result, on the other, is positive and statistically significant.
Company -PSE
Standard Error of Beta Adj. R2 Standard Error of the Model
EDC 0.853 0.337 0.352 0.040
FGEN 0.069 0.234 -0.101 0.028
FPH 0.126 0.287 -0.088 0.034
AP 0.188 0.171 0.021 0.020
ACR 1.918 0.450 0.632 0.054
PHEN 0.470 0.388 0.044 0.047
PERC 0.847 0.905 -0.013 0.108
BSC 0.542 0.939 -0.071 0.112
MER -0.415 1.203 -0.097 0.144
PCOR 0.711 0.531 0.073 0.064
Company -S&P
Standard Error of Beta Adj. R2 Standard Error of the
Model
EDC 0.946 0.256 0.558 0.033
FGEN 0.277 0.196 0.091 0.025
FPH 0.301 0.248 0.045 0.032
AP 0.314 0.131 0.322 0.017
ACR 1.0396 0.633 0.145 0.082
PHEN 0.529 0.344 0.121 0.045
PERC 0.669 0.845 -0.039 0.120
BSC 1.324 0.764 0.167 0.099
MER -0.939 1.073 -0.024 0.139
[image:10.612.51.422.492.667.2]9
SUMMARY OUTPUTRegression Statistics
Multiple R 0.645
R Square 0.416
Adjusted R Square 0.352
Standard Error 0.040
Observations 11
Coefficients Standard Error t Stat P-value
Intercept 0.001 0.012 0.091 0.929
0.853 0.336 2.534 0.032
Table 8. Proxy Renewable Energy Company Regression Results (Local PSE-Monthly). EDC’s adjusted R -squares is at 35% when benchmarked to the local PSE, suggesting a weak correlation between the stock movement of EDC with the local Philippine market on a mid- to long-term investment interval. Beta result, however, remains positive and statistically significant.
4.2 Examining renewable companies’ profitability thru the Jensen’s alpha
We then computed for the Jensen’s alpha based on the CAPM regression estimate (see Table 9). Jensen’s alpha () is a measure of profitability, or the average return of a portfolio or investment above or below the predicted returns under the CAPM methodology (Investopedia website on Jensen's Measure. Accessed 5 August 2019). Put simply, this is the investment’s excess returns relative the returns predicted by CAPM. When comparing, we determine the ‘profitable’ companies based on which has (greater) positive or (lesser) negative alpha values.
Company Name Mid- to Long-Term Short-Term
S&PGCE PSE S&PGCE PSE
EDC 0.004* 0.001 0.003 0.004*
FGEN -0.026 -0.027 -0.005 -0.005
FPH -0.003 -0.004 0.001 0.002*
AP -0.012** -0.014** -0.025 -0.025
ACR -0.016 -0.02 -0.005 -0.004
PERC 0.064 0.061 0.014 0.015*
PHEN -0.013 -0.015 -0.005 -0.004
BSC 0.027* 0.022 0.001* 0.001*
PCOR -0.009 -0.01 -0.003 -0.003
MER -0.008 -0.005 0.014 0.015*
Table 9. Jensen’s Alpha Results. Jensen’s Alpha (or simply “
𝛼
”) is computed to measure the average return of a [image:11.612.50.415.98.272.2] [image:11.612.56.555.460.664.2]10
On a short-term investment interval, more companies are likely to more profitable when their beta is benchmarked to the local PSE index. These include companies such as EDC, FPH, ACR, PERC, PHEN, BCS, and MER. Among these companies only EDC, FPH, PERC, BSC, and MER have positive alpha values although none of which are statistically significant. The result is opposite on a mid- to long- term investment where all of these companies with the exception of only MER are likely to be more profitable if their beta is benchmarked to the global S&PGCE than otherwise. Two companies, EDC and BSC, have positive alpha values although both not statistically significant. On the other hand, AP has negative alpha value but is statistically significant.
The results show that on a short-term investment interval, renewable energy companies are more profitable to the national market portfolio than to the global renewable energy market portfolio. While on a mid- to long-term investment interval, Philippine renewable energy companies are more profitable to the global renewable market portfolio than the national stock market portfolio. Taking into account this information can help investors make their investment strategies such that different time intervals could provide profitable returns to renewable investments. More importantly, EDC's alpha value is positive for both short- and medium-to-long term investments and both S&PGCE and PSE indices. It shows that Philippine renewable energy companies are possibly underestimated in both the global renewable energy market and the Philippine stock market.
5. Evaluating the Incentive for Renewable Energy Investment through FIT
In the Philippines, the cost of equity is one of the basis in providing the incentives for renewable energy investment. For most countries including the Philippines this incentive is usually in the form of a Feed-in Tariff (FIT). FIT refers to a long-term guaranteed payment, typically with rate higher than the conventional energy, calculated per KwH of energy produced from renewables. It is considered the most popular renewable energy incentive around the world with 75 countries and 29 states or provinces implementing this as means to promote and attract the investment to renewable energy technologies (REN 21 2017). Knowing the appropriate FIT rate from the calculated beta through CAPM could help policymakers decide the FIT rate at the level that is sufficient to boost investments in the sector while ensuring fairness to the taxpayers who will have to shoulder the cost.
FIT calculation in the Philippines basically follows the renewable energy technology market-based Weighted Cost of Capital (WACC) to determine return on invested capital, given in the following equation (Philippine Department of Energy):
WACC = [ ri x E] + { rd x D/ V] (3)
where,
ri =cost of equity rd = cost of debt
11
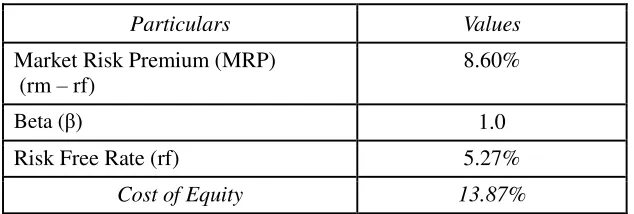
Particulars Values
Market Risk Premium (MRP) (rm – rf)
8.60%
Beta (β) 1.0
Risk Free Rate (rf) 5.27%
[image:13.612.119.436.55.162.2]Cost of Equity 13.87%
Table 10. Breakdown of Solar PV Equity Rate. To evaluate the FIT incentive, we are taking the FIT incentive structure for solar PV as a case
Since debt is pretty much guaranteed and thus less risky, it is not so much as tricky as the determination of the cost of equity where more risks are involved. The complexities of these risks and assigning each the appropriate values are matters altogether that gives the evaluators the headaches. Also, from the perspectives of investors and project developers who are after profits and even the government who is trying to strike the balance between luring investments into the renewable energy sector yet would not compromise the public’s coffer, knowing the appropriate cost of equity could help create a strategy that is beneficial for each if not for everyone, thus, we are focusing here on the evaluation of the cost of equity (IRR) in the calculation of FIT. As mentioned previously, the CAPM evaluates the cost of equity through the following equation:
ri = rf + β (rm - rf) (4)
where,
ri = cost of equity rf = risk-free rate
β = beta or the systematic risk-free rm = expected market returns rm – rf = market premiums
The MRP follows the Total Risk Premium (TRP) and is set at 8.60%. The TRP equals the estimated Default Spread of 190 basis points plus the historical risk premium for a mature equity market (estimated from historical US data). Because most of the renewable energy companies in the Philippines are still not listed in the Philippine stocks exchange market, MRP estimate of renewable energy investment relies on a sophisticated capital market of a developed country such as the U.S. The 5.27% risk-free rate (rf), on the other hand, was benchmarked on the daily average of Philippine Dealing System Treasury Fixing (PDST -F) rates for the CY 2014 as published by Philippine Dealing and Exchange Corporation (PDEx) in its official website (Accessed 19 August 2019). Lastly, the beta of 1.0 is estimated from the levered and re-levered betas of listed comparable companies from Bloomberg database.
12
Particulars Cost of Equity
(viz. FIT)
Cost of Equity- EDC- S&P
Cost of Equity- EDC- PSE
Market Risk Premium
(MRP)(rm – rf)
8.60% 8.60%
8.40%**
8.60% 8.40%**
Beta (β) 1.00 0.9462 (monthly)
1.0017 (weekly)
0.8527 (monthly) 1.0028 (weekly)
Risk Free Rate (rf) 5.27%
1.32% (weekly)
5.27% 1.32% (weekly)
5.27% 1.32% (weekly)
Cost of Equity/FIT 13.87%(monthly) 9.92%(weekly)
13.41% (monthly) 9.93% (weekly)
12.60% (monthly) 9.94%(weekly)
Cost of Equity/FIT** N/A 13.22% (monthly)
9.73% (weekly)
[image:14.612.51.552.56.238.2]12.43%(monthly) 9.74%(weekly)
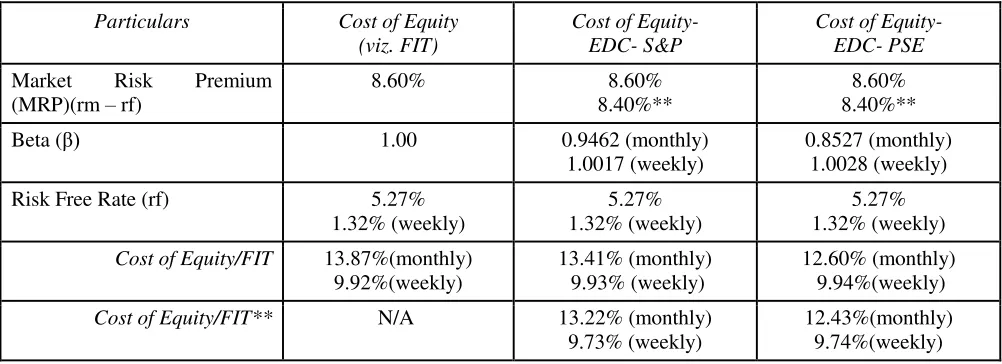
Table 11. Cost of Equity/FIT Structure from Generated Betas. Result of recalculated cost of equity as derived from the FIT structure for solar PV using the beta results from EDC as proxy for all renewable energy companies/projects in the Philippines. Note that the current Cost of Equity/FIT level is greater than the computed Cost of Equity/FIT with ** from the new generated betas.
In the first analysis, the cost of equity computed from the generated betas on the mid- to long-term investment duration is lower than current FIT rate. The lowest FIT rate generated is at 12.60% when beta is benchmarked to the local PSE index. However, using generated betas on short-term investment interval resulted to a slightly higher cost of equity at 9.93% (S&PGCE) and 9.94% (PSE) respectively compared with only 9.92% when beta was 1 at current FIT rate.
In the second analysis, the market premium was set at 8.40%. Similar to previous results were found. The equity cost of equity is lower on both cases: when beta was benchmarked to the global renewable S&PGCE on mid- to long-term investment interval, and when beta was benchmarked to the local PSE on short-term investment interval.
In general, the current cost of equity/FIT rate is shown to be greater than the computed rates when benchmarked to either S&PGCE or PSE. This implies that the latest FIT level generates profit for both the perspectives of the Philippine renewable energy companies’ risk and returns and the global renewable energy companies’ risk and returns. This is particularly highlighted more in a mid- to long-term perspective for Philippine companies’ risk and returns. Although these results sound good for the investors who are after profits, this signals that policymakers may have to adjust the current FIT rate to reflect the lower cost of equity that is necessary to attract investments in the renewables sector. FIT are basically funded from taxpayers who are now burdened to pay more for the development of renewables in the Philippines.
6. Summary and Conclusions
13
First, the authors examine the impact of the global project specific risk and country risk to the Philippine energy companies/projects through the simple Capital Asset Pricing Model (or CAPM). Of the 10 companies under study, a ‘pure’ renewable energy company, Energy Development Corporation (EDC), is taken as a focus of analysis. We specifically explored the calculation of the beta () through CAPM by employing a simple linear regression in Excel of each company’s stock returns benchmarked to a market index, which is either the global renewables S&P Global Clean Energy (S&PGCE) or the local Philippine Stocks Exchange (PSE). The S&PGCE market index represents the project specific risks in investing to renewables worldwide while the PSE market index represent the risks confined only to local conditions. Weekly and monthly average returns data from August 2016 to August 2017 were used to represent short and mid- to long-term investment intervals, respectively. Beta results shows that on a short-term investment interval, all energy companies with renewable energy investment are strongly affected by both the global renewable energy project specific risk and country risk. However, for a mid- to long-term investment interval, EDC is the only renewable energy company that is affected by these two risks as this it is the only company that has statistically significant close to 1 beta results. Meanwhile, energy companies with partial investment in renewables tend to work as defensive assets to market portfolio, which are not affected by both risks. It implies that to invest in renewable energy projects in emerging economies, it is important to examine in advance how much is the renewable energy project’s share in the prospect company from the viewpoint of renewable energy project specific risk and country risk.
Next, EDC's abnormal returns, as derived from Jensen’s alpha calculation, is shown positive for both short- and medium-to-long term investments whether benchmarked to S&PGCE index or PSE index. This shows that Philippine renewable energy companies’ expected returns are possibly underestimated in both the global renewable energy market and the Philippine stock market.
Lastly, we use the beta results of EDC as proxy to determine the incentive for investing in renewables in the form of the Feed-in Tariff (FIT), using the rate structure of solar PV as a case study. The result shows that the latest FIT rate is greater than the FIT rate computed from the generated betas. This implies that the latest FIT level generates profit for both the perspectives of the global renewable energy market and the Philippine companies’ risk and returns. This gap is highlighted more in a mid- to long-term perspective for Philippine companies’ risk and returns. Although this may sound good for the investors who are after profits, this signals that policymakers may have to adjust the current FIT rate to reflect the lower cost of equity so as not to burden the taxpayers who have to pay more for the development of renewables in the country.
7. Limitations and possible future study
While, overall, the paper provided a rich analysis of the use of CAPM in evaluating the renewable energy investment and incentive of a developing country like the Philippines, the authors recognize that the study was limited in scope. Due to data availability, we are only able to include 10 companies with only 1 company that is truly a ‘pure’ renewable energy company while the remaining others have only partial if not very little investments to renewables. Also, due to the relative early development of renewables in the Philippines, the timeframe is only limited to 1 year. In which case the small samples and short observation period may lead to some measurement errors.
14
strong foreign impacts in much greater measure than their counterparts in developed countries and that most of the companies listed in the stocks are controlled by a monopoly of family groups or few shareholders.
Despite its weakness, the analysis presented in this paper add to the still few literatures on asset valuation of renewables in developing countries. At the same time the paper raises many issues and questions we can explore and further elaborate like, perhaps, expanding the CAPM to tailor fit the conditions of a developing country. As the first study in the Philippines that has, so far, utilize the tools of CAPM to analyze its renewable energy investment, the authors hope that there will be succeeding future studies of the same topic.
References
Ali, M. H., Islam, S. and Chowdhury, M. M., 2010. “Test of CAPM in Emerging Stock Markets: A study on Dhaka Stock Exchange”. The Cost and Management, November- December, pp. 34 – 37.
Basu, Debarati & Deepak, Chawla. 2010. “An Empirical Test of CAPM—The Case of Indian Stock Market”. Global Business Review 11:2 (2010): 209–220. DOI: 10.1177/097215091001100206
Bautista, C. C. 2003. “Stock market volatility in the Philippines”. Applied Economics Letters, 325-318. https://doi.org/10.1080/13504850210148107
Chiang, Thomas C., and Shuh-Chyi Doong. 2001. “Empirical Analysis of Stock Returns and Volatilities: Evidence from Seven Asian Stock Markets Based on TAR-GARCH Model”. Review of Quantitative Finance and Accounting 17: 301–18.
Damodaran, Aswath. 2012. “Equity risk premiums (ERP): Determinants, estimation and implications – The 2012 Edition”. Working paper, New York University. http://dx.doi.org/10.2139/ssrn.2027211
Damodaran, Aswath. 2017. “Equity Risk Premium by Country - January 2017”. New York: University of New York -Stern School of Business.
Delos Santos, Angelica. n.d. “Renewable Energy in the Philippines”. Accessed 20 August 2019. https://www.irena.org/eventdocs/Philippines%20presentation.pdf
Energy Regulatory Commission (ERC). 2014. A Resolution Approving the Feed-in Tariff Rates (FiT) as Necessitated by the New Installation Target for Solar Energy Generation Set by the Department of Energy (DOE). Pasig City. Accessed 20 August 2019. https://www.erc.gov.ph/ContentPage/475
Energy Development Corporation (EDC). 2016. “Energy Development Corporation (EDC) Annual Financial Report 2016”. Pasig: Securities and Exchange Commission. Accessed 23 August 2018. https://www.energy.com.ph/wp-content/uploads/2017/05/EDC-PR-2016_FINAL-063017.pdf
Energy Development Corporation (EDC). n.d. Company Profile. Accessed 23 August 2017. https://www.energy.com.ph/about-us/
Energy Information Administration (EIA). 2016. “International Energy Outlook 2016”. Accessed 5 July 2016. U.S Energy Information Administration. https://www.eia.gov/outlooks/ieo/pdf/0484(2016).pdf
Estrada, Javier. 2002. “Systematic risk in emerging markets: The D-CAPM”. Emerging Markets Review, 365-379. DOI: 10.1016/S1566-0141(02)00042-0
15
Kolani Pamane & Anani Ekoue Vikpossi. 2014. “An Analysis of the Relationship between Risk and Expected Return in the BRVM Stock Exchange: Test of the CAPM”. Research in World Economy Vol. 5, Issue 1; 2014. DOI:10.5430/rwe.v5n1p13.
KPMG. 2016. Global Trends in Renewable Energy. Accessed 5 June 2019.
https://home.kpmg/content/dam/kpmg/sg/pdf/2016/11/Global-Trends-in-Renewable-Energy.pdf
KPMG. 2016. “Renewable Energy Management Bureau, DOE, NREB Presentation on RA 9513 to the ENERCOM” in The Energy Report: Philippines. Growth and Opportunities in the Philippine Electric Power Sector. Accessed 5 June 2019. https://home.kpmg/content/dam/kpmg/sg/pdf/2016/11/Global-Trends-in-Renewable-Energy.pdf
KPMG Global Energy Institute. 2013. “The Energy Report: Philippines. Growth and Opportunities in the Philippine Electric Power Sector”. Accessed on 26 July 2019.
https://home.kpmg/content/dam/kpmg/ph/pdf/InvestmentGuide/2013PHInvestmentGuideInvestmentGuideTheE nergyReportPhilippines.pdf
IEA. 2015. “World Energy Outlook Special Briefing for COP 21”. Paris: International Energy Agency. Accessed March 2018.
http://climateknowledge.org/figures/Rood_Climate_Change_AOSS480_Documents/IEA_COP21_Paris_Briefin g_IntEnerAgen_2015.pdf
IRENA. December 2012. “Financial Mechanisms and Investment Frameworks for Renewables in Developing Countries”. Masdar City: International Renewable Energy Agency (IRENA). Accessed 19 August 2019. http://energy-base.org/wp-content/uploads/2013/11/IRENA-Financial-Mechanisms-and-Investment-Frameworks-for-Renewables-in-Developing-Countries.pdf
Investopedia. n.d. Jensen's Measure (Definition). Accessed 5 August 2019, http://www.investopedia.com/terms/j/jensensmeasure.asp.
Investopedia. n.d. Country Risk (Definition). Accessed 5 August 2019, https://www.investopedia.com/terms/c/countryrisk.asp
Lee, Cheuk Wing. 2014. “Risk Management Methods Applied to Renewable and Sustainable Energy: A Review”. Journal of Electrical and Electronic Engineering. 3. 1-12. 10.11648/j.jeee.s.2015030101.11.
Madhusoodanan, T P. 1997. "Risk and Return: A New Look at the Indian Stock Market". Finance India, Vol 1, No 2, June, pp 285-304.
Marquardt J. 2017. “How power affects policy implementation: Lessons from the Philippines”. Journal of Current Southeast Asian Affairs 36(1), 3-27. Accessed 23 March 2018.https://journals.sub.uni-hamburg.de/giga/jsaa/article/view/1028
Meller, H. 2015. “Opportunities and challenges for solar PV in the Philippines: Broader regulatory barriers”. Presentation at the 2015 ADB Clean Energy Forum. Accessed on 19 August 2019,
https://d2oc0ihd6a5bt.cloudfront.net/wp-content/uploads/sites/837/2015/06/Hendrik-Meller.pdf.
Mishra, Dev and O’Brien, Thomas. 2005. “Risk and ex ante cost of equity estimates of emerging market firms”. Emerging Markets Review, Vol. 6, Issue 2, June 2005, pp. 107-120.
16
Mobarek, Asma & Mollah, Sabur . 2005. “The general determinants of share returns: an empirical investigation on the Dhaka stocks exchange”. Review of Pacific Basin Financial Markets and Policies, 8(4).
Mossin, Jan. "Equilibrium in a Capital Asset Market." Econometrica 34, no. 4 (1966): 768-83. doi:10.2307/1910098.
Ocampo, P.B. Jr., 2003. “Alternative methodologies for testing CAPM in the Philippine equities market”. Working Paper, University of Limoges, France. Access June 2018.
http://www.upd.edu.ph/~cba/docs/dp0311_pbdo.PDF.
Philippine Department of Energy (DOE). 2016. 2016 Philippine Power Statistics. Accessed 19 August 2019. https://www.doe.gov.ph/philippine-power-statistics
Philippine Stocks Exchange (PSE). (n.d.). Listing Directory. Accessed 01 August 2016, https://www.pse.com.ph/stockMarket/listedCompanyDirectory.html.
Philippine Dealing and Exchange Corp. (n.d). Philippine Dealing System Treasury Fixing (PDST -F) rates. Accessed 19 August 2019. http://www.pds.com.ph.
Renewable Energy Policy Network for the 21st Century(REN21). 2017. “REN21Renewables Global Status Report”. Paris: REN21. Accessed 20 August 2019.
https://www.renewable-ei.org/en/activities/events/img/20171027/ChristineLins_20171027_EN.PDF
Remo, Amy. 2016, July 5. “Coal to remain big part of energy mix. Philippine”. Daily Inquirer (newspaper). Accessed November 2017. http://business.inquirer.net/211635/coal-remain-big-part-energy-mix
Ross, Stephen. 1976. “Arbitrage Pricing Theory (APT) of Ross”. Journal of Economic Theory 13, 1976, pp. 341-360. https://doi.org/10.1016/0022-0531(76)90046-6
Saculsan, Phoebe Grace & Mori, Akihisa. 2018. “What Can the Philippines Learn from Thailand`s ENCON Fund in Overcoming the Barriers to Developing Renewable Energy Resources”. Journal of Clean Energy Technologies (JOCET) 2018 Vol.6(4): 278-283 ISSN: 1793-821X, DOI: 10.18178/JOCET.2018.6.4.474
Sehgal, Sanjay. 1997. "An Empirical Testing of Three Parameter Capital Asset Pricing Model in India". Finance India, Vol XI, No 4, December, pp 919-940.
Senate Economic Planning Office (SEPO). 2014. “Renewable energy at a glance”. Accessed 19 August 2019. https://www.senate.gov.ph/publications/AAG%20on%20Renewable%20Energy_June%2030_FINAL.pdf
Sharpe, WF. 1964. “Capital asset prices: A theory of market equilibrium under conditions of risk”. The Journal of Finance, 425-442. https://doi.org/10.1111/j.1540-6261.1964.tb02865.x
S&P Global Clean Energy Index. n.d. Accessed 22 August 2019. https://us.spindices.com/indices/equity/sp-global-clean-energy-index
Treynor, Jack (with minor edits by Craig William French) (1961, revised 2015). “Market value, time and risk”. Accessed November 2017. https://papers.ssrn.com/sol3/papers.cfm?abstract_id=2600356