Munich Personal RePEc Archive
Airport charges and marginal costs for
Spanish airports before the process of
partial privatization
Núñez-Sánchez, Ramón and Hidalgo-Gallego, Soraya and
Martínez-San Román, Valeriano
Universidad de Cantabria
March 2019
Online at
https://mpra.ub.uni-muenchen.de/92973/
Airport charges and marginal costs for Spanish airports
before the process of partial privatization
Ramón Núñez-Sánchez1
Soraya Hidalgo-Gallego2
Valeriano Martínez-San Román3
Airport pricing is considered as one of the most relevant issues for policymakers. According transport policy, pricing schemes should be at least partially based on marginal costs. This article aims at comparing the most relevant aeronautical airport charges with their corresponding marginal costs for the Spanish airports in the period before the partial privatization process. To that end, we have built very detailed airport charge variables, and then, have estimated a flexible short-run variable cost function system using a panel of thirty-five airports over a 6-year period. The results show that the evolution of aeronautical airport charges does not follow the trend of marginal costs. Moreover, these charges are set above the short-run marginal costs with the exception of the smallest and insular airports. Finally, we find the existence of non-neutral technological change and excess of capacity for the Spanish airports.
Keywords: airport pricing, cost function, airport regulation, Spanish airports.
JEL codes: R48, L93, H54.
1.
Introduction
In the last decades transport policies have faced a number of important challenges derived both from technological and institutional change in the airline sector and from the increasing importance of airport infrastructures as generators of economic activity. In this sense, airport
1Corresponding author. Departamento de Economía. Universidad de Cantabria. Avda. Los Castros, s/n, Santander
pricing is considered as one of the most relevant issues for policymakers. Most relevant airport revenues stem from the number of aircraft operations, number of passengers and commercial activities. Traditionally, aeronautical charges have been based on the first category. However, airlines have expressed their preference for per-passenger based airport charges over per-flight based airports charges.
The impact of airport pricing on social welfare has been a hot topic in airport economics’ literature. A thoughtful survey of airport pricing is Basso and Zhang (2007). Some theoretical contributions regarding airport charging focus on the effects of the different regulatory regimes on congestion and social surplus. Lu and Pagliari (2004) point out that one of the most critical issues facing policy makers is whether it is preferable to adopt a single-till regulation, where airport charges are set to cover both aeronautical and commercial activities, or a dual-till approach, where only aeronautical activities are taken into consideration. Their research concludes that the single-till approach is desirable where excess of capacity exists. Other authors obtain similar results in later theoretical models such as Czerny (2006).
More recent theoretical studies, such as Czerny and Zhang (2015) and Czerny et al. (2017), focus on the study of the optimal mix of per-flight and per-passenger based airport charges considering a downstream carrier market structure of monopoly and oligopoly, respectively. Both studies also compare different optimal airport charges mix conditional on carriers and social welfare viewpoint. Their analysis suggest that the increased use of per-passenger based airport charging structures does not require external regulatory corrections because under certain assumptions, it might be compatible with the social maximizer aim.
A second wave of empirical studies have tried to differentiate between airport aeronautical charges. Choo (2014) uses a panel dataset covering US airports from 2002 to 2010. His findings reveal strong evidence of cross-subsidization from non-aeronautical revenue to aeronautical charges. Moreover, unit cost strongly correlates to airport charges, and aeronautical fees are more expensive for hub airports and airports with higher international traffic. Additionally, he finds a substitution effect in the price setting of landing charges and terminal charges. Mathisen et al. (2014) review the charge scheme used to finance airport infrastructure in Norway. They derive long-run marginal costs for passengers and air traffic movements at Norwegian airports using panel data analysis for the period 2007-2009. The estimated marginal costs are used as the basis for a revised airport charge scheme designed to meet the principle of maximizing social benefits. The results suggest that there should be a shift towards a relatively higher charge for passengers compared to aircraft movements.
This paper contributes to this debate by analyzing the particular case of the Spanish airport system. The aim of this paper is twofold. Firstly, to estimate a short-run variable cost function for the Spanish airports. Secondly, to compare airport marginal cost with aeronautical charges. The short-run cost function is estimated using two different outputs, passengers and volume of operations. One novelty of this paper is the use of the maximum take-off weight (MTOW, in tons) instead of air transport movement (ATM) in order to capture the volume of operations. This distinction is important since it allows the comparability of landing charges and their corresponding marginal cost, both measured in Euros per ton. Furthermore, to the best of our knowledge, there is no previous studies that compare landing charges and their corresponding marginal costs.
The Spanish airport system provides a very interesting case for the purpose of this study. (i) A fully stated-owned company (AENA), whose objective is to recover costs for the airports as a whole, manages Spanish airports. This model differs from other European airports in which management is usually more decentralized (Bel and Fageda, 2010). (ii) The period analyzed is immediately before the partial privatization of AENA in 2015. (iii) Financial and traffic data for the Spanish airports is extensive, homogeneous and reliable.
aeronautical revenue over the number of aircraft movements (Bilotkach et al., 2012)4. The
results show that aeronautical airport charges for the two outputs, passengers and volume of operations, are set above the short-run marginal costs with the exception of the smallest airports and the insular ones. Moreover, our results reveal that aeronautical charges and marginal costs do not follow the same progression over the analyzed period.
The rest of the paper is organized as follows. We describe the Spanish airport system and its pricing policy for the pre-privatization period, from 2009 until 2014, in Section 2. Section 3 presents an econometric specification suitable for studying short-run marginal costs at Spanish airports. Section 4 describes the data set and Section 5 presents the results and derives marginal costs for passengers and flight operations. Finally, we give some conclusions and policy implications derived from our analysis.
2.
The Spanish airport system
2.1.An overview of AENA
The public firm Spanish Airports and Air Navigation, AENA, was created in 1991 to manage the main Spanish airports on a centralized basis. AENA has been attached to the Spanish Ministry of Development, which in accordance with the mandate established by the Government, set its action guidelines, approves the annual plan of objectives, and monitors its activity. Other features of the Spanish airports are as follows: (i) the existence of cross subsidies among airports (Bel and Fageda, 2011); (ii) discriminatory airport pricing strategy based only on airport passenger traffic; (iii) lack of individual airport marketing policies related to charges, quality or innovation. In this sense, regional governments use promotion agreements with air carriers in order to stimulate new or existing routes, especially in regional airports. This rigidity provokes lack of transparency in these kinds of agreements (Núñez-Sánchez, 2015). (iv) Airports institutional framework, which differs notably from other industries with similar technological characteristics such as ports (Núñez-Sánchez, 2013), is considered an obstacle to take advantage of potential economic efficiencies (CNMC, 2014).
In 2010, the executive order 13/2010 (BOE, 2010) created a new corporation, AENA Aeropuertos, aimed at managing Spanish airports, providing greater flexibility to the system activity, and at raising revenues in order to wipe out the debt accumulated by the former AENA
4 Bilotkach et al (2012) recognize that their aeronautical charge variable “is a rough proxy for average price since
as a result of capacity investments in airport infrastructure in the previous period. This new regulation allowed the entry of private capital with a maximum amount of 49%. In addition, it contemplated the creation of subsidiary companies or concession contracts for the individualized management of some airports. Finally, those tools were never developed. The capital of the new firm established in June 2011 was completely public whereas the centralized management of airports remained.
A new reform in 2012, the executive order 20/2012 (BOE, 2012), contemplated the gradual transition from a single-till system into a dual-till system in five years through a cost recovery model. To put into force this reform, the government approved in July 2014 a new regulatory framework for setting airport charges called document for airport regulation (DORA) to prepare airport regulation before the privatization process. Thus, a dual-till system would be completely implemented in 2018.
AENA was partially privatized in 2015. The Spanish government maintained 51 percent of total shares, and therefore controlled the company, but listed 28 percent of the operator on the stock market and sold another 21 percent to three private anchor investors: Spanish infrastructure group Ferrovial, British investment fund TCI, and Spain's Corporacion Financiera Alba fund5.
2.2.Pricing in the Spanish airport system
The structure of Spanish airport charges from 2009 to 2014 is established under the Air Safety Law 21/2003 (BOE, 2003), which considers airport charges as public patrimonial benefits. Therefore, they are not dependent on decisions related to any market principle. As abovementioned, the centralized airport pricing system, based on a single-till rate of return system, set identical charges for different subsets of airports defined according their passenger traffic. Table 1 shows the classification of the Spanish airports according to the number of passengers into five groups as proposed by AENA.
Table 1. Spanish airport classification in 2014 Group Airports
GROUP 1 Adolfo Suárez Madrid-Barajas (MAD); Barcelona-El Prat (BCN)
GROUP 2 Alicante (ALC); Gran Canaria (LPA); Tenerife Sur (TFS); Málaga-Costa del Sol (AGP); Palma de Mallorca (PMI)
GROUP 3 Bilbao (BIO); Fuerteventura (FUE); Girona (GRO); Ibiza (IBZ); Lanzarote (ACE); Menorca (MAH); Santiago (SCQ); Sevilla (SVQ); Tenerife Norte (TFN); Valencia (VLC)
GROUP 4 Almería (LEI); Asturias (OVD); A Coruña (LCG); FGL Granada-Jaén (GRX); Jerez (XRY); La Palma (SPC); Murcia (MJV); Reus (REU); Santander (SDR); Vigo (VGO); Zaragoza (ZAZ)
GROUP 5 Albacete (ABC); Badajoz (BJZ); Burgos (RGS);Córdoba (ODB); El Hierro (VDE); Huesca-Pirineos (HSK); La Gomera (GMZ); León (LEN); Logroño (RJL); Melilla (MLN); Salamanca (SLM); San Sebastián (EAS); Pamplona (PNA); Vitoria (VIT); Valladolid (VLL)
Source: AENA annual report (2015)
In general terms, airport revenues are classified into three different types: those related to aeronautical infrastructure services; those related to support services for aeronautical activities (also called non-aeronautical services); and finally, commercial revenues. Table 2 exhibits the revenue structure of Spanish airports in 2011, before the implementation of any privatization schedule.
Regarding the first type of revenue, aeronautical services are provided to airlines to enable aircraft landing and take-off operations, boarding and disembarking passengers and loading and unloading goods. Aeronautical revenues should finance the main airport infrastructures. It represented 65 per cent of the total revenue in 2011. Revenues related to passenger services (27.5 per cent) and aircraft landing (22.3 per cent) being the most important. Commercial revenues include concession activities such as supply of car parking, car rental services, food and beverages, duty-free shopping, etc. They represented 26.8 per cent of total revenues. Commercial concessions, car parking and car rental services were the most relevant activities in terms of total revenues. Finally, support services for aeronautical operations (also called non-aeronautical services) include the handling of the aircraft, the passage and the merchandise during and after the stopover, provision of ramp handling services, food services on board, check-in desks, authorization for restricted areas, or the use of waiting rooms. They represented less than 8 per cent of the total revenues in 2011.
Table 2. Revenues’ structure of AENA Aeropuertos in 2011 Type of revenue Subtotal (%) Total (%) Aeronautical revenues
Landing 34.10 22.30
Aircraft parking 1.30 0.90
Passenger services 42.10 27.50
Passenger security 13.50 8.80
Cargo 0.70 0.50
Other 8.30 5.30
Subtotal 100.00 65.30
Non-aeronautical revenues
Subtotal 100.00 7.80
Commercial revenues 100.00 26.80 Subtotal
TOTAL 100.00
Source: AENA annual report (2012)
Due to the importance of passenger and landing charges in terms of aeronautical revenues, we will analyze the evolution of these two airport charges from 2009 to 2014. In order to take into account the charge regulatory setting, we consider the abovementioned airport classification. We also consider an additional category for insular airports due to their particular regulatory scheme.
Figure 1 shows that, in the first two years, passenger charges were relatively homogeneous, with the exception of insular airports. However, differences between groups arised for the next years, especially for the hub airports (Group 1). Passenger charges increased more than 200 percent in Madrid-Barajas and Barcelona-El Prat from 2010 to 2012, consistent with the first proposed privatization schedule, keeping more stable during the last years of the sample. Regarding other groups, their respective passenger charges have kept particularly steady throughout the sample period, except for groups 4 and 5, the smallest airports, for which passenger charges fall notably in 2011.This last fact may be explained, at least in part, by a strategy of attracting low cost carriers to operate in these small and regional airports. Like in the case of passenger charges, landing charges increased in the biggest airports (Groups 1 and 2), while they decreased in the rest of the groups. Insular airports showed the most stable pattern.
Figure 1: Evolution of passenger and landing charges by airport group
Source: Own elaboration from Aena’s charges guides documents
3.
Econometric model
Airport infrastructure such as terminal area or kilometers of runaways cannot be adapted immediately to shifts in demand. This impossibility comes from the indivisibilities associated to the transport infrastructure, budgetary restrictions or the bureaucracy associated with the public sector, among others. Therefore, airport infrastructure should be considered as a quasi-fixed input instead of a variable one. The existence of quasi-quasi-fixed inputs in the production of airport activities suggests estimating of a short-run variable cost function. This specification allows assuming the minimization of airport variable costs subject to the existing quasi-fixed input level.
3.1.Specification
For the estimation of the short-run variable cost function, we have chosen a flexible functional form, the multiproduct translog function with variables deviated from their geometric mean. It is based upon a second-order Taylor series expansion around the mean values:
0 2 4 6 8 10 12 14 16 EUR
2009 2010 2011 2012 2013 2014
Passenger charge
0 2 4 6 8 10 12 14 16 EUR
2009 2010 2011 2012 2013 2014
Landing charge
ln 𝑉𝐶 𝛼 𝛼 ln 𝑤 𝛽 ln 𝑄 12 𝛾 ln 𝑤 ln 𝑤
1
2 𝛿 ln 𝑄 ln 𝑄 𝜆 ln 𝑄 ln 𝑤
𝜃 ln 𝑘 12 𝜃 ln 𝑘 𝜃 ln 𝑘 ln 𝑤
𝜃 ln 𝑘 ln 𝑄 𝑢 (1)
where 𝑉𝐶 is the total variable cost of airport 𝑖 in year 𝑡, 𝑄 is the amount of output 𝑚 for airport 𝑖 in year 𝑡, 𝑤 is the variable input 𝑗 price for airport 𝑖 in year 𝑡, and 𝑘 is the quasi-fixed input of airport 𝑖 in year 𝑡, which is assumed to be fixed in the short run.
We apply the Shephard's Lemma to obtain the expression for the variable input cost shares. These cost shares are estimated jointly with the variable cost function in order to improve the efficiency of the estimation:
𝑆 𝜕 ln 𝑉𝐶𝜕 ln 𝑤 𝛼 𝛾 ln 𝑤 𝜆 ln 𝑄 𝜃 ln 𝑘 𝑣 (2)
In order to fulfill the property of homogeneity of degree one for variable input prices in our cost specification, we impose the following restrictions:
𝛼 1 ; 𝛾 0 ; 𝜆 0 ; 𝜃 0 (3)
Additionally, Symmetry is imposed considering that: 𝛾 𝛾 , 𝜆 𝜆 , 𝜃 𝜃 . We might calculate airport and time specific variable cost elasticities for each output by logarithmic differentiation of the variable cost function:
𝜀 𝛽 𝛿 ln 𝑄 𝜆 ln 𝑤 𝜃 ln 𝑘
(4)
𝑆𝑇𝐶 𝑉𝐶 𝑟 𝑘 (5) Then, we calculate the short-run total cost elasticity with respect to each output m as:
𝜀 𝜀 𝑆𝑇𝐶𝑉𝐶 (6)
As we have seen in the previous section, marginal costs are calculated to compare them with their corresponding airport charges set by regulators.
The estimation of a variable cost function allows the calculation of the short-run economies of capacity utilization, 𝑆𝑟𝑆𝐸, which are defined on the technology as the maximal proportionate growth rate of outputs, as all the variable inputs are expanded proportionally, given the level of installed capacity.
𝑆𝑟𝑆𝐸 𝑉𝐶
∑ 𝑄
1
∑ 𝜀 (7)
3.2.Estimation procedure
The estimation of the previous cost system of equations arises some econometric issues. The first one is the consideration of output variables as endogenous. These variables could be correlated to some factors included in the error term of the cost function. If this correlation between the error term and the output variables occurs, endogeneity problems arise. A feasible solution for the endogeneity issue is the application of an instrumental variable procedure such as the Three-Stage Least Square estimator (3SLS). This method requires the instruments to be correlated with the endogenous variables but uncorrelated with the error term of the cost function. Previous literature related to airport cost functions does not take into account this endogeneity, with few exceptions, such as Bottasso and Conti (2012). When output variables are considered exogenous Seemingly Unrelated Regression model (SUR) is preferred. We estimate the cost system using both techniques to check the robustness of the results.
Finally, we present different specifications for time effects. On the one hand, we use time dummies; and, on the other hand, we introduce non-neutral technological change by a trend and its interaction with the outputs and the quasi-fixed input.
4.
Data
We use a balanced panel data for 35 Spanish airports observed yearly from 2009 until 2014. The economic and financial information was obtained from the annual reports published by AENA, which provides accounting data that is both homogeneous and comparable across the airport system. Additional statistical data (regional domestic product, population…) have been gathered from the Spanish National Statistical Institute (INE). The final panel data set consists of 210 observations.
In the first stage of our analysis, we estimate a short-run variable cost function with the variable input cost shares. Variables related to airports' variable cost, outputs, quasi-fixed inputs and input prices are required to estimate this system. Additionally, a set of control variables and instruments have also been included to control for heterogeneity and endogeneity.
Once the cost system has been estimated and marginal cost calculated, the second stage of the analysis compares Spanish airports' marginal costs with their corresponding passenger and landing charges. We next describe the variables used and how they have been constructed.
The variable cost (VC) is the sum of labor and intermediate consumption expenses, whereas the total cost (TC) is the sum of variable cost and capital cost. Regarding outputs, in the literature, it is common practice to consider the following ones: passenger, cargo, workload units (WLU), air transport movements (ATM) and the revenues from non-aeronautical or commercial activities. However, few studies used more than two or three of these outputs. Bottasso and Conti (2012) is one of the few exceptions in the airport cost analysis. The reason may be that airport outputs are highly correlated among them. This study considers two output variables number of passengers and volume of operations (measured as their maximum take-off weight in tons) since the two main aeronautical charges relates directly to them6. Moreover,
AENA charges its landing services using the maximum take-off weight in tons as the unit of measurement for the volume of operations. Then, using the maximum take-off weight instead of ATM as a proxy for the volume of operations allows the comparability between the marginal
6 Passengers and volume of operations are the most relevant aeronautical outputs in terms of revenues for the
cost and the landing charge. On the one hand, passenger output variable (pax) is measured as the number of passengers using the airport facilities.
On the other hand, the construction of the volume of operations variable is not straightforward. First, we obtain the number of landing operations by aircraft model in every airport and for every year from AENA. Once we got these data, we need to know the MTOW of each aircraft model by looking at the technical specifications of the aircraft. This task is time consuming, and sometimes this information is hard to find or not available. We have opted for a simpler procedure. (1) We rank aircraft models by the number of operations, and we obtain MTOW data for the 3 or 4 aircraft models with more operations in each airport. (2) For these aircraft models, we multiply the aircraft MTOW by the number of landing operations. (3) For the rest of operations in each airport we compute the average MTOW for the aircraft models in (1) and multiply this value by the rest of landing operations. (4) Finally, we aggregate total MTOW values to obtain our output variable for the volume of operations for each airport and year.
On the input side, we have considered three inputs: two variable and one quasi-fixed. The variable inputs are labor and intermediate consumptions, whereas the terminal surface measured in square meters (K) approximates the quasi-fixed input. We have computed Labor price (pl) as follows: (1) We obtain the annual cost per worker in the storage sector and support activities for transportation (in which airports are included) from the Annual Survey Labor Cost, published by the Spanish National Statistical Institute (INE). (2) We get a regional labor cost ratio by dividing the labor cost of each region by the national labor cost. (3) Finally, we get regional labor price by multiplying the annual cost per worker obtained in (1) by the ratio in (2). Regarding the price of intermediate consumptions, the regional-level Industrial Price Index is used as a proxy (pci).
Additionally, we have included different control variables in the cost system in order to take into account heterogeneity among airports. First, a dummy variable for Vitoria airport (dv) which is highly specialized in cargo traffic. Second, the share of commercial revenues in total revenues to control airport heterogeneity regarding the level of commercial activity (percom)7.
Third, a number of dummy variables take into account the different size of airports (g1-g5).
As abovementioned, the use of instruments is not common in airport cost analysis, except for
7 Commercial revenues have not been incorporated as an output because airport costs associated to these
Bottasso and Conti (2012). These authors take the lag of the outputs as instruments to solve output endogeneity. As a novelty, we use a set of instruments not used before in this literature. These instruments are the GDP of the airports' region, landing and passenger charges, the density of motorways measured as km/100 squared-km in airport's region; and time, group and location dummies. The GDP, airport charges and motorway infrastructure are factors that affect airport demand directly, but they are uncorrelated with any omitted variable contained in the error term of the cost function. Additionally, with group and location dummies, we collect the differences in the volume of traffic produced by the characteristics of the airports and their location. Finally, time dummies allow gathering the effect of economic cycles on airport traffic.
Table 3: Descriptive statistics of the variables included in the cost system
Variable Units Mean Std. Dev. Min Max
Variable cost (vc) Thousand €
(2001) 38,653 73,812.69 2,080 422,930
Total cost (tc) Thousand €
(2001) 61,563.05 123,931.4 3,280 739,670
Passengers (pax) Passengers 5,527,134 9,661,990 6,912 4.99E+07
Operations (oper) Tons 3,097,929 6,085,634 18,482 3.35E+07
Terminal surface (K) Square meters 65453.93 160241.9 1201 940000
Labor price (pl) € (2001) 37,674 3,949 32,380 48,683
Intermediate consumption
prices (pci) Index 112.60 11.10 96.00 131.00
Non-aeronautical revenue
share (percom) Percentage 27.70 6.10 6.00 48.60
Gross domestic product
(GDP) Thousands € (2001) 3.04e+07 3.63e+07 1,377,655 2.00e+08
Passenger charge (ppax) € (2001) 4.43 2.38 0.70 17.14
Landing charge (pmtow) € (2001) 4.45 1.61 0.77 8.18
Highway Kms per
square-km 3.63 1.83 0.00 9.75
Source: Own elaboration based on AENA's data.
5.
Results
3. In both cases, the null hypothesis of outputs being exogenous is rejected at the 5% level of significance.
Regarding technological change, specification 1 captures time effects through year dummies, while the other two specifications consider non-neutral technological change by a time trend variable and its iterations with the other variables.
Table 4 displays the results of the three estimations. All models fulfill the required regularity conditions: homogeneity of degree one on input prices, no decreasing in input prices and outputs and concavity in input prices. Additionally, in all the three specifications, the estimated first-order coefficients exhibit the expected signs and all of them are statistically significant, except for the coefficient related to the quasi-fixed input. Results also show the existence of economies of capacity utilization, which is calculated as the inverse of the sum of the coefficient related to passengers and landing services.
Table 4: Short-run variable cost function estimates
Specification 1 Specification 2 Specification 3
Coeffic. Std. Error Coeffic. Std. Error Coeffic. Std. Error
cons 0.666 0.220 *** 1.059 0.201 *** 0.755 0.235 ***
pl 0.423 0.005 *** 0.425 0.005 *** 0.425 0.005 ***
pci 0.577 0.005 *** 0.575 0.005 *** 0.575 0.005 ***
K 0.000 0.009 0.002 0.009 0.001 0.009
pax 0.319 0.065 *** 0.297 0.058 *** 0.369 0.069 ***
oper 0.173 0.059 *** 0.125 0.053 ** 0.125 0.060 **
plpl 0.104 0.036 ** -0.018 0.052 -0.007 0.053
pcipci 0.104 0.036 ** -0.018 0.052 -0.007 0.053
paxpax -0.361 0.152 *** -0.246 0.171 -0.265 0.174
operoper -0.467 0.222 *** -0.238 0.247 -0.321 0.252
KK -0.002 0.008 -0.001 0.008 -0.002 0.008
plpci -0.104 0.036 *** 0.018 0.052 0.007 0.053
plK -0.004 0.003 -0.004 0.003 -0.004 0.003
pciK 0.004 0.003 0.004 0.003 0.004 0.003
plpax 0.061 0.018 *** 0.034 0.017 ** 0.047 0.018 ***
ploper -0.110 0.019 *** -0.081 0.018 *** -0.095 0.020 ***
pcipax -0.061 0.018 *** -0.034 0.017 ** -0.047 0.018 ***
pcioper 0.110 0.019 *** 0.081 0.018 *** 0.095 0.020 ***
Kpax 0.005 0.027 0.004 0.028 0.016 0.029
Koper -0.007 0.028 -0.010 0.029 -0.021 0.030
paxoper 0.434 0.184 ** 0.268 0.206 0.323 0.210
g2 -0.606 0.107 *** -0.665 0.108 *** -0.582 0.115 ***
g3 -0.985 0.155 *** -1.112 0.146 *** -0.924 0.165 ***
g4 -1.111 0.208 *** -1.340 0.186 *** -1.039 0.222 ***
g5 -1.155 0.249 *** -1.468 0.211 *** -1.065 0.266 ***
percom 0.091 0.192 0.238 0.208 0.243 0.211
dv 1.530 0.107 *** 1.402 0.112 *** 1.491 0.119 ***
t -0.031 0.008 *** -0.029 0.008 ***
t2 -0.052 0.009 *** -0.051 0.009 ***
tK -0.010 0.005 ** -0.012 0.005 **
tpl -0.014 0.004 *** -0.014 0.004 ***
tpci 0.014 0.004 *** 0.014 0.004 ***
tpax -0.009 0.025 -0.007 0.025
toper 0.009 0.026 0.005 0.026
Y2009 0.187 0.039 ***
Y2010 0.203 0.039 ***
Y2011 0.189 0.038 ***
Y2012 0.333 0.037 ***
Y2013 0.015 0.037
Hausman 27.45 (0.000) *** 23.69 (0.000) ***
Notes: *, **, and *** denote parameters significant at 10%, 5% and 1%, respectively. Hausman over-identification test H0: Exogenous outputs. P-values in brackets.
process of substitution between labor and intermediate consumption in the period analyzed. This substitution process might be a consequence of the organizational change that AENA started in 2012. Along these lines, time effects in specification 1 show that variable costs are lower from 2012 than for the previous years, ceteris paribus. In 2012, AENA implemented two strategic measures to make its airports more attractive to future investors. First, a reduction in its workforce by 11%; second, AENA carried out a plan to improve the efficiency of regional airports. These measures helped reduce the system's costs.
Given that the non-neutral technical change and endogeneity of output variables have been proved, we focus now on the results obtained from specification 3. Table 5 displays the ECUs and the scale elasticities for passenger and landing services for the five groups of airports described in section 2 plus an additional group that includes only the insular airports. Annex 2 shows the results at the mean of each airport.
Passenger cost elasticity at the sample mean is 0.257. Table 5 shows that passengers short-run cost elasticities increase with the level of passenger traffic. The highest passenger cost elasticity corresponds to the biggest airports, Group 1, with a value of 0.373 (see annex 2 for individual airports elasticity values). On the other hand, Group 5 airports, those with less than 500.000 passenger traffic, present the lowest passenger cost elasticities (0.229). Regarding landing services cost elasticities, they are lower than those for passengers are, and they are not significant in some cases. Average elasticity of capacity utilization (ECU) is 1.91, which implies the existence of short-run scale economies. This result is higher than the value of 1.70 obtained by Martín et al. (2011) for the Spanish airport system in the period 1991-1997. This increase in the average ECU might be partially explained by substantial investments on capacity, which carried out in the Spanish airport system from the end of the 1990s onwards. Additionally, it is possible to see in Table 5 and Annex 2 that all Spanish airports analyzed present short-run scale economies, and that these scale economies decrease with the level of traffic. This negative correlation between traffic and economies of scale might imply a negative relationship between scale economies and airport size. Bottasso and Conti (2012) have also achieved similar results when analyzing the UK airport industry.
Although hub airports (Group 1) present the highest passenger cost elasticities, the highest marginal costs related to passengers correspond to regional airports (Group 5, see Table 6). This result is explained by the fact that they have the highest passenger average costs because the excess of capacity is higher in this group than in the rest.
Table 5: Short-run total cost elasticities for outputs and economies of capacity utilization
Group Estimated cost elasticity Capacity Utilization Economies of
Passengers Operations
1 0.373 *** 0.056 1.413 ***
2 0.290 *** 0.156 ** 1.546 ***
3 0.264 *** 0.128 *** 1.725 ***
4 0.231 *** 0.100 ** 2.010 ***
5 0.229 *** 0.076 2.664 ***
Insular 0.231 *** 0.159 *** 1.778 ***
Sample mean 0.257 ** 0.109 1.912 ***
Notes: *, **, and *** denote parameters significant at 10%, 5% and 1%, respectively.
Table 6: Short-run average and marginal costs
Group Estimated average cost Estimated marginal cost Passengers Operations Passengers Operations
1 12.975 20.020 4.840 *** 1.125
2 8.246 18.328 2.390 *** 2.864 **
3 9.420 19.492 2.483 *** 2.503 ***
4 16.719 30.310 3.867 *** 3.041 **
5 59.743 69.397 13.652 *** 5.299
Insular 21.513 31.924 5.180 *** 5.500 ***
Sample
mean 21.814 32.737 5.137 ** 3.352 ***
Notes: *, **, and *** denote parameters significant at 10%, 5% and 1%, respectively.
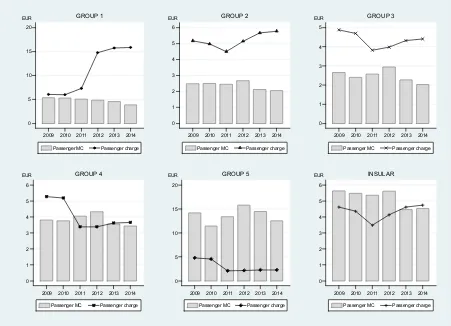
Figure 2: Evolution of passenger charges and marginal costs
Source: Own elaboration.
0 5 10 15 20 EUR
2009 2010 2011 2012 2013 2014
Passenger MC Passenger charge GROUP 1 0 1 2 3 4 5 6 EUR
2009 2010 2011 2012 2013 2014
Passenger MC Passenger charge GROUP 2 0 1 2 3 4 5 EUR
2009 2010 2011 2012 2013 2014
Passenger MC Passenger charge GROUP 3 0 1 2 3 4 5 6 EUR
2009 2010 2011 2012 2013 2014
Passenger MC Passenger charge GROUP 4 0 5 10 15 20 EUR
2009 2010 2011 2012 2013 2014
Passenger MC Passenger charge GROUP 5 0 1 2 3 4 5 6 EUR
2009 2010 2011 2012 2013 2014
[image:19.595.73.524.304.630.2]Figure 3: Evolution of landing charges and marginal costs
Source: Own elaboration.
Figures 2 and 3 display the evolution of established passenger and landing charges against the estimated short-run marginal cost for both types of output. Regarding passengers, two key facts highlight. Firstly, passenger related charges are set above the marginal cost for all airports groups, except for Group 5 (the smallest airports) and the insular airports. Group 5 airports present the highest passenger marginal costs (13.65 on period average) and the largest economies of capacity utilization (2.664 on period average), so they are far below the optimum operational size. However, passenger charges for these airports are notably lower than for the rest of groups. This fact may respond to a government strategy aimed at attracting new carriers to these airports, which, in turn, implies that regional airports need to be subsided by profitable ones. The existence of cross-subsidies among Spanish airports makes it possible.
Secondly, all groups present a change in the trend of their passenger charge in 2011. In this sense, Group 1 shows an important increase in passenger charges likely associated with the first attempt of privatization of Madrid and Barcelona airports. Groups 2, 3 and the Insular one
0 2 4 6 8 EUR
2009 2010 2011 2012 2013 2014
Landing MC Landing charge GROUP 1 0 2 4 6 8 EUR
2009 2010 2011 2012 2013 2014
Landing MC Landing charge GROUP 2 0 2 4 6 8 EUR
2009 2010 2011 2012 2013 2014
Landing MC Landing charge GROUP 3 0 2 4 6 8 EUR
2009 2010 2011 2012 2013 2014
Landing MC Landing charge GROUP 4 0 2 4 6 8 EUR
2009 2010 2011 2012 2013 2014
Landing MC Landing charge GROUP 5 0 2 4 6 8 EUR
2009 2010 2011 2012 2013 2014
display a slight fall in their average passenger charge until 2011. After this year, the average passenger charge for these groups grows again. Finally, for the smallest airports in Groups 4 and 5, the average passenger charge falls in 2011, keeping quite constant in the subsequent years. This fall in 2011 likely follows the strategy of attracting new traffics to the smallest airports to reduce airports average cost and partially solve over-dimension problems.
Regarding landing charges, they keep quite stable for Groups 1, 2, 3, and the insular one along the sample period. However, for Groups 4 and 5, there is a significant fall in 2011, in line with that previously explained for the case of passenger charges. On the other hand, as we mentioned above, for Groups 1 and 5 marginal cost are not statistically significant, so we cannot make straightforward comparisons between charges and estimated short-run marginal costs. In the case of Groups 2 and 3, landing charges are set over marginal cost for the whole period, while in Group 4 average charges are higher than estimated marginal costs until 2011, with no difference between charges and marginal costs in the subsequent years.
Our results also show that aeronautical charges, both for passenger and landing services, do not follow the same progression as marginal costs. This fact reveals that the government might not be applying an economic based pricing strategy. This evidence is in contrast to the research carried out by Voltes-Dorta and Lei (2013) who find passenger related price caps converge to passenger marginal costs for regulated British airports.
6.
Conclusions and policy implications
The centralized model of financing and management of Spanish airports is unique among economies of similar size. Despite a failed attempt to assimilate the model through the privatization of the two main airports, a partial privatization of the whole airport system was finally opted for.
We observe that the evolution of airport charges does not follow the progression of marginal costs. Moreover, aeronautical airport charges are set above the short-run marginal costs except for the smallest regional airports, aggregated in Group 5, and insular airports. This result would demonstrate the existence of cross-subsidies among Spanish airports.
Our results point to the following policy implications. First, Spanish airports need a more flexible charge regulatory framework in order to gain economic efficiency. In this sense, airport charges should take into account differences in marginal costs of airports. This is especially important for the post-privatization period in which airports might use their market power in the downstream airline market. Second, the existence of cross-subsidies might generate situations of moral hazard among airports. A more decentralized management system might reduce those inefficiencies.
Finally, further research could be done to assess the privatization process in Spain. For instance, an assessment of the dual-till charge regulation for a more recent period in which the privatization process had already been achieved similar than the Valdes and Sour’s (2017) research. The inclusion of both non-aeronautical activities following the literature of two-sided markets or vertical relations among airlines and airports might be other issues for further research.
7.
References
Basso, L. J., & Zhang, A. (2007). An interpretative survey of analytical models of airport pricing. Advances in Airline Economics, 2, 89-124. Emerald Publishing Limited.
Bel, G. & Fageda, X. (2010) Privatization, regulation and airport pricing: an empirical analysis for Europe. Journal of Regulatory Economics, 37, 142-161.
Bel, G. & Fageda, X. (2011) La reforma del modelo de gestión de aeropuertos en España: ¿Gestión conjunta o individual?. Hacienda Pública Española/Review of Public Economics, 196(1), 109-130.
Bilotkach, V, Clougherty, J.A, Mueller, J. & Zhang, A. (2012) Regulation, privatization, and airport charges: panel data evidence from European airports. Journal of Regulatory Economics, 42(1), 73-94.
laboral y liberalizadoras para fomentar la inversión y la creación de empleo. BOE núm. 293, 03/12/2010
BOE (2012). Real Decreto-ley 20/2012, de 13 de julio, de medidas para garantizar la estabilidad presupuestaria y de fomento de la competitividad.
Bottasso, A. & Conti, M. (2012) The cost structure of the UK airport industry. Journal of Transport Economics and Policy, 46(3), 313-332.
Choo, Y. Y. (2014). Factors affecting aeronautical charges at major US airports. Transportation Research Part A: Policy and Practice, 62, 54-62.
CNMC (2014) El sector aeroportuario en España: Situación actual y recomendaciones de liberalización. E/CNMC/0002/14 Report.
Coto-Millán, P., Casares-Hontañón, P., Inglada, V., Agüeros, M., Pesquera, M. Á., & Badiola, A. (2014). Small is beautiful? The impact of economic crisis, low cost carriers, and size on efficiency in Spanish airports (2009–2011). Journal of Air Transport Management, 40, 34-41.
Coto-Millán, P., Inglada, V., Fernández, X. L., Inglada-Pérez, L., & Pesquera, M. Á. (2016). The “effect procargo” on technical and scale efficiency at airports: The case of Spanish airports (2009–2011). Utilities Policy, 39, 29-35.
Czerny, A.I. (2006) Price-cap regulation of airports: single-till versus dual-till. Journal of Regulatory Economics, 30, 85-97.
Czerny, A. I., & Zhang, A. (2015). How to mix per-flight and per-passenger based airport charges. Transportation Research Part A: Policy and Practice, 71, 77-95.
Czerny, A. I., Cowan, S., & Zhang, A. (2017). How to mix per-flight and per-passenger based airport charges: The oligopoly case. Transportation Research Part B: Methodological, 104, 483-500.
Fernández, X. L., Coto-Millán, P., & Díaz-Medina, B. (2018). The impact of tourism on airport efficiency: The Spanish case. Utilities Policy, 55, 52-58.
Hidalgo-Gallego, S., Martínez-San Román, V., & Núñez-Sánchez, R. (2017). Estimation of Allocative Efficiency in Airports for a Pre-Privatization Period. In TheEconomics of AirportOperations, 69-95. Emerald Publishing Limited.
on Spanish airport technical efficiency. Journal of Air Transport Management. In press.
Lu, C. & Pagliari, R. (2004) Evaluating the potential impact of alternative airport pricing approaches on social welfare. Transportation Research Part-E: Logistics and Transportation Review, 40(2), 1--17.
Martín, J.C., Román, C. & Voltes-Dorta, A. (2011) Scale economies and marginal costs in Spanish airport. Transportation Research Part E: Logistics and Transportation Review, 47, 238-248.
Mathisen, T. A., Jørgensen, F., & Solvoll, G. (2014). Marginal costs pricing of airport operations in Norway. Research in Transportation Economics, 45, 49-56.
Núñez-Sánchez, R. (2013). Marginal costs, price elasticities of demand, and second-best pricing in a multiproduct industry: An application for Spanish port infrastructure. Journal of Transport Economics and Policy, 47(3), 349-369.
Núñez-Sánchez, R. (2015). Regional public support to airlines and airports: An unsolved puzzle. Transportation Research Part E: Logistics and Transportation Review, 76, 93-107.
Santaló, J. S. (2015). El impacto de la nueva regulación aeroportuaria sobre las tasas aéreas y el conflicto entre la Comisión Nacional de Mercados y Competencia (CNMC) y AENA a cuenta de la misma. Papeles de Economía Española, (145), 180-196.
Valdes, V., & Sour, L. (2017). Passenger Facility Charges in Privatised Mexican Airports: Dynamic Panel Data Evidence on the Domestic Market. Journal of Transport Economics and Policy, 51(1), 20-33.
Annex 1. Definition of variables related to airport charges
In order to compare landing and passenger marginal costs with their respective charges, these have been estimated following the next procedures.
Passenger facility charge
AENA (2009) establishes passenger charge (ppax) as "providing passenger departure areas not accessible to visitors airport terminal areas, as well as complementary airport facilities." Payment must be performed by airlines or government. However, passengers usually pay through this charge as an increase in the ticket fare.
The amount for this charge is determined by the origin and destination of the flight between 2009 and June 2011: a) between islands within the same archipelago (e.g. Tenerife Sur-Las Palmas de Gran Canaria); b) from any airport located in an island to any Spanish airport (e.g. Ibiza-Santander); c) from any peninsular airport to any airport located in the European Economic Area (EEA); d) from any Spanish airport to any airport non-located in the EEA.
A new airport charge scheme, implemented since June 2011, allows different airport charges according the volume of passengers of each airport. In this sense, the new regulatory system increase passenger charges for Madrid, Barcelona and airports specialized in tourism whereas decreases them for regional airports. This scheme discriminates between destinations in the EEA and international passengers. As in the previous regulation, it considers routes in the same archipelago or routes from any airport located in an island to any another Spanish airport.
In this study, we proceeded to the calculation as follows: (1) we have identified the type of passengers for each airport. (2) It has made a weighted average percentage of passengers of each type by the corresponding charge, obtaining an aggregated passenger charge for each airport and year, measured in euros per passenger.
Landing charge
the weight of the aircraft. From 2011, this differentiation disappeared and the landing charge does not depend on the origin country of the flight or the weight of the aircraft. Only for the case of island airports AENA's establishes different charges depending on whether on whether the flight originates in another island of the same region or in islands of other Spanish regions.
Given the above-mentioned lack of information availability, we have decided to make the following decisions in order to obtain an average landing charge for each airport. First, we do not take into account the acoustic classification of the aircraft due to the lack of data or the extreme complexity to achieve them. Second, for 2009 and 2010, where there are differentiated charges according to the weight of the aircraft, we have opted to compute the corresponding charge for aircrafts with a weight between 10 and 100 tons (the majority of aircrafts in Spanish airports).
[image:26.595.70.527.460.513.2]Finally, for all the airports in 2009 and 2010 and for the insular airports throughout the period we have calculated the percentage of landings that originate from EEA countries, from outside the EEA, from islands located in other Spanish region and from islands located in the same Spanish region. This allows us to calculate the weights we need to compute the average landing charge for each Spanish airport. Table A1 shows the descriptive statistics of the variables related to airport charges.
Table A1: Descriptive statistics of the variables related to airport charges
Variable Units Mean Std. Dev. Min Max
Landing charge Euros (2001) 4.450 1.608 0.770 8.175
Passenger charge Euros (2001) 4.434 2.382 0.700 17.142
Annex 2. Spanish airports’ marginal costs and economies of capacity
utilization
Table A2: Cost elasticity, marginal cost and ECUs by airport
Estimated
cost elasticity Economies of capacity utilization
Estimated marginal cost
passengers mtow passengers mtow
Alicante 0.289 *** 0.113 1.573 *** 2.548 *** 1.915
Almería 0.163 *** 0.155 ** 2.056 *** 3.235 *** 7.116 **
Asturias 0.343 *** 0.026 1.977 *** 4.070 *** 0.429
Barcelona 0.372 *** 0.061 1.428 *** 4.272 *** 1.080
Bilbao 0.345 *** 0.035 1.740 *** 3.189 *** 0.426
Coruña 0.278 *** 0.072 1.978 *** 4.122 *** 1.564
Fuerteventura 0.158 ** 0.207 ** 1.688 *** 1.372 ** 5.417 **
Gerona 0.292 *** 0.089 1.788 *** 2.298 *** 1.313
Granada 0.242 *** 0.107 ** 2.036 *** 3.938 *** 3.034 **
Hierro 0.176 ** 0.135 2.545 *** 5.391 ** 8.058
Ibiza 0.287 *** 0.131 ** 1.661 *** 1.956 *** 1.717 **
Jerez 0.231 *** 0.115 *** 2.013 *** 4.222 *** 3.945 ***
Lanzarote 0.234 *** 0.218 *** 1.663 *** 1.619 *** 4.093 ***
La Palma 0.166 *** 0.122 *** 1.985 *** 3.654 *** 5.568 ***
La Gomera 0.236 *** 0.036 3.352 *** 30.591 *** 3.938
Gran Canaria 0.282 *** 0.205 *** 1.561 *** 1.949 *** 3.486 ***
Madrid 0.374 *** 0.052 1.397 *** 5.406 *** 1.154
Menorca 0.165 ** 0.188 *** 1.811 *** 2.081 ** 6.743 ***
Málaga 0.302 *** 0.097 1.534 *** 3.527 *** 2.021
Melilla 0.207 *** 0.071 2.362 *** 6.351 *** 3.747
Mallorca 0.362 *** 0.148 1.463 *** 2.213 *** 1.825
Pamplona 0.247 *** 0.036 2.455 *** 11.177 *** 2.211
Reus 0.165 ** 0.180 ** 1.977 *** 2.261 ** 6.446 **
San Javier 0.221 *** 0.125 *** 1.937 *** 2.108 *** 2.338 ***
San Sebastián 0.267 *** 0.043 2.442 *** 6.939 *** 1.675 Tenerife Sur 0.207 ** 0.228 *** 1.606 *** 1.587 ** 5.606 ***
Tenerife Norte 0.274 *** 0.129 ** 1.704 *** 2.576 *** 2.276 **
Santander 0.245 *** 0.091 ** 1.996 *** 2.870 *** 1.797 **
Santiago 0.244 *** 0.108 ** 1.814 *** 3.460 *** 2.757 **
Sevilla 0.327 *** 0.094 1.713 *** 2.888 *** 1.416
Valencia 0.317 *** 0.080 1.685 *** 3.071 *** 1.269
Valladolid 0.175 ** 0.149 * 2.294 *** 4.318 ** 8.056 *
Vigo 0.277 *** 0.034 2.023 *** 5.682 *** 0.930
Vitoria 0.281 *** 0.073 3.841 *** 36.934 *** 8.052