Munich Personal RePEc Archive
Billionaires, millionaires, inequality, and
happiness
Popov, Vladimir
21 May 2019
1
Billionaires, millionaires, inequality, and happiness1
Vladimir Popov2 Abstract
The relationship between inequality and happiness is counterintuitive. This applies to both
inequality in income and wealth distribution overall and also inequality at the very top of the wealth
pyramid, as measured by billionaire intensity (the ratio of billionaire wealth to GDP). First,
billionaire intensity appears to be higher in countries with low, not high, levels of income
inequality. Second, happiness indices are higher in countries with high percentages of billionaire
and millionaire wealth as a proportion of GDP, but with low levels of income inequality.
This paper uses databases from the Forbes billionaires list, the Global Wealth Report (GWR), and
the World Happiness Report, as well as from the World Database on Happiness. Using these
datasets, I examine the relationship between income inequality and happiness for over 200
countries from 2000 to 2018.
It turns out that in relatively poor countries – below $20,000-$30,000 per capita income – inequality raises happiness rather than lowers it, but inequality has a negative impact on happiness
in rich countries. A certain degree of inequality of wealth and income distribution has a positive
impact on happiness feelings, especially in countries with low levels of income. Furthermore,
wealth inequalities, and especially the degree of concentration of wealth at the very top of the
wealth pyramid, raise happiness self-evaluations even when income inequalities lower it.
Keywords: inequality in income and wealth distribution, share of billionaires’ and millionaires’
wealth in GDP, happiness indices
JEL: D31, D63, I31
1This paper is the logical continuation of my two 2018 papers ‘Paradoxes of happiness. Why do people feel more
comfortable with high levels of inequality and high murder rates?’ DOC Expert Comment, 18 June 2018and ‘Why do some countries have more billionaires than others? Explaining variations in the billionaire-intensity of GDP’. DOC Expert Comment, 24 July 2018.
2 Dialogue of Civilizations Research Institute, Berlin, Germany. My thanks go to Tony Shorrocks who kindly
2
Billionaires, millionaires, inequality, and happiness3
Vladimir Popov4 Literature review, puzzles, and hypotheses
There are some important paradoxes in the dynamics of happiness indices and the relative levels
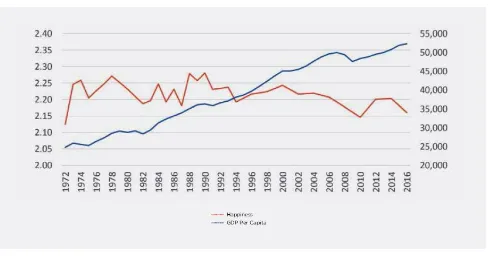
of these indices for various countries and different populations groups. One puzzle, the Easterlin
paradox, is the non-increasing level of happiness in the US in spite of constantly rising personal
[image:3.612.74.563.293.551.2]incomes (fig. 1).5
Figure 1: Average happiness score (left scale) and GDP per capita, dollars, (right scale) in the US in 1972- 2016
Source: Sachs (2018).
3This paper is the logical continuation of my two 2018 papers ‘Paradoxes of happiness. Why do people feel more
comfortable with high levels of inequality and high murder rates?’ DOC Expert Comment, 18 June 2018and ‘Why do some countries have more billionaires than others? Explaining variations in the billionaire-intensity of GDP’. DOC Expert Comment, 24 July 2018.
4 Dialogue of Civilizations Research Institute, Berlin, Germany. My thanks go to Tony Shorrocks who kindly
provided me with the excel table of the GWR database. I am also most grateful to Elena Sulimova for collecting the data and preparing the database for the analysis and to Jonathan Grayson for editing.
3
Sachs (2018) argues that America’s subjective wellbeing is being systematically undermined by three interrelated epidemics, notably obesity, substance abuse (especially opioid addiction), and
depression. But in other countries without as much obesity, drugs, and depression, there is also a
decline in happiness that goes hand in hand with rising real incomes.
In India, the happiness index score fell from 5 to 4 over the 2006-18 period despite strong growth of income in this period. In China, over the 1990–2000 decade, happiness plummeted despite massive improvements in material living standards. Brockmann, Delhey, Welzel, and Hao (2008)
explain this by growing income inequality within China, i.e., in relation to the average national
income, the financial position of most Chinese people deteriorated.
Similarly, in the US the recent increase in income inequalities could be responsible for the decline
in happiness: in 1980-2014, the post-tax incomes of the richest 10% rose by 113%; of the top 1%,
by 194%; and of the top 0.001%, by 617% (Piketty, Saez, Zucman, 2016), whereas the US
happiness index score over this period fell. However, the relationship between inequality and
happiness is also not straightforward and presents another puzzle.
Normally we assume that greater equality –‘inclusive development that leaves no one behind’ – is both morally just and desirable for the creation of happy societies. But there is evidence that
income and wealth inequalities are positively associated with happiness, as measured by the
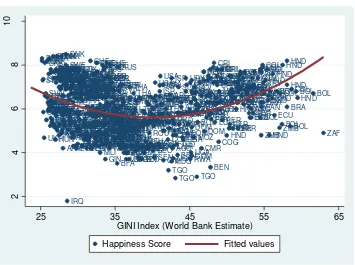
happiness index, at least for a group of countries. There are some poorer countries with high
income inequalities – Bolivia, Honduras, Colombia, Ecuador, Costa Rica and some other Latin American countries – and yet also with very high happiness index scores (fig. 2). It may well be that a certain degree of inequality is necessary to keep alive a kind of ‘American dream’: a future-oriented belief in getting rich and achieving success in life.
Alesina, Di Tella, and MacCulloch (2001) showed that there is a large, negative, and significant
4
mobility. People who believe that American society offers equal opportunities to all are more
averse to redistribution in the face of increased mobility.
On the other hand, those who see the social rat race as a biased process do not see social mobility
as an alternative to redistributive policies. Alesina and Giuliano (2009) presented evidence that
individuals who believe other people try to take advantage of them rather than being fair have a
strong desire for redistribution; similarly, believing that luck is more important than work as a
driver of success is strongly associated with a taste for redistribution.
Inequality at the very top does not seem to lead to pressure for redistribution. In Victorian England,
inequality within the elite was associated with more conditionality and less generous welfare
expenditure. Removing institutional advantages that benefited the elite did not appear to reduce
the effect of elite inequality, which suggests results cannot be explained by a classic median voter
model (Chapman, 2018).6 Therefore, an increase in inequality at the very top may be self-perpetuating; there is no pressure to redistribute and no mechanism to automatically ‘correct’ the inequality.
6This model predicts that in a majority-rule voting system, the outcome selected at the polls will be the one
5
Figure 2: Happiness index (Word Happiness Report and World Database on Happiness), 0-to-10 scale; and GINI coefficient of income inequality in percentage terms, 2000-18
Source: World Database on Happiness (2019); WDI.
There is also some evidence that happiness is positively correlated with murder rates, especially
when this goes hand in hand with inequalities (Popov, 2018a; 2018b). Inequalities lead to higher
murder rates, but this does not lead to a decline in happiness, at least up to a certain point.
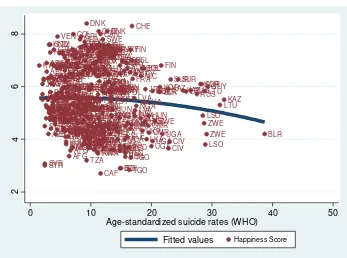
Furthermore, happiness scores also seem almost independent of suicide rates, which is often
considered an objective indicators of happiness, in contrast to happiness indices that measure
self-perception through surveys where people measure their own happiness on a 0-to-10 scale.
The relationship between self-reported happiness and objective indicators of frustration and
distress is somewhat counterintuitive. Murder rates are correlated positively with happiness index
scores (fig. 3), although this correlation is not statistically significant, whereas the correlation
between suicide rates and happiness is negative (fig. 4), as one would expect but very weak: in
regressions of happiness on murder rates, suicides rates, and per capita income, R2 is less than 2%
and the suicide rate is significant only in random effects specification – it is apparent with the
ALB DZA AGO ARG ARG ARG ARG ARG ARG ARG ARG ARG ARG ARG ARGARG ARM ARM ARM ARMARMARMARMARMARMARMARM
AUS AUSAUS
AUTAUT AUTAUTAUTAUTAUTAUTAUTAUT
AUT AUT AUT BGD BGD BLR BLRBLR BLRBLR BEL BEL BEL BELBEL BELBEL BEL BEL BELBELBELBEL
BEN BEN BTN BOL BOL BOL BOL BOL BOL BOL BOL BOL BOL BOL BOL BOL BIH BIH BIH BRA BRA BRA BRA BRA BRA BRABRA BRA BRA BGRBGR BGRBGRBGRBGRBGR BGR BGR BFA BDI BDI CMR CMR CAN CAN TCD CHL CHL CHL CHL CHL CHLCHL CHN CHN COL COL COL COL COLCOLCOLCOL
COL COL COL COL COM COD COG
CRI CRICRI CRI CRI
CRICRICRICRICRI CRI CRI CRI CRICRI CIV CIV HRV HRV HRV HRV HRV HRV HRV CYP
CYPCYPCYPCYPCYP CYP
CYPCYPCYPCYP
CYP CZE
CZE CZE CZECZECZE
CZE CZE CZECZE CZE CZE DNK DNKDNKDNK DNKDNKDNKDNKDNK
DNK DNK DNK DJI DOM DOM DOM DOM DOM DOM DOM DOM DOMDOM ECU ECUECU ECU ECU ECU ECU ECU ECU ECU ECU ECU ECU EGYEGY EGYEGY SLV SLV SLV SLV SLV SLV SLV SLV SLV SLV SLV SLV SLV SLV EST EST ESTEST ESTEST
ESTESTESTEST EST EST EST ETH ETH FIN FIN FINFINFINFIN FIN FIN FIN FINFIN FINFIN FRA FRA FRA FRA FRA FRA FRA FRA FRA FRA FRA FRAFRA GAB GEOGEO GEO GEOGEO GEO GEO GEO GEO GEOGEO DEUDEUDEUDEUDEUDEU
DEU DEUDEU
GHA GRCGRCGRCGRCGRCGRC
GRC GRCGRC GRC GRC GRC GRC GTMGTM GIN GIN HND HND HND HND HND HND HND HND HND HND HND HND HND HUN HUN HUN HUN HUN HUNHUNHUNHUNHUN
HUN HUN ISL IND IDN IRNIRN IRN IRQ IRQ IRL IRLIRL IRL IRL IRL IRLIRL
IRLIRLIRL IRL IRL ISR ISR ISR ITA ITA ITA ITA ITA ITA ITAITAITA
ITA ITA ITA ITA JPN JOR JOR JOR JOR KAZ KAZ KAZ KAZ KAZ KAZKAZ KAZ KAZ KAZ KEN KORKOR KOR KOR KOS KOS KOS KOS KOS KOS KOS KOS KOS KGZ KGZ KGZ KGZKGZ KGZ KGZKGZ KGZ KGZ KGZ LAO LAO LVA LVA LVA LVALVA
LVA LVALVALVA LVA LVA LVA LBN LBR LBR LTU LTU LTULTULTULTU LTU LTU LTULTU
LTU LTU LUX
LUXLUX LUXLUXLUXLUX LUXLUX LUX LUX LUX LUX MKD MKD MKD MKD MKD MKD MDG MYS MYS MYS MYS MYS MLI MLI
MLTMLTMLTMLT MLTMLTMLT MLT MLTMLT MRT MRT MEX MEX MEX MEX MEX MEXMEX MEX MDA MDA MDA MDA MDA MNG MNG MNG MNGMNG MNEMNE MNE MNE
MNEMNEMNEMNE
MOZ MMR
NPL NLD NLDNLDNLDNLD NLD NLD NLD NLD NLD NLD NLD NIC NIC NIC NER NER NER NGA NOR NOR NORNOR PAK PAK PAK PAK PAK PAN PAN PAN PAN PAN PAN PAN PAN PANPAN PAN PRY PRY PRY PRY PRY PRY PRY PRY PRY PRY PRY PRYPER PER PER PERPER PER PER PER PER PER PER PER PERPER PRTPRT PRT PRT PRT PRT PRT PRTPRT PRT PRT PRT PRT ROU ROU ROU ROU ROUROUROU
ROU ROU ROU RUS RUS RUS RUS RUS RUS RWA SEN SLE SVKSVK SVK SVKSVKSVKSVKSVKSVKSVKSVK SVN
SVN SVN
SVN
ZAF ESPESPESPESPESPESPESP
ESP ESP ESP ESP ESPESP LKA LKA LKALKA SDN SWESWE
SWE SWESWESWESWESWESWESWE
SWE SWE SWE CHECHE CHE CHE CHE CHE CHE CHE TJK TJK TJK TZA TZA THA THA THA THA THA THA THA THA THA THA TGO TGO TGO TUN TUR TUR TURTUR TUR TUR TUR TUR TUR TURTUR TUR TUR TUR TUR UGA UGA UGA UGA UKR UKR GBR GBRGBRGBR GBR GBRGBR GBR GBR GBR GBR GBR USA USA USAUSAUSA
URY URY URY URY URY URY URY URY URY UZB VEN VEN VEN VEN VNM VNM VNM VNM VNM VNMVNM YEM ZMB ZMB ZWE 2 4 6 8 10
25 35 45 55 65
GINI Index (World Bank Estimate)
6
naked eye from a comparison of figure 4, which presents cross-section data for the single year of
2018, and figure 5, which presents panel data for the years 2000-18.7
The murder rate is clearly positively correlated with income inequality (fig. 6), but the suicide rate
is correlated negatively, if at all (fig. 7).
Figure 3: Happiness index (Word Happiness Report and World Database on Happiness), 0-to-10 scale; and murder rate per 100,000 inhabitants in 2000-18
Source:WHO; World Database on Happiness.
7
HappinessIndex = 5.8*** – 9.7e-07Ycap + 0.007MURDERrate*– 0.01SUICIDErate
N=323 (Panel data for 2000-18 for over 200 countries, some observations are missing), R2=0.014, robust estimates,
no control for fixed and random effects
HappinessIndex = 5.7*** + 0.005MURDERrate– 0.02SUICIDErate* Random effects regression, R2 (between) = 0.02, N=328.
HappinessIndex = 5.7*** – 1.4e-08Ycap + 0.005MURDERrate– 0.03SUICIDErate**
Random effects regression, R2 (between) = 0.02, N=323.
Here and later the following notations are used: *, **, *** – denotes significance at 10, 5 and 1% level respectively. AFG AFG AFGAFG ALB ALB ALB ALB ALB ALB ALB ALB ALB DZA DZA DZA DZA
DZADZADZA
DZA DZAAGO AGO ARG ARG ARM ARM ARM ARM ARMARMARMARMARMARMARM AUS AUS AUS AUS AUS AUS AUS AUS AUS AUS AUS AUT AUT AUT
AUTAUTAUTAUT
AUT AUT
AUTAUTAUTAUT
AUT AUT AUTAUT AZE AZE AZE AZE AZE AZE AZE AZE BHR BHR BHR BHR BHR BHR BGD BGD BGD BGD BGD BGD BGD
BGDBGDBGD
BGD BLR BLR BLR BELBEL BEL BEL BEL BEL BEL BEL BEL BEL BELBELBELBELBELBEL
BLZ BLZ BLZBLZ BEN BTN BTN BTNBOL BOL BOL BOL BOL BOL BOL BOL BOL BOL BIH BIHBIH BIH BIH BIH BIH BIH BIH BIH BWA BWA BWA BRA BRA BRA BRA BRA BRABRA
BRABRABRABRABRA
BGR BGR BGR BGR BGR BGR BGR BGR BGR BGR BGRBGR BGR BGR BGR BGR
BFABFABFA
BFA BFA
BFABFA
BFA
BFABDIBDIBDIBDI
BDI BDIBDI KHM KHM KHM KHM KHM KHMCMR CMR CMR CMR CMR CAN
CANCANCAN
CAF TCD TCD CHL CHL CHL CHL CHL CHL CHL CHL CHL CHLCHL CHN CHN CHN CHN CHN CHN CHN CHN CHN CHN CHN CHN CHN COL COL COL COL COL COL COL COL COL COL COL COL COL COL COM COM COD COG CRI CRI CRICRI CRI
CRICRICRICRICRI
CRI CRI
CRICRICRI
CIV HRV HRV HRVHRV HRV HRV HRV HRV HRV HRVCUB CYP CYP CYP CYP CYP CYP CYP CYPCYP CYP CYPCYP CYP CYP CYP CYP CZE CZE CZE CZE CZECZE CZE CZE CZE CZE CZE CZE CZE CZE CZE CZE DNK DNK DNKDNK DNKDNK
DNKDNKDNKDNKDNKDNKDNK DNK DNK DNK DNK DJI DJI DOM DOM DOM DOM DOM DOM DOM DOM DOM ECU ECU ECU ECUECU ECU ECU ECU ECU ECU ECU ECU ECU ECU ECU EGYEGY EGY EGY EGY EGY EGY SLV SLV SLV SLV SLV SLV SLV SLV SLV SLV SLV
SLV SLV SLV
ESTESTEST
ESTEST ESTEST EST EST EST EST EST EST EST EST ETH ETH FIN FIN FIN FIN FIN FIN
FINFINFIN
FIN FIN FIN FIN FIN FIN FIN FIN FRA FRAFRA FRA FRA FRA FRAFRA FRA FRA FRA FRA FRA FRA
FRAFRAFRA
GAB GAB GEOGEO GEO GEO GEO GEO GEO DEU DEU DEU DEU DEU DEU DEU DEU DEU DEU DEU DEU DEU DEUDEU DEUDEU GHA GHA GHA GHA GHA GHA GRC GRCGRC GRCGRC GRC GRCGRC GRC GRCGRC GRC GRC GRC GRC GRC GTM GTM GTM GTM GTM GTM GTM GTM GTM GTM GTM GTM GTM GTM GIN GIN GUY GUY GUY HTI HTI HNDHND HND HND HND HND HND HND HND HND HND HND HND HND HND HKG HKGHKG HKG HKG
HKGHUNHUN
HUN HUN HUN HUN HUN HUN HUN HUN HUN HUNHUN HUN HUN HUN ISLISL ISL IND IND IND IND IND IND IND IND IND IND IND IND IDN IDN IDN IDN IDN IDN IDN IDN IDN
IRN IRQ IRQ
IRQ
IRQIRQ
IRLIRLIRL
IRL
IRLIRLIRL
IRL IRL IRL IRL IRLIRLIRLIRL
IRLIRLISRISR
ISR
ISRISRISR
ISR ISR ISR ITA ITA ITA ITA ITA ITAITA ITA ITA ITA ITA ITA ITA ITA ITA ITA
ITA JAMJAM JAM
JAM JAM JAM JPN JPN JPN JPN JPN JPN JPNJPN JPN JPN JPN JPN JPN JPN JPN JORJOR JOR JOR JOR
JORJORJOR
JORJOR JOR JOR KAZ KAZ KAZ KAZ KAZ KAZ KAZ KAZ KEN
KENKENKEN
KEN KENKEN KEN KEN KEN KOR KOR KOR KOR KOR KOR KOS KOS KOS KOS KOS KOS KOS KOS KOS KWTKWT
KWTKWTKWT
KWT KGZ KGZ KGZ KGZ KGZ KGZ KGZ KGZKGZKGZKGZLAOLVALVALVALVA
LVALVA LVA LVA LVA LVA LVA LVA LVA LVA LVA LBN LBN LBN LBN LBNLBN LBN LBN LBN LSO LSO LSO LBR LBR LBRLBR LBY LBY LTU
LTULTULTULTU
LTU LTULTU LTU LTU LTU LTU LTU LTULTU LTU
LUXLUXLUX
LUX LUXLUX LUX LUXLUX LUXLUX LUX LUX LUX LUX MKD MKD MKD MKD MKD MKD MKD MKD MDG MYSMYS MYS MYS MYS
MYSMYSMYS
MLI MLI MLT MLT MLT MLT MLT MLTMLTMLTMLTMLTMLT MLT MLT MLT MLT MRT MRT MUS MUS
MUSMUSMUS
MEX MEX MEX MEXMEX MEXMEX MEX MEX MEX MEX MEX MDA MDA MDA MNG MNGMNG MNG MNG MNGMNG MNG MNG MNE MNE MNE MNE MNE MNE
MNEMNEMNEMNE
MAR MAR MAR MAR MAR MARMAR MAR MAR MOZ MOZMOZ MOZ MMR MMR MMR MMR MMR MMR MMR NAM NPLNPL NPL NPL NPL NPL NPL NPL NPL NPL NLDNLD NLD NLD NLD NLD NLDNLDNLDNLDNLDNLDNLD NLD NLD NLD NLD NZL NZL NZL NZL NICNIC NIC NICNIC NIC NIC NIC NIC NIC NIC NIC NIC NIC NIC NER NER NGA NGA NORNOR NOR NOR NOR NOR NOR OMNOMN PAK PAK PAK PAK PAK PAK PAK PAK PAK PAK PAK PAK PAN PAN PAN PAN PANPAN PANPAN PAN PAN PAN PRY PRY PRY PRY PRY PRY PRY PRY PRY PRY PRY PRY
PERPERPERPER
PHL PHL PHL PHL PHL PHL
PHLPHLPHL
POL POL POL POL POLPOL POL POL POL POL POL POL POL PRT PRTPRT PRT PRT PRT PRTPRT PRT PRT PRT PRT PRT PRT PRT PRT PRT PRI QAT QAT QAT
QATQATQATQAT
ROU ROU ROU ROU ROU ROU ROU ROUROU ROUROU ROUROU ROU ROU ROU ROU RUS RUS RUSRUS RUS RWA RWA RWA RWARWA RWA SAU SAU SAU SEN SEN SRB SRB SRB SRBSRB SLESLE SLE SLE SLE SLE SGP SGP SGP SGP SGP SVK SVK SVK SVK SVK SVK SVKSVK SVK SVK SVK
SVKSVKSVK
SVKSVK SVNSVN SVNSVN SVN SVNSVN SVN
SVNSVNSVNSVN
SVN SVN SVN SVN SOM SOM ZAF ZAF ZAF ZAF ZAF ZAF ZAFZAF ESP ESP ESP ESP ESP ESP ESP ESP ESP ESP ESP ESP ESP
ESPESPESP
ESP LKA LKA LKA LKA LKA LKA LKA LKA LKA LKASDN SWE SWESWE SWESWE SWE SWESWE SWE SWE SWE SWE SWE SWE SWE SWE SWE CHE CHE CHE CHECHE CHE CHE CHE CHE CHE CHE CHE CHE CHE SYR SYR SYR TWN TWN TWN TWN TWN TWN TJK TJK TJK TJK TJK TJK TZA TZA TZA TZA TZA TZA THA THA THA THA THA THA THA THA THA THA THA TGO TTO TTO TUN TUNTUN TUN TUR
TURTURTURTUR
TUR TUR TUR TUR TUR UGA
UGAUGAUGA
UGA UGA UGA UGA UGA UKR UKR ARE ARE ARE GBR GBRGBR GBR GBR GBR GBR GBR GBR GBR GBR GBR GBR GBR GBR
GBRGBRUSAUSAUSA
USAUSA USA USA USA USA USA USA USA USA
USAUSAUSA
URY URY URY URY URYURY URYURY URY URY
URYURYURYURY
UZB
UZB UZB
VEN VEN
VEN
VEN VENVENVENVENVEN
VEN VEN VNM
VNMVNMVNMVNMVNM VNM
YEMYEMYEM
YEM YEMYEM ZMB ZMB ZMB ZMB ZMB ZMB ZMB ZWE ZWEZWE 2 4 6 8 10
0 20 40 60 80 100
Intentional homicide rate (Wikipedia)
7
Figure 4: Happiness index in 2018 and suicide rates in 2016
Figure 5: Happiness index and suicide rates in 2000-18
Source: WHO; World Happiness Database.
Afghanistan Albania Algeria Angola Argentina Armenia Australia Austria Azerbaijan Bahrain Bangladesh Belarus Belgium Belize Benin Bhutan Bolivia
Bosnia and Herzegovina
Botswana Brazil Bulgaria Burkina Faso Burundi Cambodia Cameroon Canada
Central African Republic Chad Chile China Colombia Congo (Brazzaville) Congo (Kinshasa) Costa Rica Croatia Cyprus Czech Republic Denmark Dominican Republic Ecuador Egypt El Salvador Estonia Ethiopia Finland France Gabon Georgia Germany Ghana Greece Guatemala Guinea Haiti HondurasHungary Iceland India Indonesia Iran Iraq Ireland Israel Italy Jamaica Japan Jordan Kazakhstan Kenya Kuwait Kyrgyzstan Laos Latvia Lebanon Lesotho Liberia Libya Lithuania Luxembourg Macedonia Madagascar Malawi Malaysia Mali Malta Mauritania Mauritius Mexico Moldova Mongolia Montenegro Morocco Mozambique Myanmar Namibia Nepal Netherlands New Zealand Nicaragua Niger Nigeria Norway Pakistan Panama Paraguay Peru Philippines Poland Portugal Qatar Romania Russia Rwanda Saudi Arabia Senegal Serbia Sierra Leone Singapore Slovakia Slovenia Somalia South Africa South Korea South Sudan Spain Sri Lanka Sudan Sweden Switzerland Syria Tajikistan Tanzania Thailand Togo Trinidad & Tobago
Tunisia
TurkeyTurkmenistan
Uganda Ukraine United Arab EmiratesUnited KingdomUnited States
Uruguay Uzbekistan Venezuela Vietnam Yemen Zambia Zimbabwe 3 4 5 6 7 8
0 10 20 30 40
Suicide rate per 100,000 inhabitants in 2016
Happiness score in 2018 Fitted values
AFG AFG AFG ALB ALB ALB DZA DZA DZA AGO AGO ARG ARGARGARG
ARMARMARM
AUS AUS AUT AUT AUT AUT AZE AZE AZE BHRBHR BHR BGD BGD BGD BLR BLRBLR BEL BEL BELBEL BLZ BLZ BEN BEN BTN BTN BOL BOL BOL BOL BIHBIH BIH BWA BWA BWA BRABRA BRA BGR BGR BGR BFA BFA BFA BDIBDI KHM KHM KHM CMR CMR CMR CAN CAN CAN CAF CAF CAF TCD TCD TCD CHL CHL CHL CHL CHN CHN CHN COL COL COL COL
COMCOMCOM COD COD COG COG CRI CRI CRI CRI CIVCIV HRV HRV HRV CYP CYP CYP CZE CZE CZE DNK DNK DNKDNK DJI DJI DOM DOM DOM ECU ECU ECU ECU EGY EGYEGY SLV SLV SLV SLV EST ESTEST ETH ETH ETH FIN FIN FINFIN FRA FRA FRA FRA GAB GAB GAB GEOGEOGEO
DEU DEU DEU DEU GHAGHA GHA GRC
GRCGRCGRC GTM GTM GTM GTM GIN GIN GIN GUY HTIHTI HTI HND HND
HNDHND HUN HUN
HUN ISLISL IND IND IND IDN IDN IDN IRN IRN IRQ IRQ IRQ IRL IRL IRLIRL ISR ISRISR ITA ITAITAITA JAM JAM JAM JPN JPN JPN JOR JOR JOR KAZ KAZ KAZ KEN KENKEN KOR KOR KOR KWT KWT KWT KGZ KGZKGZ LAO LAO LVA LVA LVA LBN LBN LBN LSO LSO LBR LBR LBR LBY LBYLBY LTU LTU LTU LUX LUX LUX LUX MKD MKD MKD MDG MDG MWI MWI MYS MYSMYS MLIMLI MLI MLT MLT MLT MRT MRT MRT MUS MUS MEX MEX MEX MDA MDA MDA MNG MNG MNG MNE MNEMNE MAR MAR MAR MOZ MMR MMRMMR NAM NAM NPL NPL NPL NLD NLD NLD NLDNZLNZL NIC NIC NIC NIC NER NER NER NGA NGA NGA NOR NOR OMN PAK PAK PAK PAN PANPAN PRY PRY PRY PRY PER PER PER PER PHL PHL POL POLPOL PRT PRT PRT PRT QAT QAT QAT ROU ROU ROU ROU RUS RUS RWA RWA SAU SAU SAU SEN SEN SEN SRBSRB SLE SLESLE SGPSGP SVK SVK SVK SVN SVN SVN SOM SOM SOM ZAF ZAF ESP
ESPESPESP
LKA LKA LKA SDN SDN SDN SUR SUR SUR SWE SWE SWE SWE CHE CHE CHE CHE SYR SYR SYR TJK TJK TJK TZA TZATZA THATHA THA TGO TGO TTOTTO TUN TUN TUN TUR TUR TURTKM TKM UGA UGA UGA UKR UKR ARE ARE GBR GBR GBR GBR
USAUSAUSA URY URY URY URY UZB UZB UZB VEN VEN VEN VEN VNM VNM VNM YEM YEM YEM ZMB ZMB ZWE ZWE ZWE 2 4 6 8
0 10 20 30 40 50
Age-standardized suicide rates (WHO)
[image:8.612.76.423.397.655.2]8
[image:9.612.74.418.113.360.2]Figure 6: Murder rate per 100,000 inhabitants and Gini coefficient of income distribution in percentage terms in 2000-18
Figure 7: Suicide rate per 100,000 inhabitants and GINI coefficient of income inequality in percentage terms in 2000-18
Source: WHO, WDI.
ALB ALB ALB ALB DZA ARGARG ARM ARM ARMARMARM ARMARM
ARM ARMARMARMARMARMARMARMARMAUSAUSAUSAUS
AUTAUT
AUTAUTAUTAUTAUTAUTAUTAUTAUTAUTAUT AZE AZEAZE
AZEAZE BGDBGDBGD BLR BLR BLR BLR BLRBLRBLRBLRBLRBLRBLRBLR
BLRBLRBLRBELBELBELBELBELBELBELBELBELBELBELBELBEL BEN BTN
BTNBTN BOLBOL
BOL BOL BOL BOLBOL BOLBOL BOL BOL BIHBIHBIHBIHBIH
BWA BWA BRA BRA BRA BRA BRA BRA BRA BRA BRA BRA BRABRA BRA BRA BGRBGR
BGRBGRBGRBFABGRBGRBGRBGRBDI CMR
CANCANCANCANCAN CHNCHN CPVCHLCHLCHLCHLCHLCHL
COL COL COL COL COL COL COL COLCOL COL COL COL COL COL COL COG CRICRICRICRICRICRICRICRICRICRICRICRICRICRICRICRICRI CIV HRV HRV HRVHRV HRVHRV HRV CYPCYPCYPCYPCYPCYPCYPCYPCYPCYP CYPCYP CZE
CZE CZE CZECZECZECZECZE CZECZE CZE CZE DNK DNKDNKDNKDNKDNKDNKDNKDNKDNKDNKDNKDNK
DOM DOM DOM DOM DOM DOM DOM DOM DOMDOM DOMDOM DOM DOM DOMDOM ECU ECUECU ECU ECUECU ECU ECUECU ECU ECUECU ECUECU ECU EGY EGYEGY EGY SLV SLV SLV SLV SLVSLV SLV SLV SLV SLV SLV SLV SLVSLV SLV SLV SLV EST EST ESTEST ESTESTESTESTESTESTESTESTEST
ETH ETH FJI FJI FINFIN
FINFINFINFIN FINFINFIN FINFIN
FINFINFRA FRAFRAFRAFRAFRAFRAFRAFRAFRAFRAFRAFRA
GABGMB GMB GEO GEO GEO GEO GEOGEOGEOGEOGEO
GEOGEO GEO GEO
DEUDEUDEUDEUDEUDEUDEUDEUDEUGRCGRCGRCGRCGRCGRCGRCGRCGRCGRCGRCGRCGRC GHA
GTM GTM GTM GNB HTI HNDHND HND HND HND HND HND HND HND HND HND HND HND HND HND HUN HUN HUN HUN HUN HUNHUNHUNHUNHUNHUNHUN ISLISLISLISLISL ISLISL ISLISLISL
ISL ISL INDIRNIRNIDNIRN IRQ
IRLIRLIRL IRL IRL
IRLIRLIRLIRLIRLIRLITAIRLIRLITAITAITAITAITAITAITAITAITAITAITAITA ISR ISRISRISRISR
JAM JAM
JPNJORJORJOR KAZ KAZ KAZ KAZ KAZ KAZ KAZ KAZKAZ KAZ KAZ
KAZ KEN KEN
KORKOS KOS KOSKOS KOSKOSKOSKOS
KGZ KGZKGZ
KGZKGZKGZKGZKGZKGZKGZ KGZ
KGZ KGZKGZ KGZKGZ
KGZ LBNLVALVALVALVALVALVALVALVALVALVALVALVA
LSO
LBR LTU LTU LTULTULTULTU LTU LTU LTULTULTULTU LUX
LUXLUXLUXLUXLUXLUXLUXLUXLUXLUXLUXMKDMKDMKDMKDMKDMKD MDGMDG MWIMYSMDVMYSMWIMYSMYSMYS MDV
MLTMLTMLTMLTMLTMLTMLTMLTMLTMLT
MRT MUSMUS MEX MEX MEXMEX MEX MEX MEX MEX MEXMEX FSM MDAMDA MDA MDAMDAMDAMDA MDAMDA MDA MDA MDA MDA MDA MDA MCO MCO MNG MNGMNGMNG MNGMNG MNE MNEMNEMNEMNE
MNEMNEMNEMNEMNE MMR MOZMOZ
NAM
NPL NPL
NLD NLDNLDNLDNLD NLD NLD NLD NLDNLDNLDNLD
NIC NIC NIC
NIC NER
NORNORNOR NORNOR NOR NOR
NORNORNORNORNORPAKPAKPAKPAK PAKPAKPAK
PAK PANPAN PAN PAN PAN PAN PAN PAN PAN PAN PAN PANPAN PAN PAN PAN PAN
PRY PRYPRY PRY PRY PRY PRY PRY PRYPRY PRY PRYPRY PRY PRY PER PER PER PERPERPER PRTPRT PRT PRT PRT PRT PRTROUPRTPRTROUPRTROUROUROUPRTPRTPRTROUROUROUROUROU
RUS RUSRUSRUS RUS RUS RUSRUS RUS RUSRUS RUS RUS RWA RWA STP SEN SYC SLE SVKSVK SVK SVKSVNSVKSVKSVKSVKSVKSVKSVKSVK SVN SVN SVN
SVNSVNSVNSVNSVNSVNSVNSVN SLB
ZAF
ZAF ZAF
ZAF ZAF
ESPESPESPESPESPESPESPESPESPESPESPESPESP LKA LKALKA
LKA SWESWESWESWESWESWESWESWESWESWESWESWESWETJKCHECHETJKCHE SYRCHECHECHETJKCHETJKCHECHECHE
TZATHATHATHATHATHATHATHATHA THATHATHA THA THA
TLS TONTON TGO TUN TUNTURTURTURTURTURTURTURTURTURTUR
UGAUGA UGA UKR
UKRUKRUKRUKR UKR UKR UKR UKR UKR UKR GBR GBRGBRGBR GBRGBRGBR GBR
GBRGBRGBRGBR USAUSA USA USAUSAUSAURYURYURYURYURYURY URYURYURYURY URY UZB UZBUZBVUT VEN VEN VEN VENVEN VEN VNM VNM VNM VNM VNM
YEM ZMBZMB
0 20 40 60 80 1 0 0
20 30 40 50 60 70
GINI Index (World Bank Estimate)
Intentional homicide rate 95% CI Fitted values AGO ARG ARG ARG ARMARMARM AUS AUTAUT BGD BGDBGD BLR BLR BLRBLR BEL BEL BEN BOL BOL BOL BIH BRA BGR
CANCAN CHL
CHL
COL COL COL COL CRICRICRICRI CIV HRV HRV CYPCYP CZE CZE
DNKDNK DOMDOMDOM DOM ECU ECU ECU ECU EGYEGY SLV SLV SLV SLV EST EST ETH ETH FIN FIN FRA FRA GMB GMB GEO GEO GEOGEO DEU DEUDEU
GRCGRC GTM
GNB HND HND HUN HUN ISL IRL IRL ISR ITAITA JOR KAZ KAZ KEN KOR KGZ KGZ KGZ KGZ LVA LVA LSO LTU LTU LUX LUX MKD MDG MWI MYS MLTMLT MRT
MEX MEXMEX MDA MDA MDA MDA MNG MNG MNE MMR NAM NPL NLDNLD NORNOR PAK PAK PAN PAN PAN PAN PRY PRYPRY PER PER PERPER PRT PRT ROU ROU RUS RUS RUS RWA RWA STP STP SVK
SVNSVN ZAF
ZAF
ESPESP LKA SWESWECHECHE
TJK TZA THA THA THA TGO TUN TUN
TURTURTUR UGA UKR UKR UKR GBR GBR USA USAUSA URY URY URY UZB VUTVNM VNM ZMBZMB 0 10 20 30 40 50
20 30 40 50 60 70
GINI Index (World Bank Estimate)
9
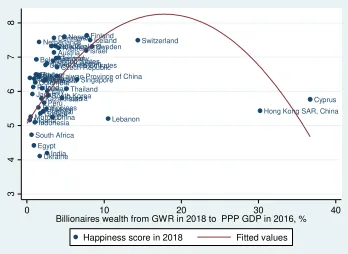
Wealth inequalities, especially inequalities at the very top of the wealth pyramid – the share of wealth belonging to billionaires and millionaires – are positively correlated with happiness indices (fig. 8-10).
It is important to note that inequalities at the very top –billionaire and millionaire ‘intensity’, the ratio of billionaire/millionaire wealth to GDP – are not precisely correlated with general measures of inequalities like Gini coefficients. Whereas Gini coefficients for wealth and income distribution
are positively correlated with one another (fig. 12), and billionaire intensity is positively correlated
with Gini coefficients for wealth distribution (fig.13), the correlation of billionaire intensity with
general income-distribution Gini coefficients is negative, if present at all (fig. 14). That is to say,
there are countries with quite an even distribution of income, but levels of high billionaire intensity
in GDP; e.g., Scandinavian countries.
Figure 8: Happiness index (0-to-10 scale) and billionaire wealth from the Global Wealth Report as a percentage of PPP GDP in 2018
Argentina Australia Austria Belgium
Brazil Canada
Chile
China Colombia
Cyprus Czech Republic
Denmark
Egypt
Finland
France Germany
Greece Hong Kong SAR, China
Iceland
India Indonesia
Ireland Israel
Italy Japan
Kazakhstan Kuwait
Lebanon Malaysia
Mexico
Morocco Netherlands
New Zealand
Nigeria
Norway
Peru Philippines Poland
Portugal Russia Saudi Arabia Singapore
South Africa South Korea Spain
Sweden Switzerland
Taiwan Province of China
Thailand
Turkey
Ukraine
United Arab EmiratesUnited KingdomUnited States
3
4
5
6
7
8
0 10 20 30 40
Billionaires wealth from GWR in 2018 to PPP GDP in 2016, %
[image:10.612.80.428.407.661.2]10
[image:11.612.77.487.114.377.2]Figure 9: Happiness index (0-to-10 scale) and billionaire wealth from the Forbes list as a percentage of PPP GDP in 2018
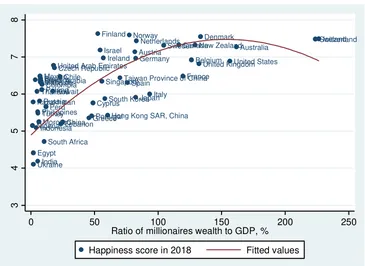
Figure 10: Happiness index (on a scale of 0 to 10) and net worth of millionaires according to the Global Wealth Report as a percentage of PPP GDP
Argentina Australia
Austria Belgium
Brazil Canada
Chile
China Colombia
Cyprus Czech Republic
Denmark
Egypt Finland
France Germany
Greece Hong Kong SAR, China
Iceland
India Indonesia
Ireland Israel
Italy Japan
Kazakhstan Kuwait
Lebanon Malaysia
Mexico
Morocco Netherlands
New Zealand
Nigeria Northern Cyprus
Norway
Palestinian Territories Peru
Philippines Poland
Portugal Russia Saudi ArabiaSingapore
Somalia South Africa
South Korea
South Sudan Spain
Sweden Switzerland
Taiwan Province of China
Thailand
Turkey
Ukraine
United Arab EmiratesUnited KingdomUnited States
3
4
5
6
7
8
0 20 40 60
Net wealth of billionaires as a % of GDP in 2018
Happiness score in 2018 Fitted values
Argentina
Australia Austria
Belgium
Brazil
Canada
Chile
China Colombia
Cyprus Czech Republic
Denmark
Egypt
Finland
France Germany
GreeceHong Kong SAR, China
Iceland
India Indonesia
Ireland Israel
Italy Japan Kazakhstan
Kuwait
Lebanon Malaysia Mexico
Morocco
Netherlands New Zealand
Nigeria
Norway
Peru Philippines
Poland
Portugal Russia
Saudi Arabia Singapore
South Africa
South Korea Spain
Sweden Switzerland
Taiwan Province of China
Thailand
Turkey
Ukraine
United Arab Emirates United KingdomUnited States
3
4
5
6
7
8
0 50 100 150 200 250
Ratio of millionaires wealth to GDP, %
[image:11.612.77.442.445.711.2]11
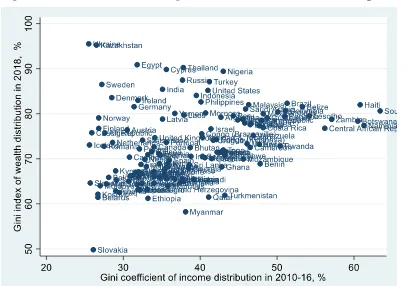
Figure 11: Happiness index (on a scale of 0 to 10) and Gini coefficient of wealth distribution in 2018, percentage terms
Source: GWR; World Happiness Database; WDI; Forbes billionaires’ list.
Figure 12: Income and wealth inequalities, Gini coefficients in 2000-18, percentage terms Argentina
Australia
Austria Belgium
Brazil Canada
Chile
China
Colombia
Cyprus Czech Republic
Denmark
Egypt Finland
France
Germany
Greece Hong Kong SAR, China Iceland
India Indonesia Ireland Israel
Italy Japan
Kazakhstan Kuwait
Lebanon Malaysia
Mexico
Morocco Netherlands New Zealand
Nigeria Norway
Peru
Philippines Poland
Portugal
Russia Saudi Arabia Singapore
South Africa South Korea
Spain
Sweden Switzerland
Syria
Taiwan Province of China
Thailand
Turkey
Ukraine United Arab Emirates
United Kingdom United States
3
4
5
6
7
8
50 60 70 80 90 100
Gini index of wealth distribution in 2018, %
[image:12.612.71.482.416.702.2]12
Figure 13: Wealth of billionaires as a percentage of GDP and Gini index of wealth distribution, in percentage terms, in 2018
Figure 14: Gini coefficient of income distribution and ratio of billionaire wealth to PPP GDP, percentage terms
Source: WDI; GWR.
AFGAFGAFGAFGAFGAFG AFGAFGAFGAFGAFG AFG AFG AFGAFG AFG AFG ALBALB ALBALBALB ALBALB ALB
ALBALBALBALBALBALBALBALBALBALBALBAUSARMARMARMARMARMARMARMARMARMARMARMARMARMARMARMARMARMARMARMAGOAGOAGOAGOAGOAGOAGOAGOAGOAGOAGOAGOAGOAGOAGOAGOAGOAGOARGARGAGOARGDZAARGDZAARGDZAARGARGARGARGARGDZAARGARGARGARGDZAARGDZADZADZADZADZAARGDZAARGDZADZADZAARGDZADZADZAARGDZAATGDZAATGATGATGATGATGATGATGATGATGATGATGATGATGATGATGATGATGATG AUS
AUSAUSAUS AUS AUSAUS
AUS AUS
AUSAUSAUS AUS AUS AUS AUS AUS AUS AUTAUT AUT AUT AUT AUT AUT AUT AUT AUTAUTAUT AUT AUT AUT AUT AUT AUT AUT AZEAZE AZE AZE AZE AZEAZEAZE AZEAZEAZEAZEAZEAZE AZE AZEAZE AZE
AZEBGDBGDBGDBGDBGDBGDBGDBGDBGDBGDBGDBGDBGDBGDBGDBGDBGDBGDBGDBRBBRBBRBBRBBRBBRBBRBBRBBRBBRBBRBBRBBHRBHRBHRBRBBRBBRBBHRBRBBRBBHRBRBBHRBRBBHRBHRBHSBHRBHSBHSBHRBHRBHSBHSBHSBHRBHRBHRBHSBHSBHSBHSBHSBHRBHRBHSBHRBHRBHSBHRBHSBHSBHSBHSBHSBHS BLRBLR
BLR BLRBLR BLRBLRBLRBLRBLRBLRBLRBLRBLRBLRBLRBLRBLRBLRBELBELBELBELBEL
BEL BELBEL BELBELBELBEL BELBELBELBELBELBELBEL
BLZ BLZ BLZ BLZBLZBLZBLZBLZBLZ BLZBLZBLZBLZBLZBLZBLZBLZBLZBLZ BEN
BEN
BENBENBENBENBENBENBENBENBENBENBENBENBENBENBENBENBENBTNBTNBTNBTNBTNBTNBTNBTNBTNBOLBTNBTNBOLBTNBOLBOLBTNBOLBOLBOLBTNBOLBTNBOLBTNBOLBTNBOLBTNBTNBOLBOLBOLBOLBOLBOLBOLBOL BIH BIH BIH BIHBIH BIHBIH BIH
BIHBIHBIHBIHBIHBIHBIHBIHBIHBIHBIH BWABWABWABWABWABWABWABWABWABRABWABWABWABWABWABWABWABWABWABRABRABRABWABRA BRA BRA BRA BRA BRA BRA BRABRA BRA BRA BRA BRA BRA BRA
BRNBRNBRNBRNBRNBRNBRNBRNBRNBRNBRNBRNBRNBRN BRN BRNBRN BRN BRN BGRBGR BGR BGRBGR BGRBGRBGR
BGRBGRBGRBGRBGRBGRBGRBDIBDIBGR BFABGRBDIBDIBGRBDIBDIBDIBDIBDIBDIBDIBGRBDIBDIBDIBDIBDIBDIBDIBDIBFABFABFABFABFABFABFABFABFABFABFABFABFABFABFABFABFAKHMKHMKHMKHMBFACMRCMRCMRCMRCMRKHMKHMKHMKHMCMRCMRCMRCMRKHMKHMKHMCMRCMRCMRCMRCMRKHMKHMCMRKHMKHMCMRKHMCMRKHMKHMCMRKHMCMR CAN CAN CANCAN CAN CAN CAN CAN CAN CAN CAN CANCANCAN
CANCANCANCANCAN
CPV CPV
CPVCPVCPVTCDCPVTCDTCDTCDTCDTCDTCDTCDTCDTCDTCDCPVTCDCPVTCDTCDTCDCPVCPVTCDTCDCPVTCDCPVTCDCPVCAFCPVCAFCAFCAFCPVCAFCPVCAFCPV CPVCAFCAFCAFCAFCAFCAFCAFCPVCAFCAFCAFCAFCAFCAFCHLCHL CHL CHL CHL CHLCHL CHL CHL CHL CHL CHL CHL CHL CHL CHL CHL CHL CHL CHN CHN
CHNCHNCHNCHNCHNCHNCHN CHN CHN CHNCHNCHN CHNCHN CHN CHN CHN COLCOL COLCOL COLCOL COL COL COL COL COL COL COL COLCOLCOLCOL COL COL COM COM COMCOMCOMCOMCOMCOMCOMCOMCOMCOMCOMCOMCOMCOMCOMCOMCOM COD COD CODCODCODCODCODCODCOD CODCODCODCODCODCODCODCODCOD CODCOGCOGCOGCOGCOGCOGCOGCOGCOGCOGCOGCOGCOGCOGCOGCOGCRICOGCOGCOG CRI CRI CRICIVCRICRICIVCRICIVCIVCIVCIVCIVCIVCIVCIVCRI CRICRI CRICIVCIVCRICIVCRICIVCIVCIVCRICRICIVCIVCIVCRICRICRICRI HRV HRV HRV HRVHRV HRVHRV HRV
HRVHRVHRVHRVHRVHRVHRVHRVHRVHRVHRV CYPCYPCYPCYPCYPCYP CYP CYP CYP CYP CYP CYP CYP CYP CYP CYP CZECZE CZECZECZE
CZE CZE
CZE
CZE
CZECZECZECZE CZECZECZE
CZE CZECZE DNK DNK DNK DNK DNK DNK DNK DNK DNK DNK DNKDNKDNK
DNK DNK DNK DNK DNK DNK DJI DJI
DJIDJIDJIDJIDJIDJIDJIDJI DJIDJIDJIDJIDJIDJIDJIDJIDJIECUECUECUECUDOMDOMECUECUDOMDOMECUDOMECUDOMECUECU ECUECUDOMDOMDOMECUEGYDOMDOMDOMDOMECUDOMECUDOMECUDOMEGYDOMDOMECUDOMEGYECUECUEGYDMADMADMADMADMADMADMADMADMADMADMADMADMADMADMADMADMADMADMA EGY EGYEGY
EGY
EGYEGYEGYEGYEGY EGYEGY EGY
EGY EGYEGY SLV
SLV SLV SLVSLV SLVSLV SLV SLV
SLVERISLVSLVSLV SLV GNQSLVSLVSLVSLVERISLVERIERIERIERIERIERIERIERIERIERIERIGNQGNQGNQGNQGNQGNQGNQGNQGNQGNQGNQGNQGNQGNQGNQGNQGNQGNQ ERIERI
ERI ERI ERI
ERIESTESTESTESTESTESTESTESTESTESTESTESTESTESTESTESTESTESTEST ETH
ETH ETHETHETHETHETHETHETH ETHETHETH ETHETHETH ETH ETH ETH
ETH FJIFJIFJIFJIFJIFJIFJIFJIFJIFJIFJIFJIFJIFJIFJIFJIFJIFJIFJI FINFINFINFINFINFINFINFINFIN FIN FINFIN
FIN FINFIN FIN FIN FINFIN FRAFRA FRA FRA FRA FRA FRA FRAFRA FRAFRA FRAFRA
FRAFRAFRAFRA FRA FRA
GAB GAB
GABGEOGABGABGABGEOGEOGABGABGEOGABGABGABGABGABGEOGEOGABGEOGABGEOGABGABGEOGEOGEOGEOGEOGEOGABGABGMBGMBGMBGMBGMBGMBGMBGMBGMBGMBGMBGMBGMBGMBGMBGMBGMBGMBGMB GEO GEOGEO GEO GEO DEU DEU DEU DEUDEUDEU DEUDEU DEU DEU DEU DEU DEU DEU DEU DEUDEU DEU DEU GHA GHA GHAGHAGHAGHAGHAGHAGHA GHAGHAGHAGHAGHAGHAGHAGHA GHA GHA GRC GRCGRC GRC GRC GRC GRC GRC GRC GRC GRC GRCGRC GRCGRC GRC GRC GRC GRC GRD GRD GRDGRDGRDGRDGRD GRD GRD GRDGRDGRDGRDGRDGRDGRDGRDGRDGRD GTM GTM GTMGTMGTMGTMGTM GTM GTM GTMGTMGTMGTMGTMGTMGTMGTMGTMGTM GIN
GIN GINGINGINGINGINGIN GIN GINGINGINGINGINGINGINGINGINGIN GNB GNB
GNBGNBGNBGNBGNBGNBGUYGUY GUYGNBGNBGNBGUYGUYGNBGNBGNBGNBGNBGUYGUYGUYGNBGUYGUYGUYGUYGUYGNBGUYGUYGNBGUYGUYGUYGUYHNDHND HNDHNDHNDHNDHNDHNDHNDHNDHNDHNDHTI HTIHTIHTIHTIHNDHNDHTIHNDHTIHTIHTIHTIHTI HTIHTIHNDHTIHTIHTIHNDHTIHNDHNDHTIHTI HKG
HKG HKG
HKGHKGHKGHKG HKG HKG HKG HUN HUN HUN HUNHUN HUNHUN HUN HUNHUNHUNHUNHUNHUNHUNISLHUNHUNHUNISLISLHUNISL
ISL ISL ISL ISL ISL ISL ISL ISL ISL ISL ISL ISL ISL ISL ISL IND IND INDIND INDIND IND IND IND IND IND INDINDIND
IND INDINDINDIND
IDN IRNIRNIRNIRNIRNIRNIRNIRNIRNIRNIRNIRNIRNIRN IRN IRNIRN IRN IRN IRQIRQIRQIRQIRQIRQIRQIRQIRQIRQIRQIRQIRQIRQ IRQ IRQIRQ IRQ IRQ IRLIRL IRL IRL IRLIRL IRL IRL IRL IRL IRL IRL IRL IRL IRL IRL IRL IRL IRL ISR ISR ISR ISRISR ISR ISR ISR ISR ISR ISR ISR ISR ISR ISR ISR ISR ISR ISR ITA ITA ITAITAITAITAITAITA ITAITAITAITA
ITA ITA ITAITA ITA ITA ITA JAM JAM JAM JAMJAMJAMJAM JAM JAM JAMJAMJAMJAMJAMJAMJAMJAMJAMJAM JPN JPN
JPNJPNJPNJPNJPNJPNJPNJPNJPNJPNJPNJPNJPNJPNJPNJPNJPN
JORJORJORJORJORJORJORJORJORJORJORJORJORJOR JORJORJORJORJOR
KAZKAZKAZKAZ KAZKAZ KAZ KAZ
KAZKAZKAZKAZ KAZKAZKAZ
KAZKAZKAZKAZ
KEN KEN KENKENKENKENKENKENKENKENKENKENKENKENKENKENKENKENKEN KIRKIRKIRKIRKIRKIRKIRKIRKIRKIRKIRKIRKIRKIR KIR KIRKIR KIR KIR KOR KORKORKOR KORKORKORKOR KOR
KORKORKOR KOR KORKOR KOR KOR
KOR KOR
KOSKOSKOSKOSKOSKOSKOSKOSKOSKOSKOSKOSKOSKOSKOSKOSKOSKOSKOS
KWT KWT KWT
KWT KWT
KWTKWTKWTKWT KWT
KWT KWTKWTKWTKWTKWTKWTKWTKWT
KGZKGZKGZKGZKGZKGZKGZKGZKGZKGZKGZKGZKGZ KGZ KGZ KGZKGZ KGZ
KGZ LVALAOLAOLVALVALVALVALVALVALVALVALVALVALVALVALVALVALVALVALVALAOLAOLAOLAOLAOLVALAOLAOLAOLAOLAOLAOLAOLAOLAOLAOLAOLAO LBNLBNLBN LBN LBN LBN LBN LBN LBN LBN LBN LBNLBN LBN LBN LBN LBN LBNLBN LSO LSO LSOLSOLSOLSOLSOLSOLSOLSOLSOLSOLSOLSOLSOLSOLSOLSOLSO LBR
LBR LBRLBRLBRLBRLBRLBRLBR
LBRLBRLBRLBRLBRLBRLBRLBRLBYLBRLBYLBRLBYLBYLBYLBYLBYLBYLBYLBYLBY LBY LBY LBYLBY LBY LBY LBY LBY LTU LTU LTU LTULTU LTULTULTU
LTULTULTULTUMKDMKDMKDMKDLTUMKDMKDLTULTUMKDMKDLTU LUXMKDMKDLTULTUMKDMKDMKDLTUMKDLUXMKDLUXLUXLUXLUXLUXLUXLUXLUXLUXMKDLUXMKDLUXMKDMKDLUXLUXLUXLUXLUXLUXMDGMDGMDGMDGMDGMDGMDGMDG MWIMDGMDGMDGMDGMDGMDGMDGMDGMDGMWIMDGMWIMWIMWIMWIMWIMWIMWIMWIMWIMDGMWIMWIMWIMWIMWIMWIMWIMWI MACMACMACMACMACMACMACMACMACMACMACMACMACMACMACMACMACMAC MYS MYS MYS MYS MYSMYS MYS MYS MYS MYS MYS MYS MYS MYS MYS MYSMYS MYSMYS MDVMDV MDV MDV MDVMDVMDVMDV MDVMDVMDVMDVMDVMDV MDV MDVMDV MDV MDV MLI MLI MLIMLIMLIMLIMLIMLIMLI MLIMLIMLIMLIMLIMLIMLIMLIMLIMLI MLT MLT MLT MLTMLT MLTMLT MLT
MLTMLTMLTMLTMLTMLTMLTMLTMUSMLTMLTMUSMUSMLTMUSMUSMUSMUSMUSMUSMUSMUSMUSMUSMUSMUSMUSMUSMUSMRTMRTMUSMRTMRTMRTMRTMRTMRTMRTMRTMRTMRTMRTMRTMRTMRTMRTMRTMRTMHLMHLMHLMHLMHLMHLMHLMHLMHLMHLMHLMHLMHLMHLMHLMHLMHLMHLMHL
MEX MEX MEXMEXMEXMEXMEXMEX MEX MEXMEXMEX
MEX MEX MEX MEXMEXMEXMEX FSMFSMFSMFSMFSMFSMFSMFSMFSMFSMFSMFSMFSMFSM FSM FSMFSM FSM FSM MDA MDA MDA MDAMDA MDAMDA MDA MDA MDA MDA
MDAMDAMDAMDAMNGMDAMDAMDAMNGMNGMNGMDAMNGMNGMNGMNGMNGMNGMNGMNGMNGMNGMNGMNGMNGMNGMNG MNE MNE MNE MNEMNE MNEMNE MNE
MNEMNEMNEMNEMNEMNEMNEMNEMNEMNEMNE MARMARMARMARMARMARMARMARMARMARMAR
MAR MARMARMAR MARMARMAR MAR MOZ
MOZ MOZMOZMOZMOZMOZMOZMOZ MOZMOZMOZMOZMOZMOZMOZMOZMOZ MOZ MMRMMRMMRMMRMMRMMRMMRMMRMMRMMRMMRMMRMMRMMR
MMR MMRMMR MMR
MMR NPLNPLNPLNPLNPLNPLNPLNPLNPLNPLNPLNPLNPLNPLNPLNPLNPLNPLNPLNAMNAMNAMNAMNAMNAMNAMNAMNAMNAMNAMNAMNAMNAMNAMNAMNAMNAMNLDNLDNLDNLDNAM NLD NLD NLD NLD NLD NLD
NLDNLDNLDNLDNLDNLDNLD NLD NLD NZL NZL NZL NZL NZL NZL NZL NZL NZL NZL NZL NZL NZLNZLNZLNZL NZL NZL NZL
NIC NIC NIC NICNIC NICNIC NIC NIC NICNICNIC NICNICNICNICNICNICNIC NER
NER NERNERNERNERNERNERNER NERNERNERNERNERNERNERNERNER
NER NGANGANGANGANGANGANGA NORNORNORNGANGANGANGANGANGANGANGANGANGANGANGA NORNOR NOR NOR NOR NOR NOR NORNOR NOR NOR NOR NOR NOR NOR NOR
OMNOMNOMNOMNOMNOMNOMNOMNOMNOMNOMNOMNOMNOMN OMN OMNOMN OMN OMN PAKPAKPAKPAKPAKPAKPAKPAKPAKPAKPAKPAKPAKPAK
PAK PAKPAK PAK
PAK PERPERPERPERPER PERPLWPLWPLWPLWPRYPLWPERPERPERPRYPRYPANPRYPLWPNGPANPLWPRYPRYPRYPRYPLWPNGPNGPANPRYPLWPNGPRYPLWPLWPLWPANPRYPLWPLWPRYPRYPANPANPANPANPANPERPRYPRYPRYPLWPLWPANPLWPLWPANPLWPANPANPNGPANPNGPANPNGPNGPANPNGPRYPRYPNGPERPNGPNGPANPANPNGPNGPNGPNGPNGPNGPRYPNGPAN PER PER PER PER PER PERPER PER PHL PHL PHL PHL PHLPHLPHL PHL PHL PHLPHL PHL PHL PHL PHL PHL PHL PHL PHL POLPOL POL
POL POLPOL POL POL POL POL POLPOL POL
POL POL POL POLPOLPOL PRT PRTPRTPRT
PRT PRTPRT
PRT
PRT PRTPRTPRTPRTPRTPRTPRT
PRT PRT PRT
PRI PRI PRI PRIPRI PRIPRI PRI PRI PRIPRIPRI PRIPRIPRIPRIPRIPRIPRI QATQATQATQATQATQATQATQATQATQATQATQATQATQAT
QAT QATQAT QAT QAT ROUROU
ROUROUROUROU ROUROUROUROUROUROUROUROUROUROUROUROUROU RUSRUS RUS RUS RUS RUS RUS RUS RUS RUS RUS RUS RUS RUS RUS RUS RUS RUS RUS RWA RWA RWARWASMRRWARWASMRRWASMRSMRRWARWARWARWASMRSMRRWARWARWASMRSMRRWAWSMWSMWSMWSMRWARWAWSMRWAWSMWSMWSMWSMWSMWSMRWAWSMWSMWSMWSMWSMWSMWSMWSM SMRSMRSMRSMRSMRSMRSMRSMRSMRSMRSMR STP
STP STPSTPSTPSTPSTPSTPSTPSTPSTPSTPSTPSTPSTPSTPSTPSTPSTP
SAU SAU SAUSAU SAU SAU SAU SAU SAU SAU SAU SAU SAUSAUSAU SAUSAUSAUSAU SEN
SEN SENSENSENSENSENSENSENSENSENSENSENSENSENSENSENSENSEN SRB SRB SRB SRBSRB SRBSRB SRB
SRBSRBSRBSRBSRBSRBSRBSRBSRBSRBSRBSYCSYCSLESYCSYCSLESYCSLESLESLESLESLESYCSYCSYCSLESLESLESLESYCSLESLESYCSLESLESYCSYCSYCSYCSLESLESLESYCSLESYCSYCSYCSYC
SGP SGP SGP SGP SGPSGP SGP SGP SGP SGP SGP SGP SGP SGPSGP SGP SGP SGP SGP SVK SVK SVKSVKSVK SVKSVK SVK
SVKSVKSVKSVKSVKSVK SVKSVKSVKSVKSVK SVNSVNSVNSVNSVNSVNSVNSVNSVNSVNSVNSVNSVNSVN SVNSVNSVNSVNSVNSLBSLBSLBSLBSLBSLBSLBSLBSLBSLBSLBSLBSLBSLBSLBSLBSLBSLBSLB ZAFZAFZAFZAF ZAF ZAF ZAFZAF ZAFZAF ZAF ZAF ZAFZAF ZAF ZAF ZAF ZAF ZAF ESP ESP ESP ESP ESPESP ESP ESP ESPESP ESP ESPESP
ESP ESPESPESPESP
LKALKALKALKALKALKALKALKA LKALKALKALKALKALKA LKA LKALKA LKA
LKALCALCALCA LCALCALCALCALCALCA LCALCA LCALCALCALCALCALCALCALCA VCTVCTVCTVCTVCTVCTVCTVCTVCTVCTVCTVCTVCTVCTVCTVCTVCTVCTVCT SDN
SDN
SDNSDNSDNSDNSDNSDNSDNSDNSDNSDNSDNSDNSDNSDNSDNSDNSDN SWZSWZSWZSWZSWZSWZSWZSWZSWZSWZSWZSWZSWZSWZSWZSWZSWZSWZSWZSURSURSURSURSURSURSURSURSURSURSURSURSURSURSURSURSURSURSUR SWE SWE SWE SWE SWE SWE SWE SWE SWE SWE SWE SWE SWE SWE SWE SWE SWE SWE SWE CHE CHE CHE CHE CHE CHE CHE CHE CHE CHE CHE CHE CHE CHE CHE CHE CHE CHECHE
SYRSYRSYRSYRSYRSYRSYRSYRSYRSYRSYR TWN TWN TWN TWN TWN TWN TWNTWN TWN TWN TWN TWNTWN TWNTWN TWN TWN TWN TWN
TJKTJKTJKTJKTJKTJKTJKTJKTJKTJKTJKTJK TJK TJK TJK TJKTJK TJK
TJKTZATZATZATZATZATZATZATZATZATZATZATZATZATZATZATZATZATZATZA THATHATHATHA THA THA THA THA THA THA THATHA THATHA
THA
THATHA THA THA
TLS TLSTLSTLSTLSTLSTLSTLSTLSTLSTLSTLSTLSTLSTLSTLSTLSTLSTLS TONTONTONTONTUNTUNTUNTUNTUNTUNTUNTUNTUNTONTUNTUNTUNTUNTUNTUNTONTONTONTUNTUNTONTONTONTUNTUNTONTONTONTTOTTOTTOTONTONTTO TTOTONTONTONTTOTTOTGOTGOTTO TTOTTOTTOTTOTGOTTOTGOTGOTGOTGOTGOTTOTGOTGOTGOTGOTGOTTOTGOTGOTTOTGOTGOTTOTGOTTOTTOTGOTURTURTUR TURTUR TUR TUR TUR TUR TUR TUR TUR TUR TUR TUR
TURTUR TURTUR
TKMTKMTKMTKMTKMTKMTKMTKMTKMTKMTKMTKMTKMTKM TKM TKMTKM TKM
TKMUKRUKRUKRUKR UGAUGAUGAUGAUGAUGAUGAUGAUGAUGAUGAUGAUGAUGAUGAUGAUGAUGAUGA UKRUKR UKR UKR UKR UKR UKR UKR UKRUKR
UKR UKRUKRUKRUKR ARE
AREAREAREAREARE ARE ARE ARE AREAREAREARE
AREAREAREAREAREARE
GBRGBR GBRGBR
GBRGBR GBRGBRGBRGBRGBRGBRGBR
GBRGBRGBRGBRGBRGBR USA USA USA USAUSAUSA
USAUSA USAUSAUSAUSAUSAUSAUSAUSAUSAUSA
USA
URY URY URY URYURYURYURY URY URY URYURYURYURYURYURYURYURYURYURY UZBUZBUZBUZBUZBUZBUZBUZB UZBUZBUZBUZBUZBUZB UZB UZBUZB UZB
UZB VUTVUTVUTVUTVUTVUTVUTVUTVUTVUTVUTVENVUTVUTVUTVENZWEVENZWEVNMVNMVNMVENZWEVNMZWEVUTVUTZWEVUTVNMVUTZWEZWEVUTVENZWEZWEZWEZWEZWEZWEZWEVEN VENZWEZWEVENVENVNMZWEVENVENVENVENVENVENVNMVNMVNMVENVNMVNMVENVNMVNMZWEVNMVNMVNMZWEVNMVNMVNMVENVENZMBZMBZMBZMBZMBZMBZMBZMBZMBZMBZMBZMBZMBZMBZMBZMBYEMZMBYEMYEMYEMZMBYEMYEMZMBYEMYEMYEMYEMYEMYEMYEMYEMYEMYEMYEMYEMYEM
0
5
10
15
20
40 60 80 100
GINI Index (wealth distribution)
Wealth of billionares as a % of PPP GDP in 2018 Fitted values
ALB ALB ALB ALB
DZAARMARMARMARMARMARMARMARMARMARMARMARMAUSAUSARMARMARMARM ARGARGARGARGARGAGOARGARGARGARGARGARGARGARGARGARGAGOARG AUS AUS AUT AUT AUTAUT AUT AUTAUT AUTAUT AUT AUT AUT AUT AZE AZEAZE
AZEAZE BLRBLRBLRBLRBLRBLRBLRBLRBLRBLRBELBELBLRBLRBLRBLRBLRBLRBLRBGDBGDBGDBGD BEL BELBEL BELBEL BEL BEL BELBELBELBEL
BENBTNBEN BEN BTNBTN
BTN BOLBOLBOLBOLBOLBOLBOLBOL BOLBOL BOLBOLBOLBOLBOL BIHBIHBIHBIHBIH BRABRABRABRABWA BWA
BRA BRA BRA BRA BRA BRA BRA BRA BRA BRA BGRBGR BGRBGRBGRBFABGRBGRBGRBGR
BDI BDI CMRCMR CMR CANCAN CAN CANCAN CPV CPV CAF CAF
TCD TCD CHL
CHL CHLCHL CHL CHL CHL CHN CHN COL COL COL COLCOL COL COL COLCOL COL COL COL COL COL COL COM COM COD
COD COGCRICRICRICRICRICRICRICRICRICRICRICRICOGCRICRICRICRICRI CIVCIVCIV HRV HRV HRVHRV HRVHRV HRV CYPCYPCYP CYP CYP CYP CYP CYP CYP CYP CYP CYP CZE CZE CZE CZE CZE
CZECZECZE CZECZE CZE CZE DNK DNK DNK DNK DNK DNK DNKDNK
DNKDNKDNK DNK DNK
DJI DOMDJIDOMECUECUDJIDOMDOMECUECUECUDOMDOMECUDOMDOMECUDOMDOMECUECUDOMDOMDOMDOMDOMDOMDOMECUECUECUECUECUECU EGY EGYEGY EGYEGY SLV SLVSLV SLV SLVSLV SLV SLVSLVSLV SLV SLV SLVSLV SLV SLV SLV EST EST ESTEST ESTESTESTESTESTESTESTESTEST ETH ETH FJIFJI FJIETH FINFIN
FINFINFINFIN FINFINFIN FINFIN FINFIN FRA FRA FRA FRA
FRAFRAFRAFRAFRAFRA FRA FRA FRA
GAB GAB GMB GMB GMBGEOGEOGEOGEOGEOGEOGEOGEOGEOGEOGEOGEOGEOGEOGEOGEOGEO
DEU DEU DEU DEU DEU DEU DEUDEU DEU GHA GHA GRC GRC GRC GRC GRC GRC GRC GRC GRCGRC GRC GRCGRC GTMGTM GTM GIN GIN
GINGNB HTI HNDHNDHNDGNBHNDHNDHNDHNDHNDHNDHNDHNDHNDHNDHNDHND HUN HUN
HUN HUN HUN HUNHUNHUNHUNHUNHUNHUN ISL ISL ISL ISL ISL ISL ISL ISLISLISL ISL ISL IND IRNIRN IRN IRNIRN IRQIRQ IRL IRLIRL IRL IRL IRL IRL IRL IRL IRL IRL IRL IRL ISR ISR ISR ISR ISR ITA ITA ITA ITA ITAITAITAITAITA
ITA ITA ITAITA
JAM JAM JPNJORJORKAZKAZJORKAZJOR
KAZ KAZ KAZ KAZ KAZ KAZ KAZ KAZKAZ KAZ KAZ KAZ KEN KEN KIR KOR KOR KOR KOR
KOSKOSKOSKOSKOS KOSKOS
KOSKOSKOSKGZKGZKGZKOSKGZKGZKGZKGZKGZKGZKGZKGZKGZKGZLAO LAOKGZKGZLVAKGZLVALVALVALVALVALVALVALVALAOLVA LVALVAKGZ LBN
LSO LSO LBR
LBRLTULTULTULTULTULTULTU LTU LTULTULTULTU LUX
LUXLUXLUXLUXLUXLUX LUXLUXLUXLUXLUXLUX MKDMKDMKDMWIMDGMDGMKDMKDMDGMKDMWIMDG MYS MYS MYS MYS MYS MYS MDV MDVMLIMLI MLI
MLTMLTMLTMLTMLTMLTMLTMLTMLTMLTMRT MUSMRTMUSMRTMRT
MEX MEX MEXMEX MEX MEXMEX
MEXMEXMEX MEX FSM FSM MDAMDA MDA MDA MDAMDAMDA MDAMDA MDA MDA MDA MDA MDA MDAMDA
MDAMNEMNEMNEMNEMNEMNEMNEMNEMNGMNEMNGMNENPLMNGMNGMNGMNGMNG MMR NPLMOZMOZ MOZ NAMNAMNAM NLD
NLDNLDNLDNLD NLD NLD NLD NLDNLDNLDNLD
NIC NIC NIC NICNER NER
NER NER NGA NGA NORNORNOR
NOR NOR NOR NOR NOR NOR NOR NOR NOR
PAKPAKPAKPAK
PAKPAK PAKPAK PNG PERPERPRYPRYPRYPRY PRYPERPRYPERPERPERPERPANPERPERPANPRYPERPANPRYPRYPANPANPANPANPANPRYPRYPANPRYPRYPANPERPANPRY PRYPANPRYPANPANPANPANPAN PER PER PER PER PER PER PRTPRT PRT PRT PRT PRT PRTPRTPRTPRT PRT PRT PRT ROU ROU ROU ROU ROUROUROUROUROUROURUSRUS
RUSRUS RUSRUS RUS RUS RUS RUS RUS RUSRUS RUS RUS RUS RWA RWA RWA RWA WSM STP
STP SLE SENSLESENSEN SYC SVKSVK
SVK SVKSVNSVKSVKSVKSVKSVKSVKSVKSVK SVN SVN SVN
SVNSVNSVNSVNSVNSVNSVNSVN SLB SLB ZAF
ZAF ZAF
ZAF ZAF ESPESPESP
ESP ESP ESPESP ESP ESP ESPESP ESP ESP LKA LKA LKA LKALKA SDN SWESWE SWE SWE SWE SWE SWESWESWE
SWE SWE SWE SWE CHE CHE CHE CHE CHE CHE CHE CHE CHE CHE SYR TJKTJK TJK
TJK TJK TZA TZATZA THATHATHATHA THATHA THA THA THATHATHA THA
THA
TLS
TLSTLS TUNTON TUNTONTUN TURTGO TGOTGO TUR TUR TUR TUR TUR TUR TUR TUR TUR TUR TUR TURTUR TUR UGA UGAUGA UGAUGA UKR
UKRUKRUKR UKR UKR UKR UKR UKR UKR UKR UKR
UKRUKRUKR GBRGBRGBRGBRGBRGBRGBR GBR GBRGBRGBR
GBR
USAUSA USA USAUSAUSA
URYURY URYURY URY URY URYURYURYURY URY UZB
UZBUZBVUTYEMVNMVNMVNM VNMVNMVNMYEMVNMVNM ZMBZWE VENVENVENVENVENVEN ZMBZMBZMBZMB
0
5
10
15
20
20 30 40 50 60 70
GINI Index (World Bank Estimate)
13
There are at least two different types of income inequality, presented in the schema below: the
same Gini coefficients of income distribution can result from the concentration of inequalities at
the high end or the low end of the income pyramid. The graphical interpretation of the Gini
coefficient is the ratio of the area between the line of complete equality and the standard Lorenz
curve to the area of the shaded triangle.
In the first chart, the ABC triangle has about the same area as the ‘Lorenz curve–complete equality’ area – and the same Gini coefficient – but inequality in concentrated at the top end. So the 90% of the population at the poorer end of the income distribution are totally equal in their income among
themselves, but only account for 50% of total income, whereas the richest 10% have the other 50%
of total income; the per-capita income of the rich is exactly nine times higher than the per capita
income of the poor.8
In the second chart, the ABD triangle also has about the same area as the ‘Lorenz curve–complete equality’ area – and the same Gini coefficient – but inequality exists because the lower half of society has no income at all, and the other half has all the income.
The data seem to suggest that the first type of income distribution –‘90% poor and equal, 10% rich’ – is better for happiness than the second type.
14
Schema: Two types of inequality with the same Gini coefficient
0 10 20 30 40 50 60 70 80 90 100
0 5 10 15 20 25 30 35 40 45 50 55 60 65 70 75 80 85 90 95 100
S
h
ar
e
in
in
co
m
e
, %
Share of population, %
Complete equality among the poor, but high income of the few rich
Share in income - standard Lorenz curve
Complete equality
Share in income: 90% of poor have the same income
C B
0 10 20 30 40 50 60 70 80 90 100
0 5 10 15 20 25 30 35 40 45 50 55 60 65 70 75 80 85 90 95 100
S
h
ar
e
in
in
co
m
e
, %
Share of population, %
High inequalities between rich and poor
Share in income - standard Lorenz curve
Complete equality
Share in income: half rich-half poor
B
15
An explanation of the ‘inequality–happiness’ relationship in terms of statics (space – geography) and dynamics (time – history) could be the ‘big fish in a small pond’ effect. This is a model developed by Marsh and Parker (1984) to explain why good students prefer to stay in a class in
which they are above the average level, rather than be in a more challenging learning environment
where they are below the average level. This effect can be used to explain one of the paradoxes of
happiness: Strong growth is usually accompanied by growing income inequalities (Popov, 2018a,
fig. 10), so rapid growth is often associated with low happiness scores. A paper by Brockmann, Delhey, Welzel, and Hao (2008) refers to the concept of “frustrated achievers” and explains the decline in happiness scores in China through the deterioration of relative incomes for the majority
of the population due to rises in income inequality.
But there is a different relationship with regards to levels and change, stocks and flows, and space and time dimensions: with low levels of inequality people feel unhappy – the dream of the ‘big fish in a small pond’ is out of reach – but the transition to higher levels of inequality, when the relative position of the majority deteriorates in relation to the average, makes people even more
unhappy temporarily, during the transition. When transition to a higher level of inequality is over,
people – maybe new generations – start to feel happier.
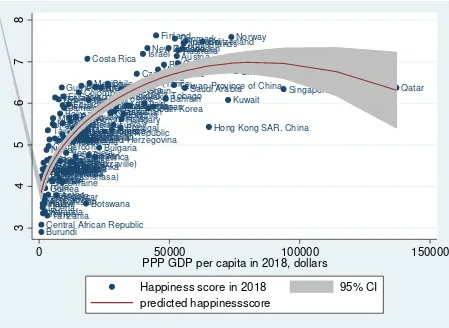
The other explanation could be a different relationship between happiness and inequality in rich
and poor countries. The dependence of happiness on income is characterised by a rising but
concave curve (fig. 14) that reaches its maximum at a level of income of about $75,000 (the level
of very rich Norway and Kuwait) and which increases only marginally after the income level of
about $30,000 (the level of the poorest OECD members – Greece, Chile, and Estonia). Whereas happiness index scores rise from 3 to 6 with a rise of PPP GDP per capita from less than $1,000 to
$30,000, they only increase from 6 to 7 when per-capita income rises from $30,000 to $75,000
16
Figure 15: Happiness index (Word Happiness Report and World Database on Happiness), 0-to-10 scale, and PPP GDP per capita in 2018, Dollars
Source: World Database on Happiness, 2019; WDI.
It may well be that in rich countries, the ‘money can’t buy happiness’ story is more true than in poor countries; i.e., a marginal increase in happiness due to a unit increase in income in rich
countries is lower than in poor countries.
First, for rich people, non-income determinants of happiness probably play a larger role, so the
negative effects of inequality are not counterweighted by higher incomes. Second, in rich countries, people derive pleasure from being better off than most of the world population – i.e., their ‘American dream’ has been achieved already – so inequality in their own country is less important and has only negative consequences.
Afghanistan Albania
Algeria
Angola
Argentina
Armenia
Australia Austria
Azerbaijan
Bahrain
Bangladesh Belarus
Belgium
Belize
Benin Bhutan Bolivia
Bosnia and Herzegovina
Botswana Brazil
Bulgaria Burkina Faso
Burundi Cambodia Cameroon
Canada
Central African Republic Chad
Chile
China Colombia
Congo (Brazzaville) Congo (Kinshasa)
Costa Rica
Croatia Cyprus
Czech Republic Denmark
Dominican Republic Ecuador
Egypt El Salvador
Estonia
Ethiopia
Finland
France
Gabon Georgia
Germany
Ghana
Greece Guatemala
Guinea Haiti
Honduras Hungary Hong Kong SAR, China Iceland
India Indonesia
Iran Iraq
Ireland Israel
Italy
Ivory Coast
Jamaica Japan
Jordan
Kazakhstan
Kenya Kosovo
Kuwait
Kyrgyzstan Laos
Latvia
Lebanon
Lesotho Liberia
Libya
Lithuania
Luxembourg
Macedonia
Madagascar Malawi
Malaysia
Mali
Malta
Mauritania
Mauritius Mexico
Moldova Mongolia
Montenegro Morocco
MozambiqueMyanmarNamibia Nepal
Netherlands New Zealand
Nicaragua
Niger Nigeria
Norway
Pakistan
Panama
Paraguay Peru Philippines
Poland
Portugal
Qatar Romania
Russia
Rwanda
Saudi Arabia
Senegal Serbia
Sierra Leone
Singapore Slovakia
Slovenia
South Africa
South Korea Spain
Sri Lanka Sudan
SwedenSwitzerland
Taiwan Province of China
Tajikistan
Tanzania
Thailand
Togo
Trinidad & Tobago
Tunisia
Turkey Turkmenistan
UgandaUkraine
United Arab Emirates United KingdomUnited States
Uruguay Uzbekistan
Venezuela Vietnam
Yemen Zambia
Zimbabwe
3
4
5
6
7
8
0 50000 100000 150000
PPP GDP per capita in 2018, dollars
Happiness score in 2018 95% CI
17
This paper uses the databases from the Forbes billionaires list and the Global Wealth Report
(GWR), as well as from the World Happiness Report and the World Database on Happiness. I use
the data to examine the relationship between income inequality, and happiness for nearly 20 years
(2000-18) for over 200 countries.
It turns out that inequality grows together with happiness in relatively poor countries, but harms happiness in rich countries. On the other hand, inequality of wealth distribution – wealth is a stock variable whereas income is a flow – is positively linked to happiness in all countries. Wealth distribution at the very top of the pyramid – billionaire and millionaire wealth as a proportion of GDP – is one of the most important determinants of happiness index scores in all countries.
The stylised fact is that there are two ‘typical’ statistical portraits of a happy country. One is of a country with relatively high income compared to the world average, a low level of income
inequality, but high wealth inequality and especially high wealth inequality at the very top – millionaire and billionaire intensity. This is very much the image of a Scandinavian country – high income compared to the rest of the world, low income inequality within the country, but pretty
high wealth inequality and billionaire intensity within the country. The other type of happy country
has lower levels of income, but high income and wealth inequalities, especially at the top of the
wealth pyramid. This is the Latin American and African model; e.g., Honduras, Bolivia, Ecuador,
Costa Rica, South Africa, and Zimbabwe.
Data
Income. Data on income are from the World Development Indicators database – purchasing power parity (PPP) GDP per capita.
Happiness. Data on happiness come from the World Happiness Report, as well as from the World Database on Happiness. This represents individuals’ self-perception of how happy they are. The scale is from 0 to 10, and the estimates are derived from the Gallup World Poll, the World Values
18
Income and wealth inequalities. Income inequalities data are from the World Development
Indicators database (WDI) and derived from national household surveys of income and
consumption in various countries. Wealth inequalities are computed through extrapolation: first,
regressions between the components of personal financial and non-financial wealth and its
determinants (real consumption; population density; market capitalisation rate; public pensions as
a percentage of GDP; domestic credits available to private sector; and Gini coefficient of income
distribution) are computed for about 40 countries for which these data are available, then an
extrapolation is made for countries that do not have estimates of these components of personal
wealth (Davies, Sandström, Shorrocks, and Wolff, 2007).
Wealth of high net worth individuals (HNWI) – billionaires and millionaires. Sample surveys
tend to omit HNWIs, so income and wealth distribution at the very top of the pyramid is very much
underestimated. That is why this paper uses the Forbes list of billionaires, which reports the wealth of all billionaires in the world since 1996 – see Popov (2018a) for details – and the Credit Suisse Global Wealth Report, which makes a number of adjustments to the Forbes data on billionaires
(GWD, 2018, pp. 110-113) and estimates the number and wealth of multi-millionaires,
millionaires, and other HNWIs.9
9This is how the estimation procedure is explained in the GWR: “We exploit the fact that the top tail of wealth distribution is usually well approximated by the Pareto distribution, which produces a straight-line graph when the logarithm of the number of persons above wealth level w is plotted against the logarithm of w. Our data yield a close fit to the Pareto distribution in the wealth range from USD 250,000 to USD 5 million. Above USD 5 million the relationship begins to break down, and the correspondence weakens further above USD 50 million, as expected given the limitations of the data sources. However, it still seems reasonable to use a fitted Pareto line to estimate the number of individuals in the highest echelons of the wealth distribution. To determine the precise features of the top wealth tail, we rely heavily on the rich list data provided by Forbes and other sources. We make particular use of the number of billionaires reported by Forbes, since the data are available for many years and are broadly comparable across countries. We recognize that rich list data have limitations. The valuations of individual wealth holdings are dominated by financial assets, especially equity holdings in public companies traded in international markets. For practical reasons, less attention is given to nonfinancial assets apart from major real estate holdings and trophy assets, such as expensive yachts. Even less is known – and hence recorded – about personal debts. Some people cooperate enthusiastically with those compiling the lists; others jealously guard their privacy. There are also different country listings for nationals and residents, which is especially evident for India, for instance. The true legal ownership within families – as opposed to nominal ownership or control – adds further complications. Assigning the wealth recorded for Bill Gates, for example, to all family members might well result in several billionaire holdings, so the number of billionaires would increase in this instance. In other cases, reassigning the family wealth would reduce all the individual holdings below the billionaire threshold. For all these reasons, rich list data should be treated with caution. At the same time, the broad patterns and trends are informative, and they
19
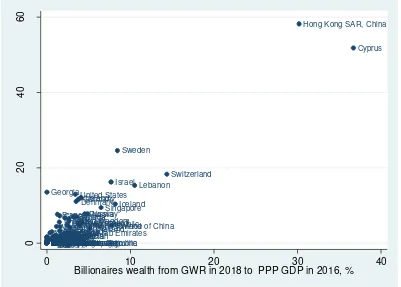
Forbes data show a higher ratio of billionaire wealth to GDP than the GWR data. For instance, for
Hong Kong, the comparison is 58% and 30% respectively. But overall, these two estimates are
[image:20.612.74.475.199.486.2]strongly correlated (fig. 16).
Figure 16: Billionaire intensity in percentage terms of PPP GDP according to the Forbes list and according to the Global Wealth Report
Afghanistan Albania Algeria
AngolaArgentina
Armenia
Australia Austria
Azerbaijan Bahrain Bangladesh
BelarusBelgium
Belize Benin Bhutan Bolivia
Bosnia and Herzegovina Botswana
Brazil
Bulgaria Burkina Faso Burundi Cambodia Cameroon
Canada
Central African Republic Chad
Chile
China Colombia Congo (Brazzaville) Congo (Kinshasa) Costa Rica Croatia
Cyprus
Czech Republic Denmark
Dominican Republic
EcuadorEgypt
El Salvador Estonia Ethiopia
Finland France
Gabon Georgia
Germany
GhanaGreece
Guatemala Guinea Haiti Honduras
Hong Kong SAR, China
Hungary
Iceland
India Indonesia Iran Iraq
Ireland Israel
Italy
Ivory Coast
JamaicaJapan
JordanKazakhstan
Kenya
KosovoKuwait
Kyrgyzstan Laos Latvia
Lebanon
Lesotho Liberia Libya Lithuania Luxembourg Macedonia Madagascar Malawi
Malaysia
Mali Malta Mauritania Mauritius
Mexico
Moldova Mongolia
MontenegroMorocco
Mozambique Myanmar Namibia
NepalNetherlands
New Zealand
Nicaragua Niger
Nigeria
Norway
Pakistan Panama
ParaguayPeru
Philippines
PolandPortugal
Qatar Romania
Russia
RwandaSaudi Arabia
Senegal Serbia Sierra Leone
Singapore
Slovakia Slovenia
South AfricaSouth Korea
Spain
Sri Lanka Sudan
Sweden
Switzerland
Taiwan Province of China
Tajikistan Tanzania
Thailand
Togo
Trinidad & Tobago Tunisia
Turkey Turkmenistan Uganda
UkraineUnited Arab Emirates
United Kingdom United States
Uruguay Uzbekistan Venezuela Vietnam Yemen Zambia Zimbabwe
0
20
40
60
0 10 20 30 40
20
Source: GWR; Forbes.
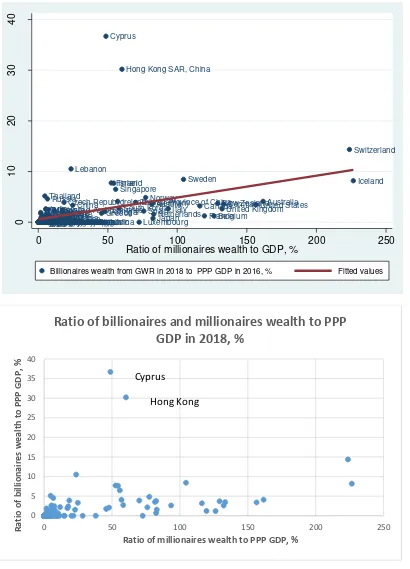
As figure 17 suggests, the ratio of millionaire wealth to GDP is correlated with the ratio of
billionaire wealth to GDP. However, data on the wealth of millionaires have the advantage of
including more countries. In 2018, there were only 24 countries, out of over 150, for which data
were available that did not have a single millionaire; in contrast the number of countries without
billionaires was nearly 100 out of over 150.
Suicide and murder rates. These data come from World Health Organization statistics on causes
of death.10 Murder rates statistics is also available from the UNODC (United Nations Office on
Drugs and Crime), which collects statistics mostly from WHO but from other sources as well.
10 External causes of death include murders, suicides, accidents, and ‘unidentified’. R² = 0.8933
0 10 20 30 40 50 60
0 5 10 15 20 25 30 35 40
B
il
li
o
n
ai
re
s
we
al
th
fr
o
m
Fo
rb
e
s
li
st
in
2018
to
PP
P
GDP
i
n
2016,
%
Billionaires wealth from GWR in 2018 to PPP GDP in 2016, %
Billionaires wealth as a % of PPP GDP according to Forbes list of billionaires and according to Global Wealth Report
Georgia
Hong Kong
21
Figure 17: Millionaire and billionaire intensity of PPP GDP according to the Global Wealth Report, percentage terms
Source: Global Wealth Report.
AfghanistanArmeniaAlgeriaAngolaArgentinaAlbania
Australia Austria
AzerbaijanBahrain
Bangladesh
BelarusBeninBhutanBotswanaBoliviaBosnia and HerzegovinaBelizeBulgariaBrazil Belgium
Burkina Faso
BurundiCameroonCambodia
Canada
Central African Republic
Chad Chile
China Colombia Congo (Brazzaville)
Congo (Kinshasa)CroatiaCosta Rica
Cyprus
Czech Republic Denmark
Dominican Republic Ecuador
Egypt
El SalvadorEstonia
Ethiopia
Finland
France
GabonGeorgia
Germany
Ghana
Greece Guatemala
GuineaHaitiHonduras
Hong Kong SAR, China
Hungary
Iceland
India Indonesia
IranIraq
Ireland Israel
Italy
Ivory CoastJordanJamaica Japan
Kazakhstan
KenyaKosovo
Kuwait
KyrgyzstanLaosLatvia
Lebanon
Lesotho
LiberiaMacedoniaLithuaniaLibya Luxembourg
Madagascar Malawi
Malaysia
Mali Malta
MauritaniaMongoliaMontenegroMoroccoMexicoMauritiusMoldova Mozambique
MyanmarNepalNamibia Netherlands
New Zealand
Nicaragua
NigerNigeria
Norway
PakistanParaguayPanama
Peru
PhilippinesPoland Portugal
Qatar Romania
Russia
RwandaSenegalSerbiaSaudi Arabia
Sierra Leone
Singapore
SlovakiaSouth AfricaSlovenia
South KoreaSpain
Sri Lanka Sudan
Sweden
Switzerland
Taiwan Province of China
Tajikistan Tanzania Thailand
TogoTrinidad & TobagoTunisia
Turkey Turkmenistan Uganda
UkraineUnited Arab Emirates United Kingdom
United States
Uruguay
UzbekistanVietnamYemenVenezuela
ZambiaZimbabwe
0
10
20
30
40
0 50 100 150 200 250
Ratio of millionaires wealth to GDP, %
Billionaires wealth from GWR in 2018 to PPP GDP in 2016, % Fitted values
0 5 10 15 20 25 30 35 40
0 50 100 150 200 250
R
atio
o
f b
il
li
o
n
ai
re
s
we
al
th
t
o
PPP
GDP
,
%
Ratio of millionaires wealth to PPP GDP, %
Ratio of billionaires and millionaires wealth to PPP
GDP in 2018, %
Cyprus