ISSN Online: 2327-4379 ISSN Print: 2327-4352
DOI: 10.4236/jamp.2017.510163 Oct. 17, 2017 1923 Journal of Applied Mathematics and Physics
Research on Flight Delay Based on Fuzzy
Evaluation Algorithm
Sheng Ma
1, Xiongbin Wang
1, Huachuan Hu
21Huanggang Normal University, College of Mathematics and Physics, Huanggang, China 2Huanggang Middle School, Huanggang, China
Abstract
In recent years, since airspace restrictions and the volume of passenger traffic are increasing, the rate of flight delay is rising rapidly and the contradiction about it is outstanding. Flight delay event not only holds up passengers’ time, but also makes the airlines suffer a lot. So a scientific and reasonable guidance is necessary to reduce the delay effect. This paper firstly establishes a method to assess the degree of airport delays and get all factors which caused the flight delays quantification, andultimately we offer a proposal to deal with the flow factor, which is the principal reason for flight delays.
Keywords
Delays, Fuzzy Evaluation Algorithm, Grey Correlation Degree, Regression Analysis
1. Introduction
Since the reform and opening-up, China’s civil aviation develops rapidly and has made remarkable achievements. Fixed-point flight traffic has been ranked second place in the International Civil Aviation Organization. China Civil Avia-tion’s average annual growth is 19.5% and it develops much quicker than any other transportation ways [1]. With the rapid developments, flight delays which influence civil aviation are also constantly exacerbated and upgraded. In recent years, about 25% of the flights are not normal according to China’s civil aviation, for which complaints caused by flight delay accounted for more than 45% of the total civil aviation complaints. Currently, the most prominent problem in Chi-na’s air transport industry is the growing flight delays caused by uneven distri-bution of aviation resources and airspace congestion. For all the reasons, study on flight delays is very important.
How to cite this paper: Ma, S., Wang, X.B. and Hu, H.C. (2017) Research on Flight Delay Based on Fuzzy Evaluation Algo-rithm. Journal of Applied Mathematics and Physics, 5, 1923-1937.
https://doi.org/10.4236/jamp.2017.510163
Received: September 7, 2017 Accepted: October 14, 2017 Published: October 17, 2017
Copyright © 2017 by authors and Scientific Research Publishing Inc. This work is licensed under the Creative Commons Attribution International License (CC BY 4.0).
DOI: 10.4236/jamp.2017.510163 1924 Journal of Applied Mathematics and Physics Research on reducing flight delays began much earlier in abroad. For example, in the optimization of flight plans, as early as the middle of the last century, how to optimize the flight time has already attracted the attention of the optimization experts of the airline flight plan and they carried out some researches. Mathaisel and Etshmaier [2] summed up internationally renowned scholars for the flight planning research from the 60 s of last century to the mid-80 s. They believed that the airline should use the structural optimization of the flight plan assess-ment and establishassess-ment of flight plan these two means to produce the best flight scheduling which can satisfy the actual demand. And Barnhart C and Corn A
[3], the two scholars have made a summary of the research results on existing airline flight scheduling. Researches on time optimization and flight frequency of flight scheduling are also rich in the foreign countries. For example, Wei and Hanse [4] proposed to establish the target planning model to maximize the prof-itability of the entire route and minimize passenger delay rate. Then it can de-termine the actual flight frequency and simultaneously carry out market share analysis to optimize the flight running time. In addition, Lohatepanont M and Barnhart C [5] also analyzed the relationship between the airline supply and the passengers demand and put forward the establishment of a comprehensive mod-el optimization flight plan from the aspects of modmod-el assignment and route se-lection, etc. What’s more, one of the effective solutions is to implement air traffic flow management.
DOI: 10.4236/jamp.2017.510163 1925 Journal of Applied Mathematics and Physics Compared with foreign countries, domestic research on the problem of flight delays is inadequate. Most researchers paid attention to the flight delay service recovery strategy. They have discussed abundantly on service recovery, gover-nance model and legislation of the flight delay. Although service remediation af-ter flight delays is a solution to flight delays, it’s betaf-ter to develop a more opti-mized flight plan by harmonizing the relationship among the airport sector, reg-ulators, air traffic control departments, airlines and other aspects, so that it can better control the flow and can effectively solve the problem of flight delays. Scholars did this research. They studied flight Planning and optimization and provided mathematical models. Pita JP, Adler N, and Antunes AP [13], based on the concept of collaborative cooperation, used collaborative mechanism to im-prove the efficiency of air transport system by integrating air traffic control, air-lines and airport resources.
But there is no systematic research inland, from the perspective of the civil aviation departments and government departments, focusing on the main causes of flight delays and its improvement measures. It can be said that the study of domestic flight delays is in the ascendant. In this article, we will analyze the rea-sons for the delay of several airports which have higher delay rates and give sug-gestions. This is the innovation point of the paper.
2. Models and Questions
2.1. Problems’ Proposing and Analyzing
Nowadays, flight delay caused some troubles to travelers. In the article we collect related data and build the corresponding mathematical model to solve the fol-lowing problems:
Question 1: Establish a model to determine the extent of an airport delay, and list 10 airports which has the most severe flight delays in China (or some other country).
Question 2: What is the main reason for the flight delay in our country (or some other country)?
Question 3: What are the corresponding improvements?
For Question 1, this paper collects the airport flight delay data first. It uses the fuzzy comprehensive evaluation method to construct the flight delay level as-sessment model, and determines the weight of the six indexes of the airport de-lay degree. Then the membership is calculated and the degree of airport dede-lay will be determined.
For Question 2, this paper analysis the causes of flight delay from the aspects of its impact and the frequency. In the aspect of the influence degree, it builds grey correlation model to evaluate. And its influence can be analyzed by com-paring the flight delay trends and the number of delays. Using the grey correla-tion model to assess the degree of impacts, you can determine the main reason for flight delays from these two angles.
DOI: 10.4236/jamp.2017.510163 1926 Journal of Applied Mathematics and Physics qualitatively analysis some factors which influence airport traffic, including air-port infrastructure construction, modes of transair-portation and other factors. On the other hand, quantitatively, it establishes a regression analysis model and tests the model. And finally it adds dummy variables to study the impact of policy factors on airport traffic.
2.2. Model Assumption
1) Each airport is consistent with the criteria of flight delays. 2) The source of the data is real and effective.
3) Reasons for the flight delay have no influences with each other.
4) Assuming that under normal circumstances, all flight indexes meet the flight requirements.
2.3. Symbols Description
ρ : Distinguishing coefficient; xi: Correlation data array; x0:Standard data array;
k: Moment;
ξ
: Correlation coefficient; r: Correlation;y: Sequence initialization results; βi: Parameter point estimation;
2
R : The square of the correlation coefficient R of the regression equation; F: Regression equation statistics; 2
s and σ2:estimated value;
i
Y: Air transport passenger turnover; X2i: Railway passenger turnover;
3i
X : Investment of Civil Aviation Capital Construction and Technical
Reno-vation;
D: Dummy variable.
3. Model’s Established and Solved
3.1. Flight Delay Assessment Model’s Established and Solved
Flight delay assessment index system is an organic whole which is composed of a series of interrelated indexes that intuitively reflect real-time flight delays in air-space. From the flight delay time and sphere of influence these two angles, this paper respectively selects time-related indexes and scope-related indexes to es-tablish a real-time assessment index system for flight delays. According to spatial and temporal distribution feature, the article chooses the time-related indexes and scope-related indexes of the flight delays, and builds the real-time evaluation system for flight delays. It is shown in Table 1.
We determine the weight of the index by AHP (analytic hierarchy process)
Table 1. Flight delay real-time evaluation system.
Flight delay level
Time-related indexes Scope-related indexes
Flights average
DOI: 10.4236/jamp.2017.510163 1927 Journal of Applied Mathematics and Physics 1) Establish index set. According to the established index system, all indexes are shown below:
First class index:
{
1, 2} {
time-related index scope-related ind, ex}
X = X X =
Second class index:
{
} {
}
1 11, 12 flight delay average time, flight delay rate change
X = X X =
2) Solution of index weight. Compare its impact of the same level index with each other in the index system by using of analytic hierarchy process. And it uses 1 - 9 scale method. Meanings of each index are shown in Table 2. Forming deci-sion matrix according to the Table 1, and marking it as W =
( )
wij and0
ij
w > . Feature of the comparative matrix is aij>0, aii =1,
1
ji ij
a a
= .
Solving the eigenvalue problem Wn=nn and doing a consistency check for
calculation, after normalization processing, weight of index X =
{
X X1, 2}
can be calculated and it is marked as U={
u u1, 2}
. Weight of index X1={
X11,X12}
is marked as U1={
u11,u12}
. Weight of index X2 ={
X21,X X22 23,X24}
is marked as{
}
2 21, 22, 23, 24
U = u u u u
3) Determine each index weight. First-level and second-level judgment ma-trices are as follow:
1 2 2 3 1 1 1 2 1 2 1 1 2
, ,
1 1 1 2 1 1 2 1 1 2 1 2 1 2 1 2 1
W W W
= = =
After consistency test, we can get
(
0.500, 0.500 ,)
1(
0.667, 0.333 ,)
2(
0.423, 0.227, 0.227, 0.123)
U = U = U =
In the paper, the fuzzy comprehensive evaluation method is used to construct the flight delay level assessment model.
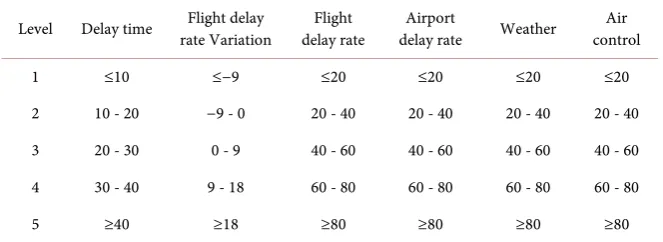
According to the features of flight delay, we divide flight delay degree into 5 levels. Value of each level is shown in Table 3.
Table 2. Scale and its definition.
Scale Definition
1 Comparing two factors, they have the same importance.
DOI: 10.4236/jamp.2017.510163 1928 Journal of Applied Mathematics and Physics
Table 3. Flight delay real-time assessment indicators and evaluative standards.
Level Delay time rate Variation Flight delay delay rate Flight delay rate Airport Weather control Air
1 ≤10 ≤−9 ≤20 ≤20 ≤20 ≤20
2 10 - 20 −9 - 0 20 - 40 20 - 40 20 - 40 20 - 40 3 20 - 30 0 - 9 40 - 60 40 - 60 40 - 60 40 - 60 4 30 - 40 9 - 18 60 - 80 60 - 80 60 - 80 60 - 80
5 ≥40 ≥18 ≥80 ≥80 ≥80 ≥80
The fuzzy level of each evaluation index is determined by the triangular membership function. The function is shown in Figure 1.
The membership function of flight average delay time is
( )
1 1 1 1 1 0 10 10 10 40 40 10 1 40 x xC x x
x
≤
−
= < <
−
≥
(3.1)
Membership function of flight delay rate change is
( )
( )
( )
2 2 2 2 2 0 9 9 9 9 18 9 1 18 x xC x x
x
≤ −
− −
= − < <
− −
≥
(3.2)
Membership function of flight delay rate, airport delay rate, air control and weather is:
( )
(
)
0 20
20
20 80 3, 4, 5, 6 80 20 1 80 i i i i i x x
C x x i
x
≤
−
= < < =
−
≥
(3.3)
Substituting data of delays to Formulas (3.1) - (3.3), it will get C. Then we can get the membership of each delay level. Thus we can get fuzzy membership ma-trix R1 and R2 of time-related indexes and scope-related indexes, where
11 12 13 14 15
11 12 13 14 15 21 22 23 24 25
1 2
21 22 23 24 25 31 32 33 34 35
41 42 43 44 45 ,
b b b b b
a a a a a b b b b b
R R
a a a a a b b b b b
b b b b b
= = (3.4)
We use the operator M
(
• ⊕,)
to calculate the results by combining theweight of the secondary index and the fuzzy membership matrix. Then we can get the evaluation result of time-related index
(
)
(
)
1 1 1, 2, 3, 4, 5 , 2 2 1, 2, 3, 4, 5
A=U •R = a a a a a B=U •R = b b b b b (3.5)
DOI: 10.4236/jamp.2017.510163 1929 Journal of Applied Mathematics and Physics
Figure 1. Triangular membership function and membership of delay level.
(
)
1 2 3 4 5(
)
1 2 1 2 3 4 5
1 2 3 4 5
, a a a a a , , , ,
D U R u u d d d d d
b b b b b
= • = • =
(3.6)
According to the principle of maximum membership
(
1 2 3 4 5)
max , , , ,
V = d d d d d (3.7)
We get the flight delay levels in real time, and that is delay level.
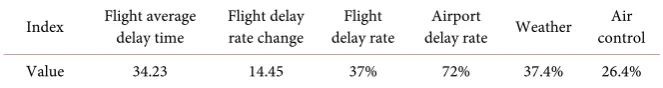
Next, we check the average delay time and the punctuality rate and other data in 2014 to analyze the actually data according to the theory above. (Data are from Flight stats and Civil aviation resource network) the summary data of the Shanghai Pudong airport is shown in Table 4.
Substituting data of delays to Formulas (3.1) - (3.3), we get
( )
1 0.8077,( )
2 0.8685,( )
3 0.2833C x = C x = C x =
( )
4 0.8667,( )
5 0.29,( )
6 0.1067C x = C x = C x =
Then we get the membership of each delay level. Thus we can get fuzzy mem-bership matrix R1 and R2 of time-related indexes and scope-related indexes.
1
0 0 0 0.4615 0.5385 , 0 0 0 0.1575 0.8425
R =
2
0.0835 0.9615 0 0 0 0 0 0 0.1615 0.8335 0.05 0.95 0 0 0 0.9665 0.0335 0 0 0
R
=
Substituting R R1, 2 to Formulas (3.5) and (3.6), we can get: 0 0 0 0.3603 0.6397
A=
0.1656 0.6444 0 0.0367 0.1892
B=
0.0828 0.32220 0.1985 0.4145
D=
DOI: 10.4236/jamp.2017.510163 1930 Journal of Applied Mathematics and Physics
Table 4. Flight delay data of Shanghai Pudong airport in June.
Index Flight average delay time Flight delay rate change delay rate Flight delay rate Airport Weather control Air
Value 34.23 14.45 37% 72% 37.4% 26.4%
Statistics of the domestic large-scale airport punctuality rate from civil avia-tion administraavia-tion website in 2014 is displayed that 10 airports have the most serious flight delays: Nanjing Lukou International Airport, Changzhou Airport, Wuxi Airport, Hangzhou Xiaoshan International Airport, Shanghai Hongqiao International Airport, Shanghai Pudong International Airport, Ningbo Lishe Airport, Tianjin Binhai International Airport, Shenzhen Baoan International Airport, Guangzhou Baiyun Airport.
3.2. Flight Delay Reasons
There are a variety of reasons for the flight delay. But in general reasons can be broadly divided into five categories: airline; flow control; bad weather; other reasons, including passenger reasons. At present, the major media published sta-tistics can only reflect the frequency of each occurrence, but cannot reflect the influence extent of various reasons. For this situation, we use the grey relational analysis method to analyze the relationship between the various reasons and flight delays, and distinguish the impacts of these reasons. Thus, grey relational analysis should be introduced firstly.
For a sequence x=
(
x( ) ( )
1 ,x 2 ,,x n( )
)
, the mapping f x k(
( )
)
=y k( )
, 1, 2, ,k= n is called a data transformation from sequence x to sequence y.
f is called initialization transformation if
( )
(
)
( )
( )
( ) ( )
, 1 01
x k
f x k y k x
x
= = ≠
The concrete steps of solving relevancy are: select reference numeral.
( )
{
}
(
( ) ( )
( )
)
0 0 1, 2, , 0 1 , 0 2 , , 0
y = y k k= n = x x x n
Here k indicates the moment. Suppose it has m correlation data arrays.
( )
{
1, 2, ,}
(
( ) ( )
1 , 2 , ,( )
)
, 1, 2, ,i i i i i
y = y k k= n = y y y n i= m
Then
( )
( )
0( )
( )
( )
( )
0( )
( )
( )
0 0
min min max max
max max
s s
s t s t
i
i s
s t
y t y t y t y t
k
y k y k y t y t
ρ ξ
ρ
− + −
=
− + − (3.8)
is called correlation coefficient between correlation data array xi and standard
data array x0 at the k moment. Also ρ∈
[ ]
0,1 is distinguishing coefficient, and in Formula (3.8), min mins t y t0( )
−y ts( )
and max maxs t y t0( )
−y ts( )
isDOI: 10.4236/jamp.2017.510163 1931 Journal of Applied Mathematics and Physics index that describes the degree of correlation between correlation data array and standard data array at a certain time. Since there is an association number at each moment, the information becomes too scattered and is not easy to com-pare.
( )
1 1 n
i i
k
r k
n =
ξ
=
∑
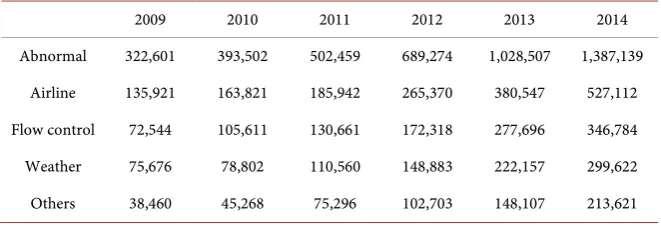
(3.9)is called the degree of correlation between xi and x0. It is easy to see the de-gree of correlation is the concentration of each moment correlation coefficient to focus on an average, that is, to achieve a scattered centralized information processing. Using the concept of correlation, we can analyze the various factors on the flight problems. At present, China Civil Aviation Authority has made sta-tistics on the frequency of abnormal flights caused by various reasons. It is shown in Table 5.
The Figure 2 below shows the trends in the number of occurrences of the four causes from 2009 to 2014.
Initialization of each sequence is showed in Table 6.
[image:9.595.213.536.365.550.2]Using gray system software to solve it, then we get the degree of correlation (
ρ
=0.5) of each sequence.Figure 2. Frequency changing trend of flight delays caused by various reasons.
Table 5. Nationwide frequency of abnormal flights caused by various reasons in
2009-2014.
2009 2010 2011 2012 2013 2014
[image:9.595.209.540.614.732.2]DOI: 10.4236/jamp.2017.510163 1932 Journal of Applied Mathematics and Physics
Table 6. Initialization results of each sequence.
2009 2010 2011 2012 2013 2014
Abnormal 1 1.220 1.558 2.137 3.188 4.300
Airline 1 1.205 1.368 1.952 2.800 3.878
Flow control 1 1.456 1.801 2.375 3.828 4.780
Weather 1 1.041 1.461 1.967 2.936 3.959
Others 1 1.177 1.958 2.670 3.851 5.554
0.686125 0.721406 0.681394 0.64157
r=
Comprehensive analysis of all the reasons is shown in Table 7.
From Table 7, we can conclude that improper control flow is the main im-pact, and followed by airline reasons and weather reasons, and finally for other reasons.
3.3. Flow Factors Analysis
In order to ensure the most efficient using of airspace, the method to adjusting traffic flow of a given airspace and a given route to an airport is flow controlling. From the view of airports conditions: airport infrastructure construction also has a great impact on airport traffic. In addition, flight flow is different times. With the rapid development of China’s aviation and the rapid increase in the number of aircraft, the load on these roads is also growing. Moreover, in order to ensure the needs of national defense, the country restricts the airspace strictly, and there are many restricted areas in the air. And the military is responsible for organizing the implementation of the national flight control, while the adjusta-ble margin of civil aviation is very small. From this point of view, the airport is passive control of traffic.
There are three modes of transportation available at the moment: air, rail and highway. The road transport is suitable for short trips. Its price fluctuation has little effect on air transport. And the proportion of waterways is small, so there is not much analysis about it. The biggest competitor of air transport is rail trans-port, especially the high-speed train. The market situation is their price and the actual time consumption. Insiders generally believe that high-speed train may cause a certain traffic divergence to airline traffic in a short-term. But over time, this diversion phenomenon will gradually weaken, thus this short supply situa-tion of airport traffic won’t change too much.
Due to the strong uncontrollability of weather conditions and uneasy quanti-zation of the airport and the airline these indexes, this article builds a model to analyze the impact on airport traffic only from the airport infrastructure and other transportation modes these two aspects. The paper takes air transport traveler turnover Yi as the standard to measure the airport traffic, takes rail
transport traveler turnover X2i as the standard to measure the railway
DOI: 10.4236/jamp.2017.510163 1933 Journal of Applied Mathematics and Physics
Table 7. Frequency and extent of the factors that cause flight delays.
Airline Flow control Weather Others
Frequency 68.61% 72.14% 68.14% 64.16%
Impact ranking 2 1 3 4
0 1 2 2 3
i i i i
Y =β +βX +β X +ε (3.10)
Based on the relevant published data in China Statistical Yearbook and 2010 Civil Aviation Industry Development Statistics Bulletin, using Matlab to calcu-late the parameters and draw the residual map 3-3, then we can get an initial re-gression model:
2 3
ˆ 50.1667 0.0825 0.218
i i i
Y = − + X − X
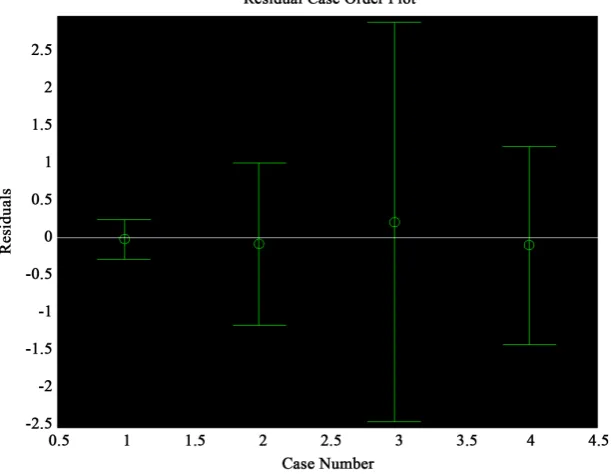
It can be seen that the second point in Figure 3 is an outlier. Then deleting the point and using regression again, one obtains coefficients, the coefficient confi-dence interval, the statistic, and the residual graph of the improved regression model. Details can be seen in Table 8 and Figure 4.
At this moment, confidence interval does not include null point. When F-statistics increases, coefficient of determination will increase from 0.9875 to 1.0000, and then we can get a regression model:
2 3
ˆ 44.5673 0.0790 0.1682
i i i
Y = − + X − X
Having been tested, the model is well fitted to the sample. Both the model and the parameters of the test are passed. So it can be concluded that the passengers increase in railway transport won’t lead to the passenger reduction in air trans-port. Thus it proves the insiders’ view point that high-speed train has limited in-fluence. It should be noted that no one person chooses the train as a travel tool on the corresponding 0.0790 million people choose the aircraft as a travel tool. It only indicates that an overall increasing in passenger traffic. When the invest-ment in civil aviation infrastructure is reduced by 100 million RMB, the average passenger traffic volume is reduced by 0.168 billion tons/km. Therefore, streng-then investment on airport infrastructure is effective to improve the airport traf-fic.
From the above model, we can see that the impact on airport traffic comes from many aspects, such as weather, air control, policy factors and other uncer-tain factors, but also some strong controllable factors, such as airport facilities, other transportation modes. For the uncertain factors, generally cannot be con-trolled. For controlling factors, first of all, should increase the airport infra-structure investment, and secondly, should be appropriate to adjust the fare to attract more passengers to take the plane.
4. Model’s Improvement and Prospect
DOI: 10.4236/jamp.2017.510163 1934 Journal of Applied Mathematics and Physics
[image:12.595.221.527.352.589.2]Figure 3. Initial residual plot.
Figure 4. Final residual plot.
Table 8. Parameters value of the final regression model.
Regression
coefficient regression coefficient Estimated Regression coefficient Confidence interval
β0 −44.5673 −94.8150 5.6805
β1 0.0790 0.0752 0.0827
β2 −0.1682 −0.2861 −0.0503
[image:12.595.210.539.640.711.2]DOI: 10.4236/jamp.2017.510163 1935 Journal of Applied Mathematics and Physics significant changes in the development of aviation industry. The relevant data shows the air transport passenger turnover rate dramatically improved com-pared with previous years since 2010. Therefore, the above model may not be able to completely describe the air transport passenger turnover changes in the trend and the model should be improved. For the introduction of “policy fac- tors” into the model and dummy variable 1, after 2010 year
0, before 2010 year
D=
will be
introduced, the model becomes
1 2 2 3 3 4 2 5 3
i i i i i i
Y =β β+ X +β X +β DX +β DX +ε
After computed by Matlab, we obtain an interpretation report below in the case of considering policy factors:
2 3 2 3
ˆ 654.528 0.258 2.345 0.303 1.958
i i i i i
Y = − + X + X − DX − DX
Having been tested, all tests of the model can pass, and the model is well fit-ted. Therefore, the model after adding the dummy variable is a better model, and the improvement of the model is successful.
It can be seen that the model has a great deal of flexibility, and it can coordi-nate the arrival and departure processes in each time interval on the airport and make full use of the airport capacity. At the same time, the model also consider the weather factors, which can facilitate decision-makers to combine the meteo-rological department information with the expected flow in the airport within a next period of time to initially forecast future feasible traffic allocation. This provides a reliable basis for its future scheduling strategy.
5. Conclusions
This paper firstly establishes a method to assess the degree of airport delays and gets all factors which caused the flight delays quantification, and ultimately of-fers a proposal to deal with the flow factor, which is the principal contradiction for flight delays.
For Question 1, this paper uses the fuzzy comprehensive evaluation method to construct a flight degree evaluation model due to different cognition for differ-ent flight level and differdiffer-ent people. We choose six indicators to evaluate the de-gree of airport delay consisting of delay time, the value of flight delay rate change, rate of flight delays, airport delays, weather, and air control. Next we use the analytic hierarchy process to determine the index weight and use triangular membership functions to determine the fuzzy level evaluation indexes and cal-culate the membership degree of each index. Finally, we get the degree of Shanghai Pudong airport flight delays is level 5, which belongs to the serious de-lay condition.
DOI: 10.4236/jamp.2017.510163 1936 Journal of Applied Mathematics and Physics The closer correlation of it, the greater contact it is. Finally, we get the first three main reasons which influence the flight delay are flow, airlines and weather con-ditions.
For Question 3, starting from the flow factor, which is the most important factor from problem 2, we analyze the airport infrastructure, other transporta-tion ways and policy factors which influence the flow of airport from the aspect of qualitative .We also establish a regression analysis model from the perspective of quantitative and get it tested. Finally, we offer some suggestions to improve the airport traffic such as increasing investment on airport infrastructure, selling ticket at a discount, streamlining government and delegating authorities.
Acknowledgements
This work was supported by the Key project of Education Department for Hubei Province, China (No: D20172905).
References
[1] Civil Aviation Administration of China (2012) Civil Aviation Industry Statistical Development Bulletin. China Civil Aviation Press, Beijing.
[2] Etschmaier, M.M. and Mathaisel, D.F.X. (1985) Airline Scheduling: An Overview. Transportation Science, 5, 36-38.https://doi.org/10.1287/trsc.19.2.127
[3] Barnhart, C. and Com, A. (2004) Commissioned Paper Airline Schedule Planning. Manufacturing Service Operations Management, 1, 56-66.
[4] Wei, W. and Hanse, M. (2005) Impact of Aircraft Size and Seat Availability on Air-lines’ Demand and Market Share in Duopoly Markets. Transportation Research Part E, 41, 315-327.
[5] Lohatepanont, M. and Barnhart, C. (2004) Airline Schedule Planning: Integrated Models and Algorithms for Schedule Design and Fleet Assignment. Transportation Science, 38, 19-32.https://doi.org/10.1287/trsc.1030.0026
[6] Sherali, H.D., Bish, E.K. and Zhu, X. (2006) Airline Fleet Assignment Concepts, Models, and Algorithms. European Journal of Operational Research, 172, 1-30. [7] Vranas, P.B., Bertsimas, D.J., Odoni, A.R. (1994) Dynamic Ground-Holding
Poli-cies for a Network of Airports. Transportation Science, 28, 275-291.
https://doi.org/10.1287/trsc.28.4.275
[8] Brunetta, L., Guastalla, G. and Navazio, L. (1998) Solving the Multi-Airport Ground Holding Problem. Annals of Operations Research, 81, 271-288.
https://doi.org/10.1023/A:1018909224543
[9] Zou, B. and Hansen, M. (2005) Flight Delay Impact on Airfare and Flight Frequen-cy: A Comprehensive Assessment. Transportation Research Part E, 69, 54-74. [10] Gopalan, R. and Talluri, K.T. (1998) Mathematical models in Airline Schedule
Planning: A survey. Annals of Operations Research, 76, 155-185.
https://doi.org/10.1023/A:1018988203220
[11] Cheung, R.K.-M. and Powell, W.B. (1996) Models and Algorithms for Distribution Problems with Uncertain Demands. Transportation Science, 30, 43-59.
https://doi.org/10.1287/trsc.30.1.43
DOI: 10.4236/jamp.2017.510163 1937 Journal of Applied Mathematics and Physics https://doi.org/10.1287/msom.1030.0018