J. Range Manage.
56: 432-438 September 2003
Spatial and temporal patterns of cattle feces deposition on rangeland
KENNETH W. TATE, EDWARD R. ATWILL, NEIL K. MCDOUGALD, AND MELVIN R. GEORGE
Authors are Rangeland Watershed Specialist, Agronomy and Range Science, University of California, Davis, Calif. 95616-8515; Environmental Animal Health Specialist, School of Veterinary Medicine, University of California, Veterinary Medicine Teaching and Research Center, Tulare, Calif. 93274; Natural Resources and Livestock Advisor, University of California Cooperative Extension, Madera, Calif. 93637; and Range and Pasture Specialist, Agronomy and Range Science, University of California, Davis, Calif. 95616-8515.
Abstract
The objective of this study was to identify and model environ- mental and management factors associated with cattle feces deposition patterns across annual rangeland watersheds in the Sierra Nevada foothills. Daily cattle fecal load accumulation rates were calculated from seasonal fecal loads measured biannu- ally on 40 m2 permanent transects distributed across a 150.5 ha pasture in Madera County, Calif. during the 4 year period from 1995 through 1998. Associations between daily fecal load per sea- son, livestock management, and environmental factors measured for each transect were determined using a linear mixed effects model. Cattle feces distribution patterns were significantly asso- ciated with location of livestock attractants, slope percentage, slope aspect, hydrologic position, and season. Transects located in livestock concentration areas experienced a significantly high- er daily fecal load compared to transects outside of these concen- tration areas (P < 0.001). Percent slope was negatively associated with daily fecal load, but this association had a significant inter- action with slope aspect (P = 0.02). Daily fecal load was signifi- cantly lower during the wet season compared to the dry season (P = 0.002). Daily fecal loading rates across hydrologic positions were dependent upon season. Our results illustrate the opportu- nities to reduce the risk of water quality contamination by strate- gic placement of cattle attractants, and provide a means to pre- dict cattle feces deposition based upon inherent watershed char- acteristics and management factors.
Key Words: water quality, pathogens, grazing distribution, watershed management
Rangeland watersheds on the west slope of the Sierra Nevada Mountain Range serve as important source areas for California's drinking water supply, particularly the San Francisco Bay Area
and the rapidly urbanizing Central Valley. These annual range- lands are grazed by cattle both year around and seasonally. Atwill (1996) reviews concerns raised by drinking water municipalities, public health officials, and regulatory agencies about the potential risk that pathogens (Cryptosporidium parvum and Giardia lam- blia) contained in cattle feces on rangelands poses to drinking water supplies. Systematic assessment of the linkages between rangeland cattle production and transmission of water-borne
Research was funded in part by UC Division of Agriculture and Natural Resources 1995-96 Competitive Grants Program Grant #020.
Manuscript accepted 16 Nov. 02.
Resumen
El objetivo de este estudio fue identificar y modelar los fac- tores ambientales y de manejo asociados con los patrones de deposicion heces fecales de bovinos a traves de cunecas hidrolog- icas de pastizal anual en los pie de monte de la Sierra Nevada.
Se calcularon las tasas diarias de la carga acumulativa de heces fecales de bovinos a partir de las cargas fecales estacionales medidas bianualmente en transectos permanentes de 40 m2 dis- tribuidos a traves de un potrero de 150.5 ha en el condado de Madera, Calif., las mediciones se realizaron en un durante un periodo de 4 ai os, de 1995 a 1998. Las asociaciones entre la carga fecal diaria por estacion, el manejo del ganado y los fac- tores ambientales medidos para cada transecto se determinaron usando un modelo lineal de efectos mixtos. Los patrones de dis- tribucion de la heces del ganado estuvieron significativamente asociados con la localizacion de atrayentes del ganado, el por- centaje de pendiente, el aspecto de la pendiente, la posicion hidrologica y la epoca del ano. Los transectos localizados en areas de concentracion de ganado experimentaron una carga diaria de heces fecales significativamente mayor que la de los transectos fuera de estas areas de concentracion (P < 0.001). El porcentaje de pendiente estuvo asociado negativamente con la carga diaria de heces, pero esta asociacion tuvo una interaccion significativa con el aspecto de la pendiente (P = 0.02). La carga diaria de heces fecales fue significativamente menor durante la epoca humeda en comparacion con la epoca seca (P = 0.002). La carga diaria de heces fecales fue significativamente menor durante la estacion humeda en comparacion con la estacion seca (p = 0.002). Las tasas de carga diaria fecal a traves de las posi- ciones hidrologicas fueron dependientas de la epoca del ai o.
Nuestros resultados ilustran las oportunidades para reducir el riesgo de contaminacion de la calidad del agua mediante la ubi- cacion estrategica de atrayentes del ganado y provee medios para predecir la deposicion de heces fecales de ganado bovino basado en las caracteristicas inherentes del a cuenca hidrologica y factores de manejo.
pathogens to humans requires evaluation of the prevalence of pathogens in cattle herds (Atwill et al. 1999a), identification of associations between livestock management and pathogen preva- lence (Atwill et al. 1999b), and investigation of the hydrologic transport of pathogens from cattle fecal deposits to water-bodies (rate et al. 2000a, Atwill et al. 2002).
The spatial and temporal pattern of feces deposition by cattle grazing annual rangeland watersheds is also an important factor determining the risk rangeland beef cattle production poses to
432 JOURNAL OF RANGE MANAGEMENT 56(5) September 2003
water quality. The timing of feces deposi- tion relative to rainfall-runoff events, and the proximity of deposition to watershed areas contributing runoff, such as riparian areas, determine much of the potential for pathogens in fecal deposits to be transport- ed to downstream water-bodies and poten-
tially into drinking water supplies.
Successful management of cattle feces dis- tribution to reduce risk to water quality requires an understanding of the manage- ment and environmental factors determin- ing the spatial distribution of livestock feces across annual rangeland watersheds during both wet (transport potential high) and dry (transport potential low) seasons.
While there is significant information available about cattle grazing distribution and behavior on rangelands (Bailey et al.
1996), there is limited information avail- able to quantitatively predict the temporal and spatial distribution of livestock feces on annual rangelands.
In general, cattle distribution patterns are variable and determined by the interac- tions of topography, water location, sup- plemental feed placement, forage abun- dance and quality, season, livestock
species and class, and livestock cognitive abilities (Bailey et al. 1996). On annual rangeland in California, Wagnon (1968) concluded that cattle distribution, as mea- sured by forage use, was determined by vegetation type, forage production, slope percentage, and season. The overall nega- tive effect which increasing percent land slope has on cattle distribution and resul- tant forage utilization has long been estab- lished (Mueggler 1965, Cook 1966, Ganskopp and Vavra 1987). Holechek et al. (1998) and Bailey et al. (1996) reach a general consensus that cattle use diminish- es rapidly as site slope exceeds 10%.
Larsen (1996) concluded that cattle fecal distribution tends to be non-uniform and variable across a landscape, estimating that 0.4% to 2.0% of a pasture may be covered by fecal deposits. On rangeland in southeastern Utah, Buckhouse and Gifford (1976) reported 0.2% of the land surface covered with cattle fecal deposits at a stocking rate of 2 ha AUM'.
The ability of managers to modify live- stock distribution with practices such as water development, salt and feed place- ment has been well documented. Lange (1969) coined the term "piosphere" to describe the distinct trail, vegetation, and fecal load patterns radiating out from sheep watering troughs in South Australia.
Miner et al. (1992) and Clawson (1993) found that the location of water troughs could be used to control cattle distribution
and reduce time spent near riparian areas on eastern Oregon rangelands. Larsen (1989) reports cattle fecal loading as high as 7400 deposits ha' (4.5% land surface coverage) below bedding trees in Oregon, and a loading of 6,067 deposits ha' near winter feeding areas. Bailey and Welling (1999) found that the density of cattle fecal pats was 560% greater in areas with supplemental feed (3.3 pats 100 m 2) com- pared to areas without supplemental feed (0.5 pats 100 m 2) on foothill rangeland in Montana. Bailey et al. (2001) illustrated the potential for managers to modify cattle
distribution and forage utilization by strategic placement of supplemental feed in areas cattle would normally under-uti- lize. Harris et al. (1998, 2002) were able to manipulate traditional cattle travel patterns by placement of water and supplemental feed.
The first objective of this study was to identify the environmental and manage- ment factors determining spatial and tem- poral patterns of cattle fecal deposition across annual rangeland watersheds in California's Sierra Nevada foothills under ambient year-long cattle grazing. Our sec- ond objective was to develop a data-driven predictive model to estimate cattle fecal loading under specific environmental and management scenarios in this landscape.
Methods Study Site
The study was conducted on a 150.5 ha pasture at the San Joaquin Experimental Range (SJER) located in the Sierra Nevada foothills in Madera County, Calif.
(37°6'8"N 119°43'33"W). Climate at SJER is Mediterranean with an average annual precipitation of 485 mm occurring almost entirely as rainfall November through May. Vegetation across the pasture is oak savannah with annual grassland understo- ry. Blue oak (Quercus douglasii Hook &
Am.) and interior live oak (Quercus wis- lizenii A.DC.) dominate the overstory, while annual grasses and forbs such as wild oats (Avena fatua L.), rip-gut brome (Bromus diandrus Roth), soft chess (Bromus mollis, L.), and redstem filaree (Erodium cicutarium (L.) L'Her) dominate the annual grassland understory.
The study pasture has a general aspect of north to northwest, with slopes ranging from 0 to 35%. Elevation of the pasture ranges from 335 m to 457 m. The pasture is drainerl by an intermittent creek that normally flows from January through March. Field surveys were conducted dur-
ing storm events occurring January through April of 1995 to identify pasture areas which directly contribute surface runoff to the intermittent stream. The extent of this area varied through the wet season and during individual storms. This area of the pasture was termed the variable source area (VSA) following Hewlett and Hibbert (1967) and Bernier (1985). Based upon the field survey and topography, the VSA for the study pasture was defined as the area within 3 m of the thalwag of the intermittent stream draining the pasture and its ephemeral tributaries as well as the seasonal wetland swales throughout the pasture. Following this definition, the VSA represented 15.8 ha or approximately 10% of the total pasture area.
The 150.5 ha pasture was grazed contin- uously with a 16 to 24 head fall calving, cross-breed cow-calf herd throughout the study period (October 1995 through September 1999). The number of cows varied across years based upon seasonal and annual forage production dynamics.
Annual stocking rates accounting for all herd animals for the 1995, 1996, 1997 and 1998 water year were 0.14, 0.16, 0.11, and 0.13 AU ha' yr', respectively.
Study Design
The study was a longitudinal survey of cattle fecal loading stratified across a set of management practices and environmen- tal factors. In October 1995, 54 permanent 40 m2 (30.5 m long by 1.3 m wide) belt transects were established across the study pasture. In October 1997, an additional 20 transects were established to increase the sample size to 74 transects. Transects were established across the pasture in a strati- fied random design. Transects were estab- lished perpendicular to slope contour.
Stratifications were hydrologic position (ridge, hillslope, or VSA) and livestock concentration area (yes or no). Ridge (1995-96 n = 4;1997-98 n = 6), hillslope (1995-96 n = 29; 1997-98 n = 42), and VSA transects (1995-96 n = 16; 1997-98 n =18) were randomly placed within each hydrologic position. Lastly, livestock con- centration area transects (1995-96 n = 5;
1997-98 n = 8) were established within 30 m of all stock water troughs (2) and sup- plemental feed and salt sites (3) within the pasture. Slope (%), aspect (north, south), hydrologic position (hillslope, ridge, VSA), surface rock cover (%), oak over- story canopy cover (%), cattle trail
through transect (yes, no), and vertical and horizontal distance (m) to nearest live- stock concentration site were measured for each transect.
JOURNAL OF RANGE MANAGEMENT 56(5) September 2003 433
Daily Fecal Load Accumulation Rate
Daily cattle fecal load accumulation rate on a dry weight basis (kg ha' days) was measured in each transect for the wet (1- Oct through 30-Apr) and dry (1-May through 30-Sep) season of the 1995-96, 1996-97, 1997-98, and 1998-99 water years (1-Oct through 30-Sep). Four years of data were collected for 54 transects (established October 1995), and 2 years for 74 transects (additional 20 established October 1997).
On about 1-Oct and about 1-May of each water year, dry weight fecal load (kg ha')
in each transect was measured and all fecal material was cleared from the transect, allowing determination of wet and dry sea- son fecal material accumulation. Dry weight fecal load (kg ha') in each transect was measured using the comparative fecal load methodology (Tate et al. 2000b). This methodology is an ocular estimation tech- nique where the dry weight of each indi- vidual fecal pat in the transect is estimated and the fecal load of the transect is calcu- lated as the sum of individual fecal pat dry weights in the transect. Daily fecal load accumulation rate on a dry weight basis (DFLAR) (kg ha' day') was then calculat- ed for each plot for each of the 2 seasons for each of the 4 years by dividing the fecal load per sample period by the number of days in that sample period.
Statistical Analysis and Model Development
The basic data structure was a biannual repeated measure of cattle feces accumula- tion across 54 transects for 4 years and an additional 20 transects for 2 years, result- ing in 511 complete data records. The association between the daily fecal load accumulation rate per season (wet, dry) and the various transect management and environmental factors was determined using a linear mixed effects model (Pinheiro and Bates 2000). Examination of residual errors demonstrated marked het- eroscedasticity within the daily fecal load accumulation rate data which was over- come by a square root transformation of this data in conjunction with the use of an exponential variance function (Pinheiro and Bates 2000).
In the linear mixed effects analysis, management and environmental factors were modeled as fixed effects; transect was modeled as a random or group effect (74 unique transects read either 4 to 8 times); and the outcome variable was the square root of the daily fecal load accumu- lation rate (DFLARO'5) for each transect.
Each management and environmental fac- tor and all 2-way interactions were offered to the model in a forward stepping algo- rithm with a P-value of <0.10 required for entry into the final model. Final model coefficients were estimated using restrict- ed maximum likelihood, and P-values for each coefficient was estimated using the Wald statistic (Pinheiro and Bates 2000).
Results Linear Mixed-Effects Model
After controlling for substantial group or random effects, in part a result of repeated measures on each transect, a vari- ety of management and environmental fac- tors were determined to be significantly (P
< 0.1) associated with daily fecal load accumulation rate (Table 1). The overall fit of the model predicting the square root of daily fecal load accumulation rate
(DFLARO'5) is illustrated by the agreement between the observed values and those predicted by the linear mixed effects model (Fig. 1).
The coefficients in Table 1 quantify the
expected effect of each factor on DFLAR°'S. For the categorical factors in the model (year, concentration site, aspect, season, and hydrological position) the coefficient represents the expected effect of each level (e.g. 1996, 1997, 1998 for year) of the factor relative to the reference level (e.g. 1995 for year) for the factor.
For slope, the only continuous factor in the model, the coefficient represents the incremental change in DFLAR°'5 per incre- mental change in percent slope. Surface rock cover (%), oak overstory canopy (%), vertical and horizontal (m) distance to nearest livestock concentration site, and presence of a cattle trail in the transect were not significantly associated with daily fecal load accumulation rate (P >
0.10).
Management Factors
Transects located in livestock concentra- tion areas experienced a significantly higher DFLARO'5 (0.14 kg ha' day') com- pared to transects outside of these concen- tration areas (P < 0.001) (Table 1). There was a significant year effect such that
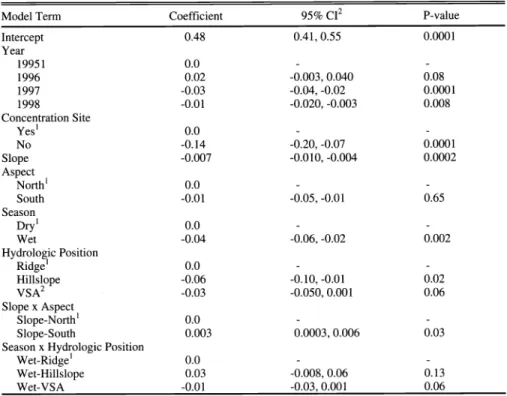
Table 1. Linear mixed-effects model predicting square root of daily fecal load accumulation rate (DFLAR°'5) (kg ha'' day') by cattle grazing annual rangeland at San Joaquin Exjerimental Range, 1995-98. Coefficients quantify the expected effect of each factor on DFLAR 5. For the categorical factors (year, concentration site, aspect, season, and hydrological position) the coeffi- cient represents the expected effect of each factor level relative to the reference level. The coeffi- cient for slope represents the incremental change in DFLAR°'5 per incremental change in per- cent slope.
Model Term Coefficient 95% CI2 P-value
Intercept 0.48 0.41, 0.55 0.0001
Year
19951 0.0
1996 0.02 -0.003, 0.040 0.08
1997 -0.03 -0.04, -0.02 0.0001
1998 -0.01 -0.020, -0.003 0.008
Concentration Site
Yes' 0.0
No -0.14 -0.20, -0.07 0.0001
Slope -0.007 -0.010, -0.004 0.0002
Aspect
North' 0.0
South -0.01
Season
Dry' 0.0
Wet -0.04
Hydrologic Position
Ridge' 0.0
-0.05, -0.01
-0.06, -0.02
0.65
0.002
Hillslope -0.06 -0.10, -0.01 0.02
VSA2 -0.03 -0.050, 0.001 0.06
Slope x Aspect
Slope-North' 0.0
Slope-South 0.003
Season x Hydrologic Position
Wet-Ridge' 0.0
0.0003, 0.006 0.03
Wet-Hillslope 0.03 -0.008, 0.06 0.13
Wet-VSA -0.01 -0.03, 0.001 0.06
21Reference category for each categorical variable.
95 % confidence interval for coefficient (lower, upper).
3Variable source area.
434 JOURNAL OF RANGE MANAGEMENT 56(5) September 2003
NO
0.0
0.0 0.5 1.0 1.5
Observed DFLAR°" (kg dry feces ha x days')
2.0
Fig. 1. Square root of observed daily cattle fecal load accumulation rate (DFLAR°'5) versus DFLAR°'5 predicted by a linear mixed effects model containing year (1995, 1996, 1997, 1998), livestock concentration site (Yes, No), slope (%), aspect (north, south), season (wet, dry), hydrologic position (ridge, hillslope, variable source area), a slope by aspect interac- tion, and a season by hydrologic position interaction.
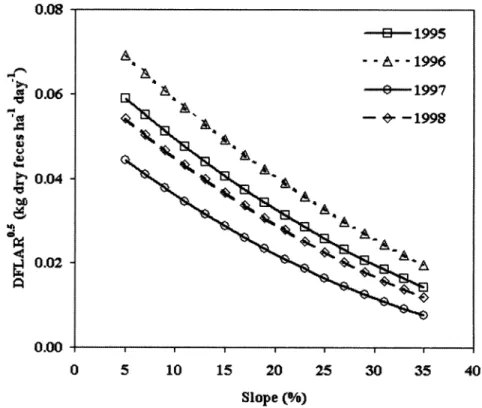
daily fecal load accumulation rate was
lower during 1997 and 1998 compared to 0.0 1995, while 1996 was higher than 1995
(Table 1, Fig. 2). The significance of year in the model may indicate the sensitivity of this fecal loading estimation method to
changes in stocking rate. 0.06
Environmental Factors
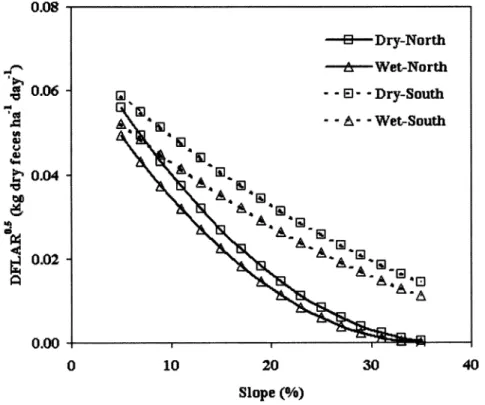
Percent slope of the transect was nega- tively associated with daily fecal load accumulation rate, but this association had a significant interaction with aspect (P = 0.02) such that for every 10% increase in slope, DFLARO'5 decreased by 0.07 kg ha' day' for north facing slopes yet decreased by only 0.04 kg ha' day' for south facing slopes (Fig. 3). South-facing slopes tended to accumulate more cattle fecal material relative to equivalently sloped north-fac- ing slopes. The difference between the cattle fecal loading rates for north-facing as compared to south-facing slopes becomes negligible as percent slope approaches 0 (Fig. 3), indicating that the effect of aspect on DFLAR°5 is most pro- nounced at steeper slopes. This point is corroborated by the lack of significance for the main term of aspect (P = 0.65) (Table 1).
0.00 0
Daily fecal load accumulation rate was significantly lower during the wet season compared to the dry season (P = 0.002, Table 1, Fig. 3 and 4). Hydrologic position within the watershed was associated with the rate of fecal accumulation, such that ridges accumulated more fecal material than hillslopes and the variable source area (Fig. 4). The association between hydrological position and cattle fecal material deposition was in part influenced by the prevailing season, in that there was a significant interaction term between sea- son and hydrologic position (P < 0.001).
Relative to ridges and the variable source area (VSA), hillslopes experienced the least reduction in fecal accumulation dur- ing the wet season compared to the dry season (Fig. 4).
Discussion
These results indicate that a complex and interacting set of management and environmental factors must be considered when measuring, predicting, or managing feces loading by cattle across annual rangeland watersheds. The data-driven sta- tistical model reported in Table 1 explicit- ly predicts the spatial-temporal distribu-
5 10 15 20 25 30 3 40
Slope )
Fig. 2. Predicted square root of daily fecal load accumulation rate (DFLAR°'5) for each study year as a function of slope (%).
JOURNAL OF RANGE MANAGEMENT 56(5) September 2003 435
0 10 20 30 Slope %
40
Fig. 3. Predicted square root of daily cattle fecal load accumulation rate (DFLAR°'5o as a function of season (wet, dry), aspect (north, south), and slope (%). Units for DFLAR are kg dry feces ha day'.
tion of daily fecal material accumulation rate across an annual rangeland watershed.
Fecal loading patterns likely do not cone- late perfectly with variables used to describe grazing distribution (forage uti- lization patterns) or livestock behavior (time spent foraging, loafing, traveling).
While there is certainly overlap in the fac- tors determining livestock grazing behav- ior and fecal loading on a given landscape, there are also factors unique to each of these components of livestock grazing.
Ideally, a single robust model predicting both livestock activity (grazing distribu- tion and behavior) and resultant environ- mental impacts (fecal loading, forage uti- lization, riparian area damage) will be developed.
Our work shows that water troughs and supplemental feed significantly increase daily fecal accumulation rate at, and near, sites where these attractants are located.
This result illustrates the potential for man- agement to increase or decrease risk of manure-borne contaminants to water quali- ty based upon the location of livestock attractants within a watershed or riparian pasture. Placement of a cattle attractant near a stream will increase daily fecal load- ing rate and risk to water quality, while strategic placement away from the stream can decrease fecal loading and associate risks near the stream. Previous studies
0.12
r,
0.100.02
0.00
0 2 4
have reported substantially higher cattle fecal loading near supplemental sites and bedding areas (Larsen 1996, Bailey and Welling 1999). Our results correlate well with research illustrating the potential to modify cattle distribution and forage uti- lization by strategic placement of supple- mental feed (Bailey et al. 2001, Harris et al.
1998, 2002). Managers should place cattle attractants in watershed and pasture areas which have limited surface runoff connec- tion to streams or other water-bodies.
Ridges and hillslopes are the most hydrologically remote areas, while the variable source areas (VSA) are the most hydrologically connected areas on range- land watersheds in the south Sierra Nevada foothills. Cattle fecal loading rate across these landscape positions is depen- dent upon season (Fig. 4). Fecal loading rate was significantly greater in the VSA during the dry season compared to the wet season. However, loading rates in the VSA declined dramatically, to levels equal to hillslope positions, during the wet sea- son. The affinity of livestock for VSAs during the dry season can be attributed to the presence of green feed and water dur- ing the first half of the season (May-July) according to work on the San Joaquin
6
"lope (¼)
- p Ridge-Dry p Hillslope-Dry p-'AAA-Dry
w . B . r Ridge-Vet ...
...
Hillslope-Wet ,.. ... YSAt-Wet8 10 12
Fig. 4. Predicted square root of daily cattle fecal load accumulation rate (DFLAR°'5) as a function of season (wet, dry), hydrologic position (ridge, hillslope, variable source area
(VSA)), and slope (%).
436 JOURNAL OF RANGE MANAGEMENT 56(5) September 2003
Experimental Range (SJER) by Wagnon (1968). During the wet season, green feed and surface water (pools and puddles) are uniformly available across these water- sheds providing cattle little incentive to selectively utilize swales and other ripari- an areas. Harris et al. (1998) found similar seasonal trends in the spatial distributional patterns of livestock on the SJER.
Regardless of season, ridge positions were associated with higher fecal loading rates than either hillslope or VSA posi- tions. Based upon 3 years of observations of beef cattle activity across 4 pastures, Wagnon (1963) reported that beef cattle at the SJER spent 58 to 85% of their annual feeding time on open slopes and 22 to 25% on swales. Wagnon (1963) does not differentiate cattle feeding time spent on hillslope v, ridge positions. Ridges at SJER are characterized by open canopy conditions and slopes less than <5% while hillslopes are characterized by slopes ranging from 5 to 35% with variable brush, canopy and rock cover (Wagnon 1968). The higher fecal loading rate on ridges might be explained by the affinity of cattle for ridge positions relative to hill- slopes because of the low slope, open con- ditions, and favorable microclimate of this landscape position. The apparent preferen- tial deposition of fecal material by cattle on ridges is an association upon which managers can capitalize upon by strategic placement of cattle attractants in these hydrologically remote areas.
As land slope in the study pasture increased to 35%, fecal loading by cattle was significantly reduced. Fecal loading rate decreased 50 to 99% at locations with a 20 to 30% slope compared to sites with a
1 to 5% slope. In a theoretical landscape grazing distribution model, Bailey et al.
(1996) discuss the use of slope as an abiot- ic factor constraining site forage value as slope increases. While slope is clearly a factor determining cattle distribution across rangeland landscapes, both
Mueggler (1965) and Cook (1966) clearly illustrate that the effect of slope on cattle use of an area is not a simple relationship.
Cook (1966) found significant interactions between slope (%) and other variables (distance to water, % maximum slope between site and water, etc.) when attempting to predict site use by cattle on mountain range in northern Utah.
We found that slope and aspect (north, south) interacted to determine fecal load- ing rates. We observed preferential depo- sition of fecal material by cattle along steeper slopes facing south compared to steeper slopes facing north. However, the
magnitude of the effect of aspect on fecal loading rate diminished substantially as slope approaches zero (Fig. 3). In this landscape, aspect can account for differ- ences in microclimate, as well as in the occurrence, amount and composition of forage production. Combinations of favor- able forage and microclimate create condi-
tions preferred by the cattle at higher slopes with a southerly aspect compared to a northerly aspect.
We found significantly lower daily fecal loading rates (on a dry weight basis) dur- ing the wet season compared to the dry season. Forage quality, digestibility, and moisture content is higher on annual rangeland during the winter growing sea- son compared to the summer dormant sea- son. George et al. (1984) defined the annu- al forage production curve for SJER.
While the growing season can last from October through April, the bulk of forage production occurs from roughly March through April. The period October through February is often characterized as "the inadequate green season", when forage growth is'limited due to cold temperatures.
Forage during the period May through September is composed of the dry residual forage produced during the period October through April, with some green forage remaining in the swales until mid June.
The reduced daily fecal loading rate (on a dry weight basis) observed in this study during October through April relative to the May through September dry season may be a result of several factors: 1.
Inadequate feed availability during the period October through February; 2.
Greater forage use efficiency resulting in less available preferred forage creating less fecal output; and 3. More rapid ero- sion and decay of deposited feces. Without direct measurements of forage amount, quality, intake, fecal output, and feces decay across the wet season it is difficult to determine which factors contributed to the lower daily fecal loading rates observed in this study. For future work, we recommend that timing of fecal load measurements be matched to identifiable changes in forage production and quality.
On annual rangeland we recommend sam- pling to capture the October through February inadequate green season, March through April to capture the rapid spring growth season, May through June to cap- ture the period when green forage remains in swales while upland forage is dry, and July through September when forage is dry throughout the landscape.
Conclusions
Spatial and temporal patterns of cattle fecal deposition across oak savannah watersheds in California's southern Sierra Nevada foothills is dependent upon a com- plex and interacting group of management and environmental factors. We were able to successfully identify and model the effect of many of these variables.
However, information on seasonal forage production, forage quality, and microcli- mate across the landscape is required to fully interpret spatial and temporal fecal loading associations identified in our study. Factors we found to affect cattle feces distribution included location of livestock attractants, slope, aspect, topo- graphic position, and season. Our results illustrate some of the opportunities avail- able to grazing managers on these range- lands to reduce the risk to water quality from cattle feces by strategic placement of supplemental feed grounds and stock water troughs. Our results also provide a means to predict cattle feces deposition, allowing identification and prioritization of risk to water-bodies across this land- scape based upon both inherent watershed characteristics and management factors on this range type.
For future studies, it would be beneficial to integrate the examination of livestock distribution, behavior, resultant environ- mental impacts, microclimate, forage, and topographic factors simultaneously across a single landscape. Numerous efforts have been, and continue to be, conducted where only livestock distribution and behavior, or only livestock environmental impacts are measured. A comprehensive approach across several range types is required before livestock distribution - behavior -
management - inherent site characteristics - environmental impacts can be under- stood and predicted at multiple spatial and temporal scales.
Literature Cited
Atwill, E.R. 1996. Assessing the link between rangeland cattle and water-borne Cryptosporidium parvum infection in humans. Rangelands.18:48-51.
Atwill, E.R., E.M. Johnson, and M.C.
Pereira.1999b. Association of herd compo- sition, stocking rate, and duration of calving season with fecal shedding of Cryptosporidium parvum oocysts in beef herds. J. Amer. Veterinary Med. Assoc.
215:1833-1838.
JOURNAL OF RANGE MANAGEMENT 56(5) September 2003 437