http://www.scirp.org/journal/ojg ISSN Online: 2161-7589
ISSN Print: 2161-7570
DOI: 10.4236/ojg.2017.79090 Sep. 14, 2017 1352 Open Journal of Geology
Application of Chemical Dynamics Method in
Solving Hydro-Geological Parameters
Hao Zhang, Duoxi Yao, Haifeng Lu, Ningning Zhu, Liang Xue
College of Earth and Environment, Anhui University of Science and Technology, Huainan, China
Abstract
With the increasing of coal mining depth, the coal seam floor is threatened more and more seriously with the limestone aquifer of Taiyuan Formation. In order to make the coal seam floor water inrush accident to be effectively pre-vented, it is very important to ascertain the hydro-geological condition of the research area and adequately gain hydro-geological parameters. Based on the theory of chemical dynamics, the chemical dynamical equation of the mineral was obtained. The chemical dynamical equation of the mineral and the Dar-cy’s Law were combined to derive the expression of permeability coefficient and transmissibility coefficient that was indicated by hydro-chemistry index. Based on the data of water quality analysis in the research area, the hydro-geology parameter of the aquifer of Taiyuan Formation was calculated. And it was compared with what the hydro-geology parameter was determined by the data of pumping test. The results show that the permeability coefficient (K) of the research area is 1.7512 m/d, and transmissibility coefficient (T) is 42.0282 m2/d. The calculated results of chemical dynamics and pumping test results are little different between them. And it has certain practical significance in the mine water control. It provides an effective method for obtaining hydro-geological parameters.
Keywords
Hydro-Geology Parameter, Chemical Dynamics Equations, Permeability Coefficient, Transmissibility Coefficient
1. Introduction
With the increasing demand for coal resources in China, the work of coal min-ing is gradually developed into the deep minmin-ing depth and complex geological conditions [1] [2] [3] [4]. The continuous increase of mining depth has become the main method of mining. Along with the continuous increase of mining How to cite this paper: Zhang, H., Yao,
D.X., Lu, H.F., Zhu, N.N. and Xue, L. (2017) Application of Chemical Dynamics Method in Solving Hydro-Geological Parameters. Open Journal of Geology, 7, 1352-1361.
https://doi.org/10.4236/ojg.2017.79090
Received: June 28, 2017 Accepted: September 11, 2017 Published: September 14, 2017
Copyright © 2017 by authors and Scientific Research Publishing Inc. This work is licensed under the Creative Commons Attribution International License (CC BY 4.0).
http://creativecommons.org/licenses/by/4.0/
DOI: 10.4236/ojg.2017.79090 1353 Open Journal of Geology depth, the Mining under Pressure has become the main method of mining. And the threat of coal seam mining will gradually aggravate from the depth of the aquifer of Taiyuan Formation. The safety of coal seam floor is very important [1] [2] [3]. The main reason is the complex geological and hydro-geological condi-tions of aquifer and insufficient understanding of hydro-geological condicondi-tions. Meanwhile, it is difficult to obtain the basic hydro-geological parameters. There-fore, it is of great practical significance to identify the aquifer properties and hy-dro-geological parameters of the coal seam floor before mining, which is of the most importance for the prevention and control of water in coal mines [3] [4] [5] [6].
For a long time, many methods were usually used in the process of obtaining hydro-geological parameters. For example, pumping test, slug test, water pressure test and so on [4] [5]. According to Zhang H.Y. et al. [6], taking the South deep mining area of the Chensilou coal as the research object, the hydro-geological parameters of limestone aquifer were calculated by unsteady flow dewatering test. According to Ju X.M. et al. [7], the pumping tests and slug tests at the same time in the Laosui river of Huaibei in Anhui province were carried out, and the results of the two methods were compared and analyzed. According to Hu W.Y.
et al. [8], a simple method of calculating hydro-geological parameters was in-troduced by the observed dynamic data of ground water level for a long time. These methods of obtaining hydro-geological parameters could be summarized as hydrodynamic methods [4]-[9]. In recent years, experts and scholars have put forward the method of chemical dynamics to obtain hydro-geological parame-ters [10]-[15] and the quantitative evaluation of hydro-geological conditions in the study area is realized.
On this basis, this paper took a mine in Anhui province as an example. The expression of hydro-geological parameters was derived by using the method of Chemical Dynamics. And the hydro-geology parameter of the limestone aquifer of Taiyuan Formation was calculated. The data of pumping test in the research area was collected and arranged. The calculated results of chemical dynamics and pumping test results were compared to analyze the reason for the deviation.
2. Chemical Dynamics Parameters
2.1. Determination of Ion Activity
In the ground water, part of the ions does not work in the reaction process due to the interaction of various ions. This leads to a difference between the effective concentration of the ions and the true concentration of the ions in the process of chemical reaction [10] [11] [12] [14]. Therefore, it is necessary to correct the measured concentration in the ground water. The corrected concentration is known as the Ion Activity and is represented by αi. The Relationship between Ion Activity (αi) and the true concentration of the ions (ci) is as follows [10]:
i i ci
α = ×γ (1)
DOI: 10.4236/ojg.2017.79090 1354 Open Journal of Geology At this time the theory of Debye and Hükel is used to explain difference be-tween the ground water solution and ideal solution. And the formula for calcu-lating the activity coefficient of an ion solution by mathematical method is as follows [10] [11]:
2
lg 1
i i
i Az I
Ba I γ = −
+ (2)
where, A and B are constants that depend on the temperature of the water. ai
is constant that depends on the ionic radius. I is the ionic strength of the solu-tion.
The ionic strength (I) is a measure of the electrostatic field that formed by various ions in the solution. And the formula for calculating the ionic strength (I) is as follows:
2
1 1 2
M
i i i
I m z
=
=
∑
where, mi is the substance concentration of the ion. zi is the Valence number of ion. M is the kinds of ion.
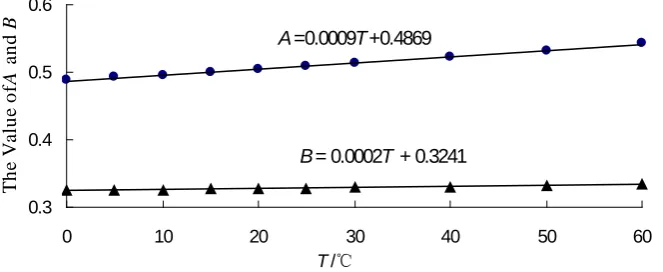
The theory of Debye and Hükel was applied to the temperature of 0 to 60. The values of A and B are as follows.
[image:3.595.211.543.394.530.2]According to the data in Table 1, the curve fitting of T with A and B was made. The curve fitting is as follows (Figure 1).
[image:3.595.211.542.577.726.2]Figure 1. The curve fitting of T with A and B.
Table 1. The value of A and B in different temperature.
T/˚C A B
0 0.4883 0.3241
5 0.4921 0.3249
10 0.4960 0.3258
15 0.5000 0.3262
20 0.5042 0.3273
25 0.5085 0.3281
30 0.5130 0.3290
40 0.5221 0.3305
50 0.5319 0.3321
60 0.5425 0.3338
A=0.0009T+0.4869
B= 0.0002T + 0.3241
0.3 0.4 0.5 0.6
0 10 20 30 40 50 60
T/℃
T
h
e V
al
u
e
o
f
A
a
n
d
DOI: 10.4236/ojg.2017.79090 1355 Open Journal of Geology
2.2. Determination of Saturation Index
The Saturation index is a parameter to determine the state of water and miner-als, and is an important means to evaluate the formation and development of karst. It is expressed by the symbol of SI. When SI > 0, it means that the mineral is in a super-saturation state. When SI = 0, it means that the mineral is in a sa-turation state. When SI < 0, it means that the mineral is in a dissolved condition. The multi mineral system refers to the dissolution of calcite, dolomite, and gypsum in the CO2-H2O system. Under these circumstances, the saturation in-dex is calculated by the mineral composition of ion activity and solubility prod-uct constant. The saturation index of Calcite, Dolomite and Gypsum are as fol-lows:
(
)
(
)
(
)
(
)
(
)
2 3 2 2 3 2 2 42 Ca HCO H
2 2
2 Ca Mg HCO H
Ca SO c c d d g g K K K K K
β α α α
β α α α α
β α α
+ − + + + − + + − = ⋅ ⋅ = ⋅ ⋅ = ⋅ (3)
where, αi is the ion activity of i, K1 is the first-order dissociation constant of car-bonic acid, K2 is the second-order dissociation constant of carbonic acid, Kc is the dissociation constant of Calcite, Kd is the dissociation constant of Dolomite,
Kg is the dissociation constant of Gypsum.
3. Calculation of Hydro-Geological Parameters
3.1. The Darcy’s Law Is Expressed by Chemical Indexes
If the component of i is generated through many minerals, the equation of the mineral dissolution process can be superimposed. In some monographs [10] [12] [16] [17] [18], according to the theory of chemical dynamics, the chemical dy-namics equation for the dissolution of minerals was derived. And the equation is as follows:
(
)
1 d 1 d m ijij j j
j a
k
t =
ν
β
=
∑
− (4)The Equation (4) was deformed as follows:
(
)
1 d d 1 d d m ij iij j j
j i a s
k
t s =
ν
β
⋅ =
∑
− (5)In the process of ground water movement, the dsi/dt can be considered as the infiltration velocity (Vni) on the groundwater flow line. If Vni is substituted into Equation (5), it will get the following relationship:
(
)
1 d 1 d m ijni ij j j
j i a
V k
s =
ν
β
⋅ =
∑
− (6)(
)
(
)
1 1
1 d
1
d d d
m m
ij j j i
ij j j j j
ni
ij i ij
k S k V S ν β ν β α α = = − −
DOI: 10.4236/ojg.2017.79090 1356 Open Journal of Geology where, j is the number of dissolved mineral, i is the component of ion from mineral dissolution, Vniis the infiltration velocity of the component of i on the groundwater flow line, αij is the ion activity of the component of i from the min-eral of j, Si is the flow distance of the component of i along with the stream line,
vij is the stoichiometric number of the component of i that dissolve from the mineral of j, kj is the chemical dynamics constant for the dissolution of mineral of j.
Because of the ion activity (αi) and the saturation index (βj) are the functions of time and space, the Equation (7) can be integrated. It will get the following relationship:
(
)
1
d 1 d
ijB iB
ijA iA
m S
ni ij S ij j j i
j
V αα α ν k β S
=
= −
∑
∫
∫
(8)The Equation (8) can be simplified by using the trapezoid formula. The Equa-tion (8) was deformed as follows:
(
)
1 2 2
m
iAB ij j jA jB
j ni
ijAB
S k
V
ν β β
α = ∆ − − = ∆
∑
(9)where, ∆SiAB is the flow distance of the component of i from A to B, ∆
α
ijAB isthe ion activity of the component of i from A to B, βjAis the saturation index of the mineral of j at A, βjBis the saturation index of the mineral of j at B.
3.2. Expression of Hydro-Geological Parameters
If Equation (9) is substituted into the expression of the Darcy’s Law that is ex-pressed by Hydraulic index, it will get the following relationship:
(
)
2 1 2 2 miAB ij j jA jB
nijAB j AB iAB ijAB S k V K I h
ν β β
α = ∆ − − = = ∆ ∆
∑
(10)(
)
2 1 2 2 miAB ij j jA jB
nijAB j AB iAB ijAB S k V T I h
ν β β
α = ′ ∆ − − = = ∆ ∆
∑
(11) j jk′ = ⋅k M (12)
where, KAB is the permeability coefficient, ∆h is the height deviation between A and B. M is thickness of the limestone aquifer of Taiyuan Formation.
3.3. Expression of Chemical Dynamics Constant
There are two methods for obtaining chemical dynamics constants, which are laboratory test and field test. The chemical dynamics constants were obtained by taking field experiments in this paper. And the equation is as follows:
(
)
2 2 2 AB ijAB jAB jA jB
K h a
k
S β β
∆ ∆ =
DOI: 10.4236/ojg.2017.79090 1357 Open Journal of Geology where, K is the permeability coefficient that was obtained by hydraulic index.
According to the results of pumping test in the study area, the K is equal to
1.3913 m/d.
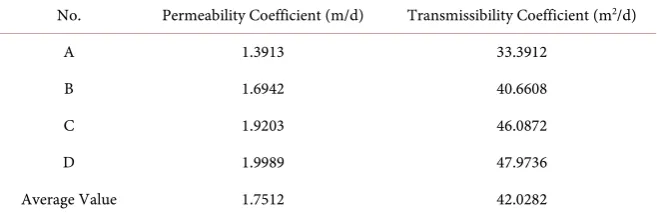
On the basis of the chemical dynamics constants was obtained by predeces-sors, the chemical dynamics constants of Calcite, Dolomite and Gypsum were calculated respectively. The corresponding permeability coefficient (K) and trans-missibility coefficient (T) were obtained by using the chemical dynamics con-stants of Calcite, Dolomite and Gypsum. Then the average of permeability coef-ficient (K) and transmissibility coefficient (T) were calculated.
The chemical dynamics constants of Calcite (c), Dolomite (d) and Gypsum (g) are expressed as follows:
(
)
(
)
2 2 2
4
Ca Mg SO
2
2
2
AB c
AB cA cB
c c K h k
S
k k M
α α α
β β + + − ∆ ∆ − ∆ − ∆ = ∆ − − ′ = ⋅ (14)
(
)
2 Mg 2 2 2 AB dAB dA dB
d d
K h k
S
k k M
α β β + ∆ ∆ = ∆ − − ′ = ⋅ (15)
(
)
2 4 SO 2 2 2 AB gAB gA gB
g g
K h k
S
k k M
α β β − ∆ ∆ = ∆ − − ′ = ⋅ (16)
3.4. The Calculation of Hydro-Geological Parameters by
Chemical Indexes
The research area is located in the south of the mine field. The main aquifers in-clude the first to fourth aquifer of Cenozoic Erathem, the sandstone aquifers in coal measures and the limestone aquifer of Taiyuan Formation. The aquifer in the research area is shown in Figure 2. The limestone aquifer of Taiyuan Forma-tion is one of the major hidden dangers of mine filling water. And it is of great significance to research the limestone aquifer of Taiyuan Formation.
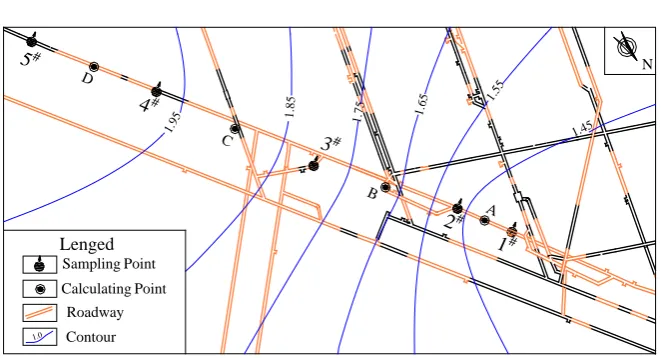
A total of 10 water samples were taken at 1 to 5# sampling points in the re-search area, and there are 2 water samples at each sampling point. The 10 water samples were used for water quality analysis. The distributions of sampling points are shown in Figure 3. The results of water quality analysis are shown in Table 2.
According to the geological report of the research area, the thickness of the limestone aquifer of Taiyuan Formation is 24 meters. So, the chemical dynamics constant could be calculated by Equation (14), Equation (15) and Equation (16). The results are shown in Table 3.
DOI: 10.4236/ojg.2017.79090 1358 Open Journal of Geology
[image:7.595.209.539.291.458.2]Figure 2. The aquifer in the research area.
Figure 3. The distribution of sampling point.
Table 2. The results of water quality analysis.
Sampling Point No.
The Content of Ions (mg/L)
pH Cl− 2
4
SO− HCO3
− 2
3
CO− Na+ + K+ Ca2+ Mg2+
1# 1 278 667 428.17 5.17 276.9 214 81.5 7.32
2 243 614 430.56 5.32 254.5 198 78.1 7.27
2# 3 265 606 428.17 4.19 270.7 215 82.9 7.33
4 255 619 394.68 4.53 258.4 201 79.3 7.45
3# 5 262 608 425.77 5.95 269.9 209 80.5 7.41
6 248 596 428.17 5.36 256.4 201 76.1 7.27
4# 7 252 349 576.47 5.25 386.5 109 46.4 7.31
8 231 376 552.55 5.38 371.4 98 45.4 7.28
5# 9 241 404 516.67 4.96 327.4 134 58 7.41
10 244 600 428.17 4.89 287.2 167 79.2 7.35 Siltstone
Fine Sandstone The First Aquifer
The Second Aquifer
The Third Aquifer
The Coal Aquifer
The Fourth Aquifer
The Limestone
Aquifer
Medium Sandstone Sandy
Gravel
Limestone Coal Seam
1#
2#
3#
4#
5#
Lenged Sampling Point
Roadway
[image:7.595.210.538.510.728.2]DOI: 10.4236/ojg.2017.79090 1359 Open Journal of Geology
Table 3. The chemical dynamics constant.
No. Calcite Dolomite Gypsum
c
k kc′ kd kd′ kg kg′
A 7.4002 × 10⁻⁴ 1.776 × 10⁻² 3.6754 × 10⁻⁴ 8.8209 × 10⁻² 2.4898 × 10⁻⁴ 5.9755 × 10⁻²
B 1.7354 × 10⁻⁵ 4.1649 × 10⁻⁴ 6.7415 × 10⁻⁵ 1.6179 × 10⁻³ 2.8497 × 10⁻⁵ 6.8393 × 10⁻⁴
C 4.7254 × 10⁻⁴ 1.1341 × 10⁻² 2.8667 × 10⁻³ 6.8801 × 10⁻² 2.1395 × 10⁻⁴ 5.1348 × 10⁻³
D 8.0185 × 10⁻⁵ 1.9244 × 10⁻³ 8.6477 × 10⁻⁴ 2.0754 × 10⁻² 2.5215 × 10⁻⁵ 6.0516 × 10⁻³
Table 4. The calculation of hydro-geological parameters
No. Permeability Coefficient (m/d) Transmissibility Coefficient (m2/d)
A 1.3913 33.3912
B 1.6942 40.6608
C 1.9203 46.0872
D 1.9989 47.9736
Average Value 1.7512 42.0282
The contour map of the permeability coefficient in the research area is shown as follows.
3.5. Evaluation of Hydro-Geological Conditions
It can be seen from Figure 4 that the permeability coefficient of the limestone aquifer of Taiyuan Formation in the whole research area has little change in general. According to the results of the hydro-geological parameters in Table 4, we can know that the permeability coefficient in research area is equal to 1.7512 m/d and the transmissibility coefficient is equal to 42.0282 m2/d. According to classification standard of permeability coefficient and transmissibility coefficient, it can be concluded that the limestone aquifer of Taiyuan Formation has strong water permeability and medium water conductivity. According to the results of pumping test, the permeability coefficient is 1.3913 m/d and the transmissibility coefficient is 33.3912 m2/d. The comparison between the results of the pumping test and the hydro-geological parameters of the water chemistry index shows that the permeability coefficient and the conductivity coefficient are not signifi-cantly different. To a degree, it is reliable that the results of hydro-geological pa-rameters were obtained by water chemistry index. It also provides a new method for the evaluation of hydro-geological condition.
4. Conclusions
[image:8.595.210.539.230.339.2]DOI: 10.4236/ojg.2017.79090 1360 Open Journal of Geology
Figure 4. Contour map of permeability coefficient.
2) The little difference between the hydro-geological parameters was obtained by the chemical dynamics method and was obtained from the pumping test. It shows that it is feasible to evaluate hydro-geological condition from the point of view of chemical dynamics. And the chemical dynamics has a certain application prospect.
3) In order to improve the accuracy of the calculation of hydro-geological pa-rameters by chemical dynamics method, the following points should be made in the following work: a) More water samples are collected for water quality analy-sis; b) The sampling points should be evenly distributed in time and space; c) The retrieved water samples should be immediately analyzed for water quality to avoid evaporation of water and affect the results of water quality analysis; d) Water samples were collected for water quality analysis to reduce test errors.
Acknowledgements
The project was supported by National Natural Science Foundation of China (51474008).
References
[1] Xu, X.H. and Wang, J. (1991) Prediction of Water Inrush in Coal Mine. The
Geo-logical Publishing House, Beijing.
[2] Wu, Q., Zhao, S.Q. and Dong, S.N. (2013) Coal Mine Water Control Manual. China
Coal Industry Publishing House, Beijing.
[3] Jing, D.W. (2002) Research Status and Outlook of Water Outburst from Seam Floor in China Coal Mines. Coal Science and Technology, 30, 1-4.
[4] Xu, Y.Q. and Wu, J.C. (2015) Groundwater Dynamics. 3rd Edition, The Geological
Publishing House, Beijing.
[5] Zhang, R.Q., Liang, X. and Jing, M.G. (2011) Fundamentals of Hydrogeology. 6th
Edition, The Geological Publishing House, Beijing.
[6] Zhang, H.Y., Li, J.L. and Feng, Y.L. (2012) Dewatering Test of Floor Aquifers in Deep Mining Area of Coal Mine. Safety in Coal Mines, 43, 30-36.
[7] Ju, X.M., He, J.T. and Wang, J.J. (2011) Comparison of the Determination of
Hy-1#
2#
3#
4#
5#
Lenged Sampling Point
N
A B
C D
1.0
1.95
1.85 1.75 1.65
1.55
1.45
Roadway Calculating Point
DOI: 10.4236/ojg.2017.79090 1361 Open Journal of Geology
drogeological Parameters from Pumping Tests and Slug Tests. Geotechnical Inves-tigation and Surveying, No. 1, 51-63.
[8] Hu, W.Y. and Yan, L.Y. (1996) Calculation of Hydro-Geological Parameters of Wa-ter-Carrying Strata. Journal of Xi’an Mining Institute, 16, 44-47.
[9] Zhao, L.L., Xiao, C.L. and Chen, C.L. (2015) Determination of Hydro-Geological Parameters by a Variety of Methods Based on the Pumping Test. Chinese Journal of Underground Space and Engineering, 11, 306-309.
[10] Qian, H., Ma, Z.Y. and Li, P.Y. (2012) Hydrogeochemistry. 2nd Edition, The Geo-logical Publishing House, Beijing.
[11] Cao, Y.Q., Hu, K.R. and Li, Z.S. (2008) Groundwater Chemical Dynamics and Eco-Environment Zonation. Science Press, Beiing.
[12] Cao, Y.Q. and Hu, K.R. (1994) Karst Chemical Environment Hydrogeology. Ji’lin
University Press, Changchun.
[13] Duan, S.Y. and Wu, H.F. (2015) The Hydrogeological Parameters Calculated by Chemical Kinetic Method of Groundwater Are Used to Quantitatively Evaluate Hydrogeological Conditions. Hydrogeology and Engineering Geology, 5, 62-65. [14] Huang, Y. and Zhou, Z.F. (2007) Determination of Hydrogeological Parameters
Based on Hydrochemical Dynamics Method. Chinese Journal of Rock Mechanics
and Engineering, 26, 2988-2991.
[15] Li, Z.S. (1995) Calculation of Permeability Coefficient by Chemical Method. Coal Geology and Exploration, 23, 37-40.
[16] Li, K.L. (1993) Hydrogeochemical Thermodynamics. Atomic Energy Press, Beijing.
[17] Shen, Z.L. (1993) Fundamentals of Geochemistry. The Geological Publishing
House, Beiing.
[18] Mercado, A. and Billings, G.K. (1975) The Kinetics of Mineral Dissolution in Car-bonate Aquifers as a Tool for Hydrological Investion. I. Concentration-Time Rela-tionships. Journal of Hydrology, 24, 303-331.
Submit or recommend next manuscript to SCIRP and we will provide best service for you:
Accepting pre-submission inquiries through Email, Facebook, LinkedIn, Twitter, etc. A wide selection of journals (inclusive of 9 subjects, more than 200 journals)
Providing 24-hour high-quality service User-friendly online submission system Fair and swift peer-review system
Efficient typesetting and proofreading procedure
Display of the result of downloads and visits, as well as the number of cited articles Maximum dissemination of your research work