Pre-Feasibility Study of Sarawak-West
Kalimantan Cross-Border Value Chains
Lord, Montague and Chang, Susan
Asian Development Bank
November 2019
Online at
https://mpra.ub.uni-muenchen.de/97376/
SARAWAK–WEST KALIMANTAN
CROSS-BORDER VALUE CHAINS
Montague Lor d
and
Susan Chang
ADB does not guarantee the accuracy of the data included in this publication and accepts no responsibility for any consequence of their use.
By making any designation of or reference to a particular territory or geographic area, or by using the term “country” in this document, ADB does not intend to make judgments as to any legal or other status of any territory or area.
ADB encourages printing or copyright information exclusively for personal and noncommercial use with proper acknowledgment of ADB. Users are restricted from reselling, redistributing, or creating derivative words for commercial purposes without the express, written consent of ADB.
Notes:
iii
1
Tables, Figures, Maps, and Box v
Map of Sarawak and West Kalimantan x
Acknowledgments xi
Abbreviations xiii
Summary xv
I Introduction 1
1 Background 3
2 Objectives and Methodology 7
3 Coverage 12
II Socioeconomic Features 19
4 Sarawak’s Structural Transformation 21
5 West Kalimantan’s Economic Transformation 25
III Government Policies 39
6 Sarawak Public Policies 41
7 West Kalimantan Public Policies 44
8 Border Crossings and Inland Port 47
9 West Borneo Economic Corridor 54
IV Analysis of Trade 59
10 Sarawak Exports 61
11 West Kalimantan Exports 64
12 Competitive Advantages 67
V Trade Modeling and Forecasting 71
13 Modeling Trade 73
14 Forecasting Trade Benefits 81
VI Cross-Border Value Chains 93
15 Aluminum 95
16 Natural Rubber 102
17 Palm Oil 110
18 Wood Products 116
19 Fisheries 124
20 Shipbuilding 131
21 Organic Agriculture 139
22 Tourism 147
23 Medical Tourism 154
24 Higher Education and Technical and Vocational Education and Training 160
VII Cost–Benefit Analysis 169
25 Common Assumptions 171
26 Palm Oil 173
27 Natural Rubber 181
28 Wood Products 187
29 Medical Tourism 193
30 Higher Education and Technical and Vocational Education and Training 197
VIII Cost-Effectiveness Analysis for Technical Assistance 203
31 Approach and Summary Results 205
32 Aluminum: Reducing Transport Costs 208
33 Wood: High-Value Modular Furnitures 210
34 Fisheries: Reducing Trade Costs 213
35 Shipbuilding: Upgrading Technologies 216
36 Organic Foods: High Value-Added Agriculture 218
37 Tourism: Multi-Destination Travel 220
IX Program Design 223
38 Design 225
39 Implementation 232
40 Strategic Framework 238
X Overall Monetized Appraisal 241
41 Program Viability 243
XI Overall Nonmonetized Appraisal 251
42 Rating Project Characteristics 253
XII Execution Strategy 257
43 Program Implementation 259
Appendixes
1 Project Ranking Methodology 264
2 Econometric Modeling of Trade 266
v
1
Tables
S.1 Cross-Border Value Chains for Sarawak and West Kalimantan xx 5.1 West Kalimantan Share of Land under Cultivation and Noncultivation, 2016 31 5.2 West Kalimantan and Other Provinces by Region: Average Net Monthly
Income by Main Industry, 2016 36
5.3 West Kalimantan Profile 37
9.1 Stages of Corridor Development 56
13.1 Trend Growth and Average Annual Deviations of Bilateral Exports and Real GDP 76 13.2 Income and Real Cross-Rate Elasticities of Indonesia’s and Malaysia’s Exports
with Each Other 77
13.3 Sarawak–West Kalimantan Cross-Border Trade, 2012–2017 79 13.4 Correlation between Exports at Border, Provincial and National Levels 80 14.1 Number of Trade Flows in Industry-Specific Gravity Model Equations 84 14.2 Elasticities Derived from Gravity Model Regression Estimates for Malaysia’s
Import Demand for Products from Key Sarawak Industries 85 18.1 West Kalimantan Domestic Investment and Employment Generation
in Manufacturing Sector in 2016 117
21.1 Mapping Activities of Core Actors in Organic Vegetable Value Chain 144 26.1 Summary of Economic Internal Rate of Return and Sensitivity Analysis
for West Kalimantan’s Crude Palm Oil Industry 178 26.2 Summary of Economic Internal Rate of Return and Sensitivity Analysis
for West Kalimantan’s Palm Oil Industry 179
27.1 Summary of Economic Internal Rate of Return and Sensitivity Analysis
for Sarawak’s Natural Rubber Industry 184
27.2 Summary of Economic Internal Rate of Return and Sensitivity Analysis
for West Kalimantan’s Crude Natural Rubber Industry 186 28.1 Summary of Economic Internal Rate of Return and Sensitivity Analysis
for West Kalimantan’s Plywood Industry 192
29.1 Summary of Economic Internal Rate of Return and Sensitivity Analysis
for Sarawak’s Medical Tourism Industry 195
30.1 Summary of Economic Internal Rate of Return and Sensitivity Analysis
for Sarawak’s Higher Education and TVET 200
31.1 Summary of Cost-Effectiveness Analysis for Joint Sarawak–West Kalimantan
Projects 206 32.1 Cost-Effectiveness of 20% Shift in Sarawak Smelter Sourcing of Aluminum Oxide
from Distant Suppliers to West Kalimantan Suppliers 209 33.1 Cost-Effectiveness of Modular Furniture Sector Development in Sarawak
and West Kalimantan 212
34.1 Cost-Effectiveness of 20% Shift in Sarawak Smelter Sourcing of Aluminum Oxide from Distant Suppliers to West Kalimantan Suppliers 214 35.1 Cost-Effectiveness of Shipbuilding Expansion in Sarawak and West Kalimantan 217
36.1 Cost Effectiveness of Organic Fruits and Vegetables as High Value-Added
Activity for Smallholder Farms 219
37.1 Cost Effectiveness of Multi-Destination Tourism in Sarawak
and West Kalimantan 222
39.1 Synthesis of Parameters for the Sarawak–West Kalimantan Integrated
Border Area Development Program 232
41.1 Summary of Sarawak’s Economic Internal Rate of Return and Sensitivity Analysis 244 41.2 Sarawak’s Economic Internal Rate of Return and Sensitivity Analysis 245 41.3 Summary of West Kalimantan’s Economic Internal Rate of Return and Sensitivity
Analysis 247 41.4 West Kalimantan’s Economic Internal Rate of Return and Sensitivity Analysis 248 41.5 Comparison of Sarawak and Sabah Project Appraisal Results for Border Area
Development Programs 250
41.6 Comparison of West Kalimantan and North Kalimantan Project
Appraisal Results for Border Area Development Programs 250
42.1 Ratings of Characteristics in Projects 255
A2.1 Representative Traded Products of Leading Sarawak and West Kalimantan
Industries 266 A2.2 Unit Root Test Results for Indonesia and Malaysia Exports and Imports 268 A2.3 Results of the Error Correction Model for Indonesian and Malaysian Exports
to Each Other 269
A2.4 Results of the Error Correction Model for Indonesian and Malaysian Exports
to Each Other with Effect of Bilateral Real Exchange Rates 271 A2.5 Initial Estimation Results of Gravity Model for Malaysia’s Import Demand
for Products from Key Sarawak Industries 273
A2.6 Gravity Model Variable Descriptions and Sources 273
Figures
S.1 Border Area Development Program for Sarawak–West Kalimantan xvi S.2 Cost-Effectiveness Analysis of Joint Sarawak–West Kalimantan Projects xviii
S.3 Project Rankings by Interest Groups xix
2.1 Six Objectives of the Study 7
2.2 Quantitative Tools Used in Each Part of the Study 9
2.3 Steps to a Successful Cost–Benefit Analysis 10
3.1 Stages of the Pre-Feasibility Study 12
3.2 Project Development Framework 13
3.3 Project Cycle 14
3.4 Stages of a Border Economic Area Development Project 17 5.1 West Kalimantan Labor Distribution by Industry 30 5.2 West Kalimantan Oil Palm Plantation Area and Palm Oil Production, 2012–2016 31 5.3 West Kalimantan Capture and Culture Fisheries, 2012–2016 32
5.4 West Kalimantan Forest Area by Type, 2016 33
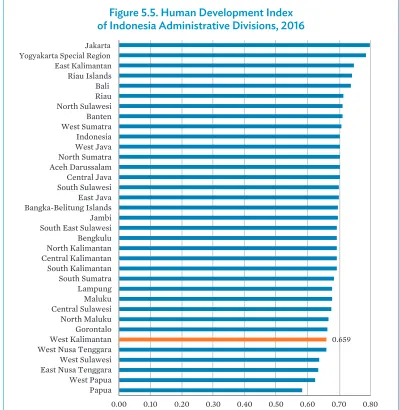
5.5 Human Development Index of Indonesia Administrative Divisions, 2016 34 8.1 Entikong (West Kalimantan)–Tebedu (Sarawak) Crossing 49 8.2 Nanga Badau (West Kalimantan)–Lubok Antu (Sarawak) Crossing 50 8.3 Aruk (West Kalimantan)–Lundu (Sarawak) Crossing 50 8.4 Tebedu Inland Port Container Throughput, Actual 2011–2017
and Projected 2018–2021 51
8.5 Aerial View of Tebedu Inland Port 51
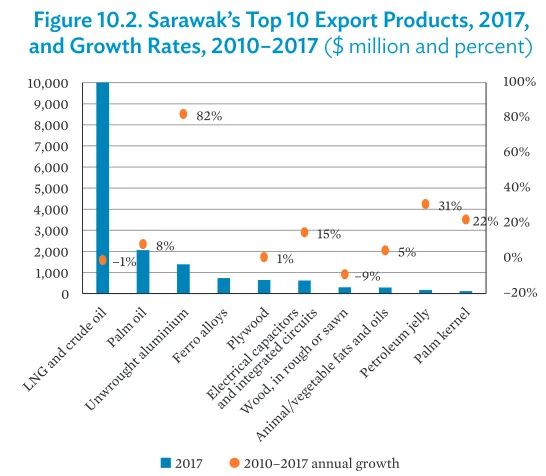
10.2 Sarawak’s Top 10 Export Products, 2017, and Growth Rates, 2010–2017 62 11.1 West Kalimantan’s Major Export Categories, 2012 and 2017 64 11.2 West Kalimantan’s Top 10 Export Products, 2017, and Growth Rates, 2012–2017 65 11.3 West Kalimantan Destination of Exports, 2017 66 11.4 West Kalimantan Share of Exports to Malaysia, 2007–2016 66 12.1 Sarawak Revealed Comparative Advantage of Top 20 Products, 2017 67 12.2 West Kalimantan Revealed Comparative Advantage of Top 20 Products, 2017 68 12.3 Nominal Cross-Rates of Indonesia and Malaysia 70 12.4 Real Cross-Rate of Indonesian Rupiah against Malaysian Ringgit 70 13.1 Decision Tree for Testing Trade Relationships 75 13.2 Indonesia and Malaysia Imports and Bilateral Market Shares 76 13.3 Sarawak’s and West Kalimantan’s Shares of Malaysian and Indonesian Bilateral
Exports to One Another, 2012–2017 77
13.4 Ratio of Exports to GDP of Indonesia Provinces 78 13.5 Ratio of Exports to GDP of Malaysia’s Provinces 79 14.1 Alumina Import Demand Projects Associated with Output Growth Projections
of Sarawak and Its Trading Partners 87
14.2 Natural Rubber Import Demand Associated with Output Growth Projections
of Sarawak 88
14.3 Palm Oil Import Demand Associated with Output Growth Projections
of Sarawak 88
14.4 Wood Product Import Demand Associated with Output Growth Projections
of Sarawak and Its Trading Partners 89
14.5 Fish and Crustacean Import Demand Associated with Output Growth Projections
of Sarawak and Its Trading Partners 89
14.6 Vessel Import Demand Projects Associated with Output Growth Projections
of Sarawak 90
15.1 Bayer Process Used by PT Indonesia Chemical Alumina 97 15.2 Major Applications of Alumina and Alumina Hydrate 98 15.3 West Kalimantan Alumina Exports by Type, 2007–2016 99 15.4 Cross-Border Value Chain of Aluminum Industry 100
15.5 Steps in Alumina Factory Processing 101
16.1 West Kalimantan—Percentage Contribution of Rubber and Rubber Manufactures to Total Manufacturing and Gross Regional Domestic Product 104 16.2 West Kalimantan—Percentage Distribution of Natural Rubber Exports, 2017 104 16.3 Sarawak—Percentage Contribution of Major Types of Natural
Rubber-Based Export 104
16.4 Sarawak—Percentage Distribution of Rubber-Based Manufactured Exports, 2017 104 16.5 Cross-Border Value Chain of Natural Rubber Industry 106 16.6 Steps in Natural Rubber Factory Processing 107 17.1 West Kalimantan Oil Palm Area Planted and Production by Smallholders,
2012–2016 111 17.2 West Kalimantan Distribution of Oil Palm Area Planted and Production
by Regency, 2016 111
17.3 Cross-Border Value Chain in Palm Oil Industry 113
17.4 Steps in Oil Palm Processing 114
18.5 Steps in Modular (Knockdown) Furniture Manufacturing 121 19.1 West Kalimantan Percentage Contribution of Fisheries and Other Sectors
to Gross Provincial Domestic Product, 2016 125
19.2 West Kalimantan Value of Fish Production, 2012–2017 126 19.3 West Kalimantan Mayor Fisheries Product Exports, 2017 126 19.4 West Kalimantan Mayor Types of Fish and Crustacean Product Exports,
2012–2017 127
19.5 West Kalimantan Inland and Offshore Fishing Fleets 127 19.6 West Kalimantan Geographic Destination of Fish and Crustacean Product
Exports, 2017 128
19.7 Cross-Border Value Chains in Fisheries Industry 129 19.8 Ornamental Fish Production in PT Arwana Lestari 130
20.1 Ferry Transport in West Kalimantan 131
20.2 Pontianak Sea Port 134
20.3 Pontianak Shipping Arrivals, 2012–2016 134
20.4 West Kalimantan Ships Exports, 2013–2017 Average 134 20.5 West Kalimantan Destination of Ships Exports, 2012–2016 Average 135
20.6 Value Chains in Shipbuilding Industry 136
20.7 Steps in a Shipbuilding Process 137
21.1 Organic Vegetables and Manufactures: Premium Price Margins
over Conventional Vegetables 140
21.2 Types of Vegetables Produced in West Kalimantan 143
21.3 Value Chain of Organic Agriculture 144
21.4 Steps in Organic Agriculture Production and Certification 146 22.1 West Kalimantan Tourism Arrivals by Entry Point, 2011–2016 149 22.2 West Kalimantan Tourism Arrivals by Origin, 2016 149
22.3 Value Chain of Multi-Destination Tourism 153
23.1 Global Medical Tourism Growth Relative to Global GDP Growth, 2017–2025 155
23.2 East Asia Medical Tourism Arrivals 156
23.3 Medical Tourism Cost Savings Relative to the United States Benchmark,
by Country 156
23.4 Medical Tourism Arrivals in Malaysia, 2011–2017 157
23.5 Medical Tourism Value Chain 159
24.1 University of Sarawak Malaysia 164
24.2 Swinburne University of Technology Sarawak Campus 164
24.3 Sarawak Skills Development Centre 165
24.4 Value Delivery Network of International Higher Education and Technical
and Vocational Education and Training 167
26.1 Time Path of Palm Oil Cross-Border Trade between Sarawak
and West Kalimantan, 2018–2022 173
26.2 Change in Sarawak’s Quantity Demanded of Crude Palm Oil and Supplies
from Domestic and West Kalimantan Suppliers 177
26.3 West Kalimantan Economic Internal Rate of Return for Crude Palm Oil Industry
under Alternative Scenarios 179
26.4 West Kalimantan Economic Internal Rate of Return for Plywood Industry
under Alternative Scenarios 180
27.1 Projected Rubber Imports of Sarawak, 2018–2050 182 27.2 Projected Rubber Exports of West Kalimantan, 2018–2050 183 27.3 Sarawak Economic Internal Rate of Return for Natural Rubber Industry
27.4 West Kalimantan Economic Internal Rate of Return for Natural Rubber Industry
under Alternative Scenarios 185
28.1 Projected West Kalimantan Timber and Semi-Processed Wood Product Exports
to Sarawak, 2018–2050 190
28.2 Projected West Kalimantan Timber and Semi-Processed Wood Product Exports
to Sarawak, 2018–2050 192
29.1 Sarawak Economic Internal Rate of Return for Medical Tourism Industry
under Alternative Scenarios 196
29.2 Sarawak Medical Tourism Payback Schedule and Breakeven Point 196 30.1 Gap Analysis of Sarawak’s Technical and Vocational Education and Training
Institutions 198
30.2 Economic Internal Rate of Return for Higher Education and Technical
and Vocational Education and Training under Alternative Scenarios 200 31.1 Cost-Effectiveness Analysis of Joint Sarawak–West Kalimantan Projects 207 38.1 Geographic Coverage of West Kalimantan Integrated Border Economic Area 226 38.2 Geographic Coverage of West Kalimantan Integrated Border Economic Area 227 38.3 Soft and Hard Infrastructure for Sarawak and West Kalimantan Integrated
Border Economic Area 229
38.5 Representation of Sarawak and West Kalimantan Border Economic Area 231 39.1 Key Cluster Relationships in Value Chains 234
39.2 Timeline of Cluster Formation Process 236
40.1 Blueprint for Sarawak–West Kalimantan Integrated Border Area
Development Program 238
40.2 Master Plan for Sarawak–West Kalimantan Integrated Border Economic Area 240 42.1 Combined Ratings of Major Project Characteristics 256 43.1 Sarawak–West Kalimantan Investment Program 260 43.2 Sarawak–West Kalimantan Sequence of Border Economic Area Development 261 43.3 Sarawak–West Kalimantan Stages of Cross-Border Collaboration under
Integrated Border Area Development Program 263
Maps
1.1 West Borneo Economic Corridor 4
4.1 Sarawak Administrative Divisions 22
5.1 West Kalimantan Administrative Divisions 26
5.2 West Kalimantan Population Density 26
5.3 West Kalimantan Agriculture, Mining, and Protected Areas 30
5.4 West Kalimantan Tourist Map 33
8.1 Sarawak–West Kalimantan Border Checkpoints 48
8.2 Pan Borneo Highway 49
9.1 West Borneo Economic Corridor 55
11.1 West Kalimantan Value of Exports by Port of Exportation, 2017 66 17.1 West Kalimantan Distribution of Oil Palm Area Planted and Production, 2016 112
22.1 Southern Sarawak Tourism Map 150
22.2 West Kalimantan Tourism Map 151
38.1 Geographic Coverage of Sarawak Integrated Border Economic Area 225
Box
x
1
Source: Adopted from Wikipedia map.
xi
1
This study was prepared by consultants Montague Lord and Susan Chang, under the direction of Alfredo Perdiguero, Director, Regional Cooperation and Operations Coordination Division, Southeast Asia Department; and Gary Krishnan, Country Specialist in the Regional Cooperation and Operations Coordination Division of the Asian Development Bank (ADB).
The study responds to request by the governments of Indonesia and Malaysia to ADB that a pre-feasibility study be carried out on the potential for developing a border economic area in Sarawak–West Kalimantan that expands cross-border value chains in specific industries as well as trade in their products. Grateful acknowledgment is made to the many individuals and institutions that contributed to the information contained in this report.
For Sarawak, the fieldwork in 1–14 April 2018 benefited from information provided by the companies and institutions visited. We appreciate the guidance and information provided by the Sarawak Planning Unit (Mr. Julin Alen, Principal Assistant Director, and Ms. Genevieve Sadai), Ministry of Agriculture (Datu Ik Pahon, Permanent Secretary, Mr. Joseph Wei), Department of Agriculture (Mr. Stonton), Agriculture Research Centre, Department of Statistics Sarawak (Ms. Brenda Jee Hui Siang, Mr. Lim Chai Hong), Department of Statistics Malaysia (Mr. Liang Hung Sham), SM Inland Port Sdn Bhd (Mr. Nobel Pang), Sarawak Tourism Federation (Ms. Fiona Marcus Raja) and the BIMP-EAGA Malaysia Business Council (Hj Osaha). We also acknowledge with gratitude the coordination of visits to the borders of Sarawak and information provided by Customs and Immigration Department (Lubok Antu and Tebedu) and the District Office (Lubok Antu).
We are also thankful to the managers of the following companies located in Sarawak for allowing the Study Team to visit their facilities: Sarawak Timber Industry Development Cooperation, Borneo Medical Centre, Timberland Medical Centre, Sarawak Skills Development Centre, Swinburne University of Technology Sarawak Campus, Tebedu Inland Port, Jaya Coastal Group – Sibu, Malaysian Pepper Board, Assar Refinery Services Sdn Bhd and Borneo Highlands Resort.
For West Kalimantan, the fieldwork on 22 November through 4 December 2017 benefited from information provided by the companies and institutions visited. We appreciate the guidance and information provided by Mr. Cahyo Purnomo, Deputy Director of Indonesia Investment Coordinating Board (BKPM), Ms. Desi Ariani and Ms. Sandra Devi Rachmarani, Directorate of ASEAN Negotiation, Directorate General of International Trade Negotiation, Ministry of Trade of Indonesia; Mr. Pitono, Kepala BPS Provinsi; and Mr. Arianto, Kepala Bidang Statistik Distribusi of the Badan Pusat Statistik of West Kalimantan Province. We also acknowledge with gratitude the coordination of visits to border crossings into Sarawak and the information
provided by the officials from the Statistics Department and Customs Department from the regencies of Kapuas Hulu, Sambas and Sanggau.
We are also grateful to the owners and managers of the following companies located in West Kalimantan for allowing the Study Team to visit their facilities: PT Buana Tunas Sejahtera in Badau; PT Arwana Lestari in Putussibau; PT Indonesia Chemical Alumina in Tayan; ANTAM in Tayan; PT New Kalbar Processors in Pontianak; Steadfast Marine in Pontianak; PT Pulau Mas Khatulistiwa in Pontianak; and PT Cakrawala Persada Biomas in Pontianak.
xiii
1
ADB Asian Development Bank AEC ASEAN Economic Community AMS ASEAN member states
ARIMA autoregressive integrated moving average ASEAN Association of Southeast Asian Nations BCA border cross agreement
BCR benefit–cost ratio
BDS business development service BEA border economic area
BIMP-EAGA Brunei Darussalam–Indonesia–Malaysia–Philippines East ASEAN Growth Area
BKPM Indonesia Investment Coordinating Board BPS Badan Pusat Statistik
BTA border trade agreement
CEPII Centre d’Études Prospectives et d’Informations Internationales CGF credit guarantee facility
CIQ Customs, Immigration, and Quarantine
CITES Convention on International Endangered Species of Wild Fauna and Flora CPO crude palm oil
CSF cost-sharing facility DCF discounted cash flow
EBCR economic benefits–cost ratio EIRR economic internal rate of return ENPV economic net present value EPU Economic Planning Unit FFB fresh fruit bunch
FIRR financial internal rate of return FSC Forest Stewardship Council GDP gross domestic product GMS Greater Mekong Subregion GPDP gross provincial domestic product HPK convertible production forest HS Harmonized System
ICQS immigration, customs, quarantine, and security ICT information and communication technology IMF International Monetary Fund
IMT-GT Indonesia–Malaysia–Thailand Growth Triangle IRR internal rate of return
JCI Joint Commission International KADIN Kamar Dagang dan Industri
LNG liquified natural gas
LOCODE Code for Trade and Transport Location M&E monitoring and evaluation
MOA memorandum of agreement MOU memorandum of understanding MPOB Malaysian Palm Oil Board
MSEs micro and small-sized enterprises
MT metric ton
NEM new economic model
NGO nongovernment organization NTM nontariff measure
OER oil extraction rate OP/DP old/damaged plants
PEFC Programme for the Endorsement of Forest Certification
PK palm kernel
PKI Indonesian Communist Party PKO palm kernel oil
PLBN The Entikong State Border Crossing Post PPKS Pusat Pembangunan Kemahiran Sarawak PSC Public Service Commission
PT Perseroan Terbatas R&D research and development RCA revealed comparative advantage
RPJMD West Kalimantan’s Medium-Term Development Plan RSPO Roundtable on Sustainable Palm Oil
SBSR Ship Repair Industry Strategic Plan SCF standard conversion factor
SCORE Sarawak Corridor of Renewable Energy SERF shadow exchange rate factor
SEZ special economic zone
SMEs small and medium-sized enterprises
SWOT strengths, weaknesses, opportunities, and threats TA technical assistance
TEUs twenty-foot equivalent units
TVET technical and vocational education and training UN United Nations
UNIMAS University of Malaysia Sarawak WBEC West Borneo Economic Corridor
WK West Kalimantan
xv
Summary
Background
The people of Sarawak and West Kalimantan share a 966-kilometer land border, with three official border crossings. In mid-2014, trade between the two territories was halted when Indonesian authorities tightened their enforcement of cargo being transported across the border, and international commercial activity at the border ceased.
At the end of 2017, a breakthrough occurred when the governments of Indonesia and Malaysia made strong commitments to resume cross-border trade. It thereby set the stage for transforming the West Borneo Economic Corridor (WBEC) of the Brunei Darussalam– Indonesia–Malaysia–Philippines East ASEAN Growth Area (BIMP-EAGA) from a transport corridor to a full-fledged economic corridor.
Both governments are now promoting cross-border trade and investment by introducing hard and soft infrastructure that includes road upgrades and new or revitalized customs, immigration, and quarantine (CIQ); as well as policies and regulatory measures that promote cross-border collaboration.
To that end, both governments have asked the Asian Development Bank (ADB) to identify ways to drive private sector investment in specific cross-border value chains.
Motivation
(i) For Indonesia, the project emerges from the government’s new country-wide program, announced in December 2016, to develop specific border areas as part of an effort to improve living standards, promote commerce, and attract workers and their families to reduce agglomeration in Java. West Kalimantan, as a gateway to Malaysia, is one of the high-profile focal border areas of the government’s program.
(ii) For Malaysia, the motivation is twofold: to raise household income in the administrative divisions near West Kalimantan, and to bring cross-border trade with West Kalimantan back to normal levels after years of a virtual halt in official trade between the two territories.
Study Objective
As such, the present study identifies concrete and high-impact projects that will advance implementation of an integrated border area development program for West Kalimantan. It maps the optimal configuration of Sarawak–West Kalimantan cross-border trade and investment in goods and services; and, concurrently, provides the design of a border area development plan for the two territories.
The options for moving project proposals forward are elaborated in sufficient detail and contain the needed concrete measures that will permit the specified program to move through subsequent stages of development and into implementation phases.
Why Cross-Border Value Chains
Clustering of industries across the two territories allows producers to bypass the need to handle the entire production process, and instead concentrate on processing stages. These complementarities permit exploitation of differences in production factors, generate scale economies and “cross-hauling”, thereby enhancing international competitiveness.
Pre-Feasibility Study
As a pre-feasibility study, we examine a wide range of industry options and determine which projects are economically viable within the socioeconomic, institutional, and political context of Sarawak and West Kalimantan. We follow the same analytical approach as that for the pilot project study of North Kalimantan and Sabah, which serves as a high-profile demonstration pre-feasibility study for this and other border area development programs.1
Project Appraisals
The optimal configuration for the portfolio of Sarawak–West Kalimantan trade and investment activities is that which generates the maximum net benefits from the feasible projects for groups of stakeholders.
(i) Monetary benefits. We use cost–benefit analysis to measure the economic viability of cross-border trade and investment between Sarawak and West Kalimantan. This involves examining (i) current and future demand, (ii) existing sources of supply and their costs, (iii) the contribution of the proposed project to overall market demand, (iv) the benefits to be derived from the project, and (v) the sustainability of the project during its lifetime.
1 Asian Development Bank (ADB). 2018. Pre-Feasibility Study of Sabah-North Kalimantan Cross-Border Value
Chains. Manila.
Figure S.1. Border Area Development Program for Sarawak-West Kalimantan
(ii) Forecasting benefits. Cost–benefit analysis requires demand estimates and measurement of capital and operating costs. Demand analysis provides the justification for the project; guides the identification of the size, location, and design of the investment project; and provides the basis for the financial and economic assessment.
Forecasting cross-border trade follows a “decision tree”: at the first level, the importer decides how much of a good or service is needed; then, at the second level, the importer decides from what foreign supply source the good or service will be purchased.
We use an error correction model for the first decision level about overall product-specific imports, and a gravity trade model for the second decision about sourcing those imports, which in turn depends on (i) country size, (ii) transportation costs, (iii) economic distance, (iv) geographic distance between trading partners, (v) a proxy for whether trading partners share a physical border, and (vi) a proxy for whether trading partners partially share a common language.
(iii) Nonmonetary benefits. In addition to the application of traditional cost–benefit analysis that measures the monetized returns to projects, we include nonmonetized project appraisal. This allows various interest groups to rank projects by preference objectives, like environmental sustainability, household welfare gains at the border, health and training delivery to those border households, inequality reductions, and the like.
Key Topics Covered
The pre-feasibility study pursues six key objectives:
(i) It analyzes existing trade patterns and competitive advantages of Sarawak and West Kalimantan, as well as government objectives in promoting cross-border commercial activities.
(ii) It proposes a border economic area spread over a wide geographic area that covers a network of interrelated activities and provides a fully integrated approach to the border economic area design and implementation.
(iii) It identifies potential cross-border value chains that can serve as high-profile projects for the border economic area.
(iv) It determines the preference ordering of project features by key stakeholders such as government and development partners, commercial entities, and the local population. (v) It estimates the net monetary returns for the project portfolio; makes a cost-effectiveness analysis of the stand-alone capacity-building projects; ranks stakeholders’ nonmonetary preferences; and incorporates the preference ranking order into the project portfolio’s net monetary returns.
Focal Industries
Fieldwork visits to companies and subsequent economic analysis of those industries have led us to identify 10 potential industries that would help drive border area development:
Aluminum Shipbuilding
Rubber Organic Foods Palm Oil Tourism
Wood Products Higher Education and Technical and Vocational Education and Training
Fisheries Medical Tourism
Capital Investment Appraisals
(i) For Sarawak, the economic internal rate of return (EIRR) ranges from 16% to 22% for natural rubber, palm oil, medical tourism, technical and vocational education and training (TVET) and higher education. The economic net present value (ENPV) is highest for medical tourism (nearly $183 million) and palm oil ($83 million). The economic benefit–cost ratios (EBCRs) range from 1.3 to 2.1.
(ii) For West Kalimantan’s projects, the EIRR ranges from 18% to 21% for wood products, palm oil, and natural rubber. The ENPV is highest for palm oil ($250 million). The EBCRs range from 1.8 to 2.2.
Cost-Efficiency Ratios
Cost-effectiveness analysis for stand-alone capacity development projects yield the following results (see figure above):
(i) Multi-destination tourism has the highest returns among all projects because of the richness of the two territories’ natural resources and cultural heritage.
(ii) Shipbuilding has robust returns likely to emerge from a project promoting cross-border collaboration.
(iii) Organic foods and modular wood furniture
are two potentially huge businesses for Sarawak and West Kalimantan.
(iv) Fisheries and aluminum have modest returns because of considerable distrust and lack of information in Sarawak about West Kalimantan potential as a cost-effective source of raw materials supplies.
Figure S.2. Cost-Effectiveness Analysis of Joint Sarawak-West Kalimantan Projects
Source: Representation and calculations by the authors.
Highest returns
Robust returns
Moderate returns Modest returns Tourism: 23.2
West Kalimantan
Tourism: 19.7 Sarawak
9.3 Shipbuilding
Nonmonetary Appraisal
We examine three groups of stakeholders that have different preferences for key characteristics or aspects of the products:
(i) local households and small businesses that are concerned with improvements in livelihoods and access to scale economies;
(ii) large companies whose main interest is to generate the largest commercial returns; and
(iii) government and development institutions whose objective is to maximize profits and socioeconomic welfare effects.
The results of the analysis and ratings for these nonefficiency objectives are incorporated into the results of the monetized cost–benefit analysis through scaling factors.
Program Appraisal (Table S.1)
Since the Sarawak–West Kalimantan border economic area program is composed of several projects, we can jointly analyze the entire program as a single investment and evaluate its economic viability accordingly.
(i) For Sarawak, the analysis of the overall program generates an EIRR of 19.6%, with the ENPV equal to $397 million and EBCR of 1.3. Sensitivity analysis suggests that the program remains economically viable in the face of cost overruns, benefits reductions, and a combination of both effects.
(ii) For West Kalimantan, the overall program has an EIRR of 19.5%, an ENPV of $444 million, and an EBCR of 2.2. Sensitivity analysis also indicates that the program remains viable under various unfavorable conditions.
Recommendations for Implementation
(i) Monetary project rankings: Rank projects on EIRR and ENPV.
(ii) Capital investment projects: Promote cross-border value chains (CBVCs) via awareness campaigns; fiscal incentives; inland ports; CIQs; roads and maintenance (apply to medical tourism, TVET, modular furniture, natural rubber, palm oil).
(iii) Self-contained capacity-building projects: Set up champions to organize and promote clusters (apply to tourism, shipbuilding, organic fruits and veggies, modular furniture, aluminum, and fisheries).
(iv) Nonmonetary project rankings: Rank projects based on nonmonetary preferences of interest groups, namely, border households, small and
medium-sized enterprises (SMEs), large companies, government, and development partners.
Figure S.3. Project Rankings by Interest Groups
SMEs = small and medium-sized enterprises, TVET = technical and vocational education and training. Source: Representation and calculations by the authors.
0% 20% 40% 60% 80% 100%
Medical Tourism Eco-Tourism Higher Education and TVET Organic Foods
Shipbuilding Fisheries Palm Oil Wood Products Rubber Aluminum
Table S.1 Cross-Border Value Chains for Sarawak and West Kalimantan
Capital Investment Projects
EIRR
(%) ($ million)ENPV EBCR (ratio) 1. Wood
Furniture
Promotes diversification in wood products from large-scale plywood, veneer panels, and blockboard to high-value furniture design and manufacturing through collaborative arrangements between West Kalimantan and Sarawak.
SW n.a. n.a. n.a.
WK 21.2 106 2.8
2. Palm Oil Addresses negative environmental consequences of the palm oil industry through cross-border collaboration in downstream activities for more efficient biofuel facilities in Sarawak and technology transfer.
SW 19.2 62 1.4
WK 18.6 250 2.2
3. Natural Rubber
Creates economies of scale through joint production activities of rubber suppliers and end-use manufacturers to expand competitiveness.
SW 15.6 71 1.3
WK 17.8 56 1.5
4. Medical Tourism
Increases access to Sarawak medical facilities, which
are widely used by West Kalimantan people by developing full value chain for medical tourism in Sarawak to substantially improve access to high-end medical treatment.
SW 22.0 183 1.4
WK n.a. n.a. n.a.
5. Higher Education and TVET
Strengthens access to higher education and TVET for West Kalimantan through a collaborative program with Sarawak that substantially upgrades West Kalimantan’s skilled workforce and facilitates technology transfers.
SW 19.8 83 2.1
WK n.a. n.a. n.a.
6. Overall Program
Joint evaluation of project mix incorporates economies of scale due to shared nonfactor input such as road linkages and CIQ facilities.
SW 19.6 387 1.3
WK 19.5 444 2.2
Stand-Alone Capacity Building: Cost-Effectiveness Analysis Cost-Effect Ratio
7. Tourism The project supports Sarawak’s and West Kalimantan’s overarching strategic goals of becoming world-renowned eco-tourism destinations by jointly
promoting land and sea tourism sites. 23.2
8. Shipbuilding Aims to expand shipbuilding operations between Sarawak and West Kalimantan to provide the needed technology and know-how across companies, along with
joint production and marketing. 9.3
9. Furniture Jointly develops training and structural adjustment investment programs to develop the modular furniture industry in both West Kalimantan and Sarawak to
add value to wood products. 8.8
10. Organic Foods
Promotes organic vegetables and prawns produced in both West Kalimantan and Sarawak to help households involved in small-scale agricultural activities move
into high-value markets. 8.5
11. Alumina Supports West Kalimantan’s shipment of bauxite and alumina to Sarawak since, as a bulk commodity, export competitiveness is closely related to
distance-to-market and transport cost. 6.7
12. Fisheries Promotes cross-border clustering of activities in fisheries products that produce more value-added downstream products, especially seaweeds, canned crab meat,
surimi, and fish meal. 5.8
13. Overall Program
Joint evaluation of project mix incorporates economies of scale due to shared
factor inputs. 10.4
CIQ = customs, immigration, and quarantine; EBCR = economic benefit–cost ratio; EIRR = economic internal rate of return; ENPV = economic net present value; n.a. = not applicable; SW = Sarawak; TVET = technical and vocational education and training; WK = West Kalimantan.
3
1
Background
The governments of the Indonesian province of West Kalimantan and the Malaysian state of Sarawak are exploring trade and investment opportunities between their territories. To that end, they have asked that the Asian Development Bank (ADB) prepare a pre-feasibility study on opportunities in cross-border trade in potential transnational value chains in competitive and complementary industries. While both governments aim to achieve similar end-results for border area development, their motivation differs.
1.1 Indonesia’s Interests
For Indonesia, the plan is part of a broader country-wide effort to develop particular border areas of the country with the intention of improving living standards, promoting commerce, attracting workers and their families to those border areas, and reducing agglomeration in Java’s major urban centers.
Indonesia has four provinces having land borders with foreign countries, one of which is West Kalimantan. The others are North Kalimantan (bordering Sabah state of Malaysia), East Nusa Tenggara (gateway to Timor-Leste), and Papua (gateway to Papua New Guinea). ADB has already completed the pre-investment study for the North Kalimantan–Sabah border area development program, and that methodology is being used as the model for the present study.
The results of this study therefore support the Government of Indonesia’s Integrated Border Area Development Program goals of (i) accelerating economic growth through increased productivity associated with economies of scale and production complementarities with its neighboring countries; (ii) generating greater employment and more value-added activities to improve living standards, reduce poverty and lower inequality; and (iii) reversing the negative investment effects from agglomeration of activities in the major urban centers of Jakarta, Surabaya, and Bandung, where population density is over 15,000 persons per square kilometer (km2), compared with only 10 persons/km2 in Papua and 32 persons/km2 in
West Kalimantan.1
1.2 Malaysia’s Interests
For the Malaysian government, the motivation is twofold:
(i) First, some of Sarawak’s administrative divisions near West Kalimantan have the lowest household incomes in the state, and Kepit in the southeastern part of the state, while being the largest division, has only 3 persons/km2.
(ii) Second, Sarawak’s trade with Indonesia accounts for less than 2% of all trade during the present decade and, even then, trade with that country fell by a third between 2012 and 2015. By 2017, trade with that country had yet to recover its already low level of 2012. This dramatic situation was reflected in a virtual halt to official trade flows in the Sarawak–West Kalimantan border between mid-2014 and 2017.
A turnaround occurred at the 12th Annual Consultation between Malaysia and Indonesia on 22 November 2017, when Prime Minister Datuk Seri Najib Razak and Indonesian President Joko Widodo called for the finalization of the 1970 Border Trade Agreement (BTA) and Border Cross Agreement between the two countries to help bolster border development and trade between the two countries. The box on the opposite page shows a comparative profile of Sarawak and West Kalimantan. Both governments now plan to promote cross-border trade and investment by introducing hard and soft infrastructure that include roads and customs and immigration facilities along the border, as well as trade and transport policies and regulatory measures that promote cross-border collaboration.
At the center of these efforts is a border economic area spread over a wide geographic area. Instead of narrowly defined special economic zones (SEZs), the proposed border economic area will cover the operation of a network of activities that encompasses clusters associated in varying degrees of collaboration with transnational productive activities to achieve well-defined goals selected from a broad spectrum of development objectives.
1.3 Subregional Context
Equally important to the subregion is the West Borneo Economic Corridor (WBEC) of the Brunei Darussalam–Indonesia–Malaysia–Philippines East ASEAN Growth Area (BIMP-EAGA). In this subregional context, the economic corridor seeks to expand trade ties between neighboring countries to support private sector and government interests in diversifying the corridor economies to create complementary production activities that generate economies of scale and allow industries to move into high-value markets (Map 1.1).
The WBEC links West Kalimantan, Sarawak, Brunei Darussalam, and Sabah to promote physical and cross-border mobility to enhance the subregion’s competitiveness by linking local production with cross-border supply and value chains, as well as strengthen opportunities for small and medium-sized enterprises (SMEs) to participate in those production and distribution systems.
The southern portion of WBEC includes critical commercial, border, and gateway notes. The commercial nodes in the area covered by this study consist of Pontianak in West Kalimantan and Kuching in Sarawak; border nodes include all three border crossings between Sarawak and West Kalimantan; and the southern gateway
Map 1.1. West Borneo Economic Corridor
Box. Comparative Profile of Sarawak and West Kalimantan
Item Sarawak West Kalimantan
A. Geography
Land Surface (km2) 124,451 146,807
Capital City Kuching Pontianak
Administrative Divisions Betong, Bintulu, Kapit, Kuching, Limbang, Miri, Mukah,
Samarahan, Sarikei, Serian, Sibu, and Sri Aman
Regencies of Bengkayang, Kapuas Hulu, Ketapang, Kubu Raya, Landak, Melawi, North Kayong, Pontianak, Sambas, Sanggau, Sekadau, and Sintang; and cities of Pontianak and Singkawang. B. Population
Population 2,770,000 (2017) 4,546,439 (2014)
– % Urban 58% 33.1
– % Rural 42% 66.9
% Annual Population Growth (2010–2015)
1.4 16.6
Population Density (persons/km2)
22.3 31
% Poverty 0.611 (2016) 8 (2012)
Human Development
Index 70.9 (2017) 65.9 (2016)
C. Demographics
Ethnic Groups Iban (30.3%), Malay (24.4%), Chinese (24.2%), Bidayuh (8.4%), Orang Ulu (6.7%), Melanau (5.4%), Indian (0.3%) and Other (0.3%)
Dayak (35%), Malay (34%), Javanese (10%), Chinese (8%), Madurese (6%), Bugis (3%), Sunda (1%), Batak (1%), Power (1%), and others (2%).
Major Languages Spoken Malay (Official), Iban, Bidayuh, Penan, English, Chinese
(Mandarin, Cantonese, Hokkien, Hakka, Fuzhou, and Teochew)
Indonesian (official); Malay (Pontianak Malay, Sambas Malay); Dayak (Iban, Kendayan, Jangkang, Bukar Sadong); Chinese (Hakka, Teochew) Religions Christian (42.60%), Islam
(32.20%), Buddhism (13.50%), Chinese folk religion (6%), No religion (2.60%), Unknown (1.90%), Others (1.%), Hinduism (0.2%)
Islam (59%), Christian (34%), Buddhism (5%), Confucianism (1%)
continued on next page
Item Sarawak West Kalimantan D. Education
Number of Universities 33 47
– Private 20 4
– State 13 43
Number of University Students
NA 81,579
– Private NA 32,699
– State NA 48,880
Vocational High Schools
– Number of Schools 6 (2015) 24
– Number of Teachers 524 735
– Number of Students 4,658 7,669
% Literacy Rate 68.15 95.0
– Men 69.25 97.2
– Women 67.11 92.9
% Population that Uses Internet
34.2 10.0
– Urban 42.1 23.2
– Rural 29.9 4.2
E. Economy
Gross Provincial Domestic Product
121,414 (RM million 2016) 1,489 ($ million 2013)
Per Capita GDP 44,141 (RM 2015) 2,357
% Real GDP Growth 4.0 (2013–2017) 4.9 (2000–2013) – Exports
(fob value, $ million)
77,354 (RM) 495.8
– Imports
(cif value, $ million)
39,737 (RM) 267.0
– Trade Balance ($ million)
37,617 228.8
Average of Net Wage or Salary, $/month (2016)
1,626.8 153.4
GDP = gross domestic product, km2 = square kilometer, n.a. = not applicable, RM = Malaysian ringgit.
Sources: For Sarawak: Department of Statistics Malaysia, Official Portal. https://www.dosm.gov.my/v1/index. php?r=column/coneandmenu_id=S1lsUkExNnV5bFBDZEYyUGlhZittUT09. For West Kalimantan: Badan Pusat Statistik (BPS-Statistics Indonesia).
7
2
2.1 Objective
The aim of this pre-feasibility study is to explore possible areas of cross-border trade collaboration in goods and services between Sarawak and West Kalimantan, and quantitatively determine the net economic benefits of potential investments in cross-border value chains.
To do this, the study will determine the optimal configuration of Sarawak–West Kalimantan cross-border trade and investment in goods and services; and, concurrently, prepare a preliminary (pre-feasibility) design for a border area development plan. In the context of the pre-feasibility study, the optimal configuration for the portfolio of Sarawak–West Kalimantan trade and investment activities is defined as that which generates the maximum net benefits from the set of feasible projects.
To that end, the study examines existing and potential trade between Sarawak and West Kalimantan, as well as government objectives in promoting cross-border commercial activities (see Figure 2.1). Potential cross-border value chains are identified that can serve as high-profile, demonstrable projects for the border economic area. The study estimates the net monetary returns for the project portfolio, ranks stakeholders’ nonmonetary preferences, and incorporates the preference ranking order into the project portfolio’s net monetary returns. Finally, the study provides an overall program appraisal for the set of projects, including an
Objectives and Methodology
Figure 2.1. Six Objectives of the Study
Source: Representation by the authors.
Analyze existing trade patterns and competitive advantages of Sarawak and West Kalimantan, as well as government objectives in promoting cross-border commercial activities.
Propose a border economic area spread over a wide geographic area that covers networks of interrelated activities and provides fully integrated approach to border economic area.
Identify potential cross-border value chains that can serve as high-profile, demonstrable projects for the border economic area.
Determine the preference orderings of project features by key stakeholders such as government and development partners, commercial entities, and the local population.
Estimate net monetary returns for portfolio, rank stakeholder nonmonetary preferences, and incorporate preference ranking order in project portfolio’s net monetary returns.
impact analysis of connectivity options. The study ends with suggested options for moving project proposals forward to implementation and project completion.
The sub-aim of the study is the application to the region of cross-border production networks, based largely on the spread of integrated global production networks. Production sharing has been largely driven by efforts to exploit either differences in factor endowments or possible scale economies of production activities across areas. In the Sarawak–West Kalimantan context, the spatial concentration of industries along the border region combines the traditional growth area model of trade and investment, based on comparative advantage and complementarities, with one based on scale economies from regionalization of production activities. Clustering of industries across the neighboring countries then allows producers to bypass the need to handle the entire production process, and instead concentrate on processing stages. These complementarities permit the exploitation of differences in the factors of production in subregions and generate economies of scale and “cross-hauling” or two-way trade between the neighboring countries, thereby increasing the competitiveness of border industries in regional and global markets.
The application of clustering and cross-hauling to trade between Sarawak and West Kalimantan follows ADB’s two recently published practical guides for establishing cross-border value chains in BIMP-EAGA.2 It also follows closely the pilot study for the North
Kalimantan–Sabah integrated border economic area that was developed as a model for this and other ADB-sponsored border area development programs that are driven by cross-border value chains. These three guides demonstrate how to apply the methodology to identify potential value chains across industries and establish fully integrated networks of activities needed to promote cross-border trade and investment. The present study offers yet another case study of best practices for developing a border economic area and successfully establishing value chains.
2.2 Tools
We use a variety of quantitative tools to analyze and forecast trade, determine potential value chains to carry out the project analysis, and determine nonmonetary preference rankings of alternative cross-border value chains for the border area development program. A summary of the analytical tools is shown in Figure 2.2, which include the following:
(i) Trade analysis invokes a variety of tools, including product diversification analysis based on the Herfindahl-Hirschman product concentration index, revealed comparative analysis, trade complementarities analysis, application of the similarity index, intra-industry trade index, construction of bilateral real exchange rate indices, and analysis of trade costs.
(ii) Econometric modeling and forecasting of the demand for goods and services relies on both the gravity model and error correction model, as well as time-series forecasts based on autoregressive distributed lag models.
(iii) Cross-border value chains are identified according to rankings by industry-based levels of technological sophistication, government priorities, and business perception
2 ADB. 2017. BIMP-EAGA’s Economic Corridors Business Perceptions about the Investment Climate. Manila; ADB.
surveys. The results allow us to identify upstream and downstream linkages between Sarawak and West Kalimantan.
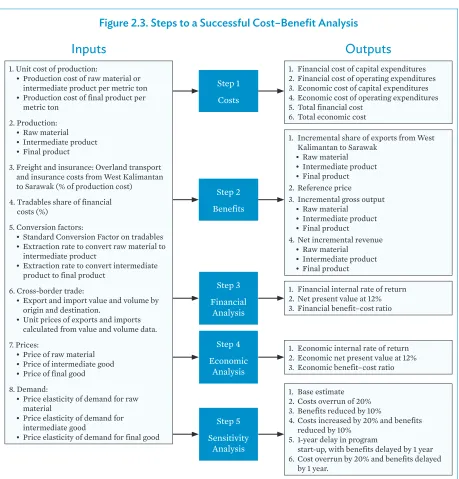
(iv) Cost–benefit analysis to determine the economic viability of cross-border trade in goods and services (Figure 2.3).
(v) Nonmonetary preference ordering of projects rely on perception surveys of businesses and government officials using the Likert Scale.
Figure 2.2. Quantitative Tools Used in Each Part of the Study
Source: Representation by the authors.
Part IV: Trade Analysis • Product diversification • Poduct sophistication analysis • Revealed comparative advantages • Trade complementarity analysis • Intra-industry trade analysis
• Real cross-rate analysis (or analysis of real bilateral exchange rate movements) • Construction of trade costs
1
2
3
4
5
Part VIII: Nonmonetized Project Appraisal• Ranking preferences
• Use of Likert Scale
Part V: Trade Modeling
• Econometric modeling (gravity models and error correction models
• Constant-market-share analysis • Econometric forecasting
Part VI: Cross-Border Value Chains
• Technology-intensive value chain analysis • Business perception analysis valuation
Part VII: Cost–Benefit Analysis • Gap analysis
Figure 2.3. Steps to a Successful Cost–Benefit Analysis
Source: Representation by the authors. 1. Unit cost of production:
• Production cost of raw material or intermediate product per metric ton
• Production cost of final product per metric ton
2. Production:
• Raw material
• Intermediate product
• Final product
3. Freight and insurance: Overland transport and insurance costs from West Kalimantan to Sarawak (% of production cost) 4. Tradables share of financial
costs (%)
5. Conversion factors:
• Standard Conversion Factor on tradables
• Extraction rate to convert raw material to intermediate product
• Extraction rate to convert intermediate product to final product
6. Cross-border trade:
• Export and import value and volume by origin and destination.
• Unit prices of exports and imports calculated from value and volume data. 7. Prices:
• Price of raw material
• Price of intermediate good
• Price of final good 8. Demand:
• Price elasticity of demand for raw material
• Price elasticity of demand for intermediate good
• Price elasticity of demand for final good
1. Financial cost of capital expenditures 2. Financial cost of operating expenditures 3. Economic cost of capital expenditures 4. Economic cost of operating expenditures 5. Total financial cost
6. Total economic cost
1. Financial internal rate of return 2. Net present value at 12% 3. Financial benefit–cost ratio
1. Economic internal rate of return 2. Economic net present value at 12% 3. Economic benefit–cost ratio 1. Base estimate
2. Costs overrun of 20% 3. Benefits reduced by 10%
4. Costs increased by 20% and benefits reduced by 10%
5. 1-year delay in program
start-up, with benefits delayed by 1 year 6. Cost overrun by 20% and benefits delayed
by 1 year.
1. Incremental share of exports from West Kalimantan to Sarawak
• Raw material
• Intermediate product
• Final product 2. Reference price 3. Incremental gross output
• Raw material
• Intermediate product
• Final product 4. Net incremental revenue
• Raw material
• Intermediate product
• Final product
Inputs
Outputs
Step 1 Costs Step 2 Benefits Step 3 Financial Analysis Step 4 Economic Analysis Step 5 Sensitivity Analysis2.3 Terminology
Province and State
Border Economic Area
Border development programs have evolved in a fairly haphazard manner across the world, often with little or no regard to the experiences and lessons of others. Nor has there been any attempt to create a set of international best practices that can guide the design and implementation of these types of programs, create a common concept framework, and use common terminology. As a result, there is a fairly large variety of programs that vary in coverage and use different terminologies.3 In this study, we adopt the broadest designation of
an economic area located along a border. It can refer to an area limited to a single country or to adjoining border areas of two or more countries. It is used throughout this study to refer to both informal and formal economic zones along a border. In all cases, however, a border economic area has specific services and facilities in customs, logistics, and other areas that help strengthen supply or value chains with the neighboring country.
Border Trade and International Trade
In the context of Sarawak–West Kalimantan trade, border trade is sometimes associated with local goods traded by people living in the border area. This terminology arises in the 1970 BTA, which regulates the amount of goods from Indonesia that can be sold between Indonesia and Malaysia along the border area. It is intended to regulate traditional movements through informal trading routes known as jalan tikus. When reference is made to this type of trade, we use “international border trade” to refer to cross-border commerce of internationally traded goods between Sarawak and West Kalimantan. Unless otherwise noted in this study, the term “border trade” is used in its broader sense to refer to cross-border commerce of internationally traded goods.
Program and Projects
Throughout this study, we use the term “project” to refer to individual investment activities, and “program” to refer to a set of interrelated projects for a particular geographic area or cluster of activities. The two terms are differentiated by their scope and scale. A project has a defined start and end point and specific objectives that, when attained, signify completion. A program consists of a series of related projects that meet an overarching objective. Hence, a program is defined as a group of related projects, managed in a coordinated way to obtain benefits not available from managing the projects individually.
Project Cycle Stages and Phases
In this study, we use stages of the project cycle to denote the six time segments of a project; and we use phases of the project to indicate the two major time segments of a project, namely, the planning and execution of a project.
3 For a review of terminology, see M. Lord and P. Tangtrongjita. 2016. Border Economic Zones in Thailand:
12
3
Coverage
Figure 3.1. Stages of the Pre-Feasibility Study
Source: Representation by the authors.
Stage One West Kalimantan Consultation and Concept Paper
(1 October to 21 November 2017) Fieldwork
(22 November to 4 December 2017) Project Appraisal and Program Design
(5 December 2017 to 30 February 2018)
Stage Two Sarawak Consultation and Concept Paper
(1–31 March 2018) Fieldwork (1–14 April 2018)
Project Appraisal and Program Design (15 April to 31 July 2018)
Stage Three Joint Study Preliminaries (1–18 August 2018) Joint Concept Paper (19 August to 4 September 2018) Joint Project Appraisal and Program Design
(5 September to 10 October 2018)
3.1 Sequence
The study was carried out in three stages over a 1-year period (Figure 3.1). The first, which extended from 1 October 2017 to 30 February 2018, examined opportunities in trade of goods and services from the point of view of West Kalimantan. The second phase, which took place between 1 March and 31 July 2018, examined trade opportunities from Sarawak’s point of view. Together, these two perspectives were used in the third phase of the study to prepare a joint study on potential industry-specific value chains and to design the integrated components needed to implement a program for cross-border trade and investment.
3.2 Coverage
To achieve the objective described in chapter 2, the present study provides two essential work products of the project cycle (Figure 3.2). The first is the main output needed in Stage 1 on identification in the project cycle. The second is the main output for Stage 2 on preparation.
(i) For project identification, this part of the study provides the Project Concept Note, including Scoping Study and Stakeholder Needs Assessment. The Concept Note contains the proposed project objectives, socioeconomic profile and economic analysis of the focal area, potential industry drivers, and soft and hard infrastructure for the border economic area. It also contains a likely action plan for the implementation process. (ii) For the project preparation component, the second part of the study presents the
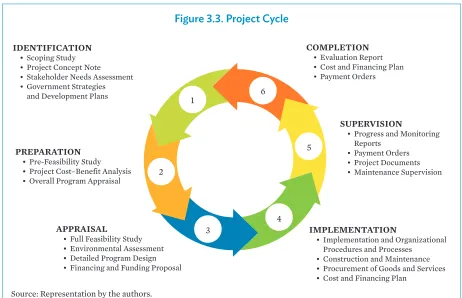
3.3 Project Cycle Context
The project cycle is the framework used to design, prepare, implement, and supervise projects. Its stages are depicted in Figure 3.3 and are widely used by national planning agencies like Malaysia’s Economic Planning Unit (EPU) in the Prime Minister’s Department, Indonesia’s Ministry of National Development Planning (BAPPENAS), as well as international development institutions like ADB and the World Bank.4
4 ADB defines five sequential steps: (i) elaboration of regional cooperation strategy or country partnership strategy,
[image:36.612.147.442.85.503.2](ii) preparation, (iii) approval, (iv) implementation, and (v) completion and evaluation. The World Bank defines six steps: (i) identification, (ii) preparation, (iii) appraisal, (iv) negotiation, (v) implementation and supervision, and (vi) evaluation. Sources: ADB. Project Cycle. https://www.adb.org/site/disclosure/public-communications-policy/cycle; and World Bank. 1993. The World Bank Project Cycle. http://documents.worldbank.org/curated/ en/696601478501928227/pdf/109412-BRI-WBG-PUBLIC-date-04-01-1993-The-World-Bank-Project-Cycle.pdf.
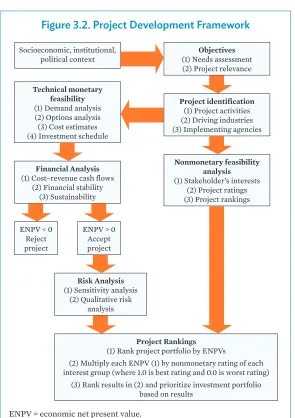
Figure 3.2. Project Development Framework
ENPV = economic net present value. Source: Representation by the authors.
Socioeconomic, institutional,
political context (1) Needs assessmentObjectives (2) Project relevance
Project identification (1) Project activities (2) Driving industries (3) Implementing agencies
Nonmonetary feasibility analysis (1) Stakeholder’s interests
(2) Project ratings (3) Project rankings
Project Rankings (1) Rank project portfolio by ENPVs
(2) Multiply each ENPV (1) by nonmonetary rating of each interest group (where 1.0 is best rating and 0.0 is worst rating)
(3) Rank results in (2) and prioritize investment portfolio based on results
Technical monetary feasibility (1) Demand analysis (2) Options analysis (3) Cost estimates (4) Investment schedule
Financial Analysis (1) Cost–revenue cash flows
(2) Financial stability (3) Sustainability
Risk Analysis (1) Sensitivity analysis
(2) Qualitative risk analysis ENPV < 0
Reject project
The six stages consist of identification, preparation, appraisal, execution, operation, and closure and evaluation. Effective implementation of these steps is especially important when designing a program like the present Sarawak–West Kalimantan border economic area program that consists of a complex set of integrated subprojects to promote cross-border trade in goods and services.
Identification
Projects are identified by the government(s) or the private sector where the intervention will take place. Once identified, the conceptual stage of the project begins, which defines the overall project potential, identifies potential subprojects, eliminates options that are unlikely to yield desired benefits, and determines whether there is sufficient opportunity to justify the investment needed to further the overall project.
Preparation
An analysis is made of the project’s technical, financial, economic, environmental, marketing, management aspects, and potential social impact. The social impact inquiry needs to include an examination of all stakeholder preferences for the project scope. That process will help to guide the focus of the intervention and ensure that it addresses the needs of the potential beneficiaries and those who may be negatively affected. The pre-feasibility study is carried out at this stage. It aims to select the preferred intervention activities from a shortlisted set defined by the scoping study, and then to assess whether the potential net benefits warrant a commitment to proceed with the subsequent step involving the full-fledged feasibility study.
IDENTIFICATION • Scoping Study
• Project Concept Note
• Stakeholder Needs Assessment
[image:37.612.55.517.92.390.2]• Government Strategies and Development Plans
Figure 3.3. Project Cycle
Source: Representation by the authors.
PREPARATION • Pre-Feasibility Study
• Project Cost–Benefit Analysis
• Overall Program Appraisal
COMPLETION • Evaluation Report
• Cost and Financing Plan
• Payment Orders
SUPERVISION
• Progress and Monitoring Reports
• Payment Orders
• Project Documents
• Maintenance Supervision
IMPLEMENTATION
• Implementation and Organizational Procedures and Processes
• Construction and Maintenance
• Procurement of Goods and Services
• Cost and Financing Plan
APPRAISAL
• Full Feasibility Study
• Environmental Assessment
• Detailed Program Design
• Financing and Funding Proposal
1
2
3
Appraisal
An independent assessment is next carried out with a full feasibility study. It determines whether further action justifies moving to the next stage of the project cycle involving project design and construction. The objective of the full feasibility study is to determine the optimum configuration of the project since, once completed, the next stage involves procurement and construction efforts, at which point there is little or no further opportunity to influence the project outcome.
Execution
After approval, the implementation of the project should follow the detailed plans contained in the feasibility study to ensure that project execution costs are in line with expectations contained in the feasibility study. Reasonable alignment of expected and actual costs requires appropriate time and expenditure investment in the feasibility study and excellence in project execution. What little information is available suggests that there exists a record of failure about expectations when compared with outcomes.5 If feasibility studies are to
provide realistic and sufficiently detailed information for project outcomes to reasonably align with expectations, sufficient time and funding need to be given to pre-execution stage of the project.
Supervision
Project oversight has three major objectives. First, it ensures that the funds provided to the project are directed toward the agreed-upon activities. Second, it allows the governments or international development institutions to provide technical assistance to help the project achieve its objectives. Third, it provides a mechanism for due diligence covering the project costs, financing and implementation plans, legal and regulatory requirements, and environmental and social impact.
Closure and Evaluation
The evaluation compares project costs, benefits, timetable, and efficiency with what had been expected at the time of appraisal, and the results feed into the next cycle of projects with suggestions for project performance improvements. The entire process covers inputs, outputs, outcomes, and impacts.
3.4 Concept Report Stage
The aim of the project cycle’s first step, preparation of the concept report, is to determine what the integrated border economic area should look like. The process involves carrying out a scoping study in the province and, based on those findings, preparing a concept report on program design and how it should be prepared and implemented.
5 While published comparisons of expectations versus actual performances are nearly nonexistent, the World
The main components of the concept report are (i) program rationale; (ii) objectives, outputs, outcome, and risks; (iii) geographic delimitation of the program; (iv) socioeconomic profile of the province; (v) policy and regulatory framework; (vi) economic analysis, including comparative advantages and competitiveness and complementarities analyses; (vii) strengths, weaknesses, opportunities, and threats (SWOT) analysis; (viii) program strategy and masterplan; (ix) program components; and (x) potential cross-border value chains (Figure 3.2).
3.5 Pre-Feasibility Study Stage
The aim of the project cycle’s second step, preparation of the pre-feasibility study, is to determine whether the subprojects have a solid market and sound financial base; and whether they support the objectives of stakeholders that include the public and private sectors, the donor community, and households. In the context of government and ADB support to the program, it also aims to determine possible capacity building through technical assistance needed to promote and develop specific projects and overcome obstacles to cross-border trade and investment.
This pre-feasibility study follows standard international practices for the steps needed to carry out such an analysis. First, it conceptualizes the interrelationship between different cross-border components that are needed to make the program successful in reaching well-defined objectives specified by the governments of Indonesia and Malaysia. Second, it determines the key project parameters in terms of location, financial requirements, technical support needed, gains to major beneficiaries, preliminary cost estimates, financial and economi